Abstract
Several mammalian cytochrome P450 (P450) isoforms demonstrate homotropic cooperativity with a number of substrates, including steroids and polycyclic aromatic hydrocarbons. To identify structural factors contributing to steroid and polycyclic aromatic hydrocarbon binding to P450 enzymes and to determine the location of the allosteric site, we investigated interactions of the macrolide hydroxylase P450eryF from Saccharopolyspora erythraea with androstenedione and 9-aminophenanthrene. Spectroscopic binding assays indicate that P450eryF binds androstenedione with an affinity of 365 μM and a Hill coefficient of 1.31 ± 0.6 and coordinates with 9-aminophenanthrene with an affinity of 91 μM and a Hill coefficient of 1.38 ± 0.2. Crystals of complexes of androstenedione and 9-aminophenanthrene with P450eryF were grown and diffracted to 2.1 Å and 2.35 Å, respectively. Electron density maps indicate that for both complexes two ligand molecules are simultaneously present in the active site. The P450eryF/androstenedione model was refined to an r = 18.9%, and the two androstenedione molecules have similar conformations. The proximal androstenedione is positioned such that the α-face of carbon-6 is closest to the heme iron, and the second steroid molecule is positioned 5.5 Å distal in the active site. The P450eryF/9-aminophenanthrene model was refined to an r = 19.7% with the proximal 9-aminophenanthrene coordinated with the heme iron through the 9-amino group and the second ligand positioned ≈6 Å distal in the active site. These results establish that homotropic cooperativity in ligand binding can result from binding of two substrate molecules within the active site pocket without major conformational changes in the protein.
Cytochrome P450 (P450) monoxygenases are a widely distributed class of b-type heme proteins that catalyze the oxidation of many physiologically important compounds including steroid hormones, vitamin D, and bile acids (1–4). Mammalian P450s also participate in the metabolism of a variety of drugs and provide one of the primary means by which the body rids itself of toxic substances. The mammalian enzymes differ widely in substrate and hydroxylation specificity with some, such as the steroid hydroxylases, having narrow substrate specificity and stereospecific hydroxylation. In contrast, the xenobiotic-metabolizing enzymes of the human liver, of which P4503A4 is the most abundant (5), have broad substrate and hydroxylation specificity (6, 7). The active site structures and identification of the residues responsible for substrate and hydroxylation specificity of the mammalian P450s have been the focus of much interest because of their role in carcinogenesis and the potential for structure-based drug design.
Because the mammalian P450 enzymes have not proven amenable to x-ray crystallographic studies, much of our understanding of substrate binding and hydroxylation specificity is derived from kinetic analysis, mutagenesis studies, and molecular models. Extensive kinetic analysis has been performed on the human cytochrome P4503A4, one of the most important xenobiotic-metabolizing enzymes. The P4503A family has been shown to demonstrate homotropic cooperativity toward a number of substrates. Cooperativity has been shown with the steroids progesterone (8–11), testosterone (11, 12), and estradiol (12), and also with aflotoxin B (12) and amitriplyline (12). Heterotropic cooperativity in the P4503A family is also well documented. Flavonoid compounds have been shown to alter the binding and/or activity toward steroids (8–11, 13) and polycyclic aromatic hydrocarbons (PAH) (14, 15). Several mechanisms of P4503A4 cooperativity and modulation have been proposed. Johnson and coworkers originally proposed the presence of a distinct allosteric site to explain both cooperativity and flavonoid stimulation (16, 17). Binding of an effector to this site would result in a conformational change that alters the active site. An alternative mechanism for the modulation of P450 activity has been proposed in which the substrate and activator bind simultaneously to the same active site and specific interactions between the activator and the P450 change the effective dimensions of the active site (11, 15). These two models for cooperativity and flavonoid modulation of P450s are not mutually exclusive and differ primarily in the proximity of the effector and substrate-binding sites.
Mutagenesis studies based on a P4503A4 molecular model support the model of close proximity of the effector and substrate-binding sites. Recently, Szklarz and Halpert described a three-dimensional model for P4503A4 based on the crystallographic coordinates of four bacterial P450s: P450cam, P450BM3, P450terp, and P450eryF (18). In the P4503A4 model, the active site most closely resembles P450eryF, which results in an enlarged substrate-binding pocket in agreement with the ability of P4503A4 to oxidize large compounds. Models were generated with the steroid progesterone and the macrolide antibiotic erythromycin docked in the active site of P4503A4. On the basis of these models, it was suggested that P4503A4 might be capable of simultaneously binding two substrates or a substrate and an effector in the active site. Mutagenesis studies on P4503A4 support this hypothesis. Halpert and coworkers found that mutagenesis of residues proposed to be in the active site of P4503A4 altered flavonoid modulation, homotropic cooperativity, and/or substrate binding (9–11, 19). These results support the molecular model of P4503A4 with an active site similar to P450eryF and the hypothesis that the effector and substrate binding sites are in close proximity within the active site.
P450eryF participates in the biosynthesis of the antibiotic erythromycin in the actinomycete bacterium Saccharopolyspora erythraea and catalyzes the C6-hydroxylation of the macrolide 6-deoxyerythronolide B (6-DEB) (20, 21). The x-ray crystallographic structure of the P450eryF/6-DEB complex reveals that P450eryF has an enlarged active site compared with the other bacterial enzymes because of a change in the position of the B′ and F helices (22, 23). Because P450eryF has a large active site, we reasoned that P450eryF could be capable of binding the large substrates of the mammalian P450s. This study details spectral binding assays and x-ray crystallographic structures of P450eryF with the steroid androstenedione and the PAH 9-aminophenanthrene. We find that P450eryF displays homotropic cooperativity similar to P4503A4, and x-ray crystallographic studies indicate that two substrates are simultaneously present in the active site. This study provides definitive evidence that homotropic cooperativity in P450s can arise because of the binding of two substrates in the active site pocket. Furthermore, the results presented may also be useful in interpreting heterotropic cooperativity and flavonoid modulation of P450s.
Materials and Methods
Chemicals.
Standard reagents were purchased from Sigma. Androstenedione (4-androsten-3, 17-dione) was obtained from Steraloids (Wilton, NH), and 9-aminophenanthrene was purchased from Aldrich.
Protein Purification and Crystallization.
P450eryF was expressed in Escherichia coli (DH5αF′) by using the pTrc99A-based plasmid pWHM808 (21). Expression and purification procedures were as previously described (22). Crystals of P450eryF with androstenedione and 9-aminophenanthrene were grown by the hanging drop vapor diffusion method by using 24% polyethylene glycol-4000, 0.2M NaAc, 0.1M Tris⋅HCl, pH 8.5, as the mother liquor at 22°C (22, 23). Before crystallization, androstenedione or 9-aminophenanthrene was added to the protein (400 μM) at a concentration of 800 μM and 400 μM, respectively, and allowed to incubate at 22°C for 15 min. This protein mixture was used to prepare crystal boxes. Both crystal forms required microseeding and one round of macroseeding to obtain crystals large enough for in-house x-ray diffraction (smallest dimension ≈0.2 mm). X-ray diffraction was performed at the University of California, Irvine, by using a Rikau rotating anode x-ray generator and an R-axis image plate detector. For both crystal forms, data were collected from a single crystal at room temperature. X-ray diffraction data were processed by using the denzo/hkl program suite (24).
Spectral Binding Assays.
Ligand-induced spectral shifts were monitored by using a DU640 (Beckman Coulter) spectrophotometer. Samples contained 5 μM P450 in the crystallization mother liquor of 24% polyethylene glycol-4000, 0.1 M Tris⋅HCl, pH 8.5, 0.2 M NaAc at 22°C. Androstenedione and 9-aminophenanthrene were dissolved in ethanol at a stock concentration of 50 mM and 30 mM, respectively. Spectral binding assays were carried out by difference spectra with the addition of substrate dissolved in ethanol to the sample cuvette and ethanol to the reference cuvette. For each ligand, two binding assays of 19 ligand concentrations were performed. The concentrations of free ligand were calculated by using the equation: ligandfree = ligandtotal − [P450] ΔA/Amax (25).
Model Building and Refinement.
2Fo − Fc and Fo − Fc maps were calculated by using x-plor (26), and the electron density map fitting was carried out by using tom (27). Simulated annealing and B-factor refinements were performed in x-plor. Initial electron density maps were calculated by using the P450eryF/6-DEB coordinates in which 6-DEB and all active site water molecules were deleted and B-factors reset to 20. The Fo − Fc map generated by using this model was used as a guide to modify the water structure and examine the accuracy of the protein model. Waters were added to the active site where visible at +3σ on the Fo − Fc map. Coordinates for androstenedione and 9-aminophenanthrene were obtained from the Cambridge Database and x-plor parameter and topology files generated by using the HIC-Up site at www.alpha2.bmc.uu.se/hicup. After including the first steroid or PAH molecule, the model was refined, and new maps were generated. The second steroid or PAH was modeled by using these maps. The final model was subjected to simulated annealing and B-factor refinement. Coordinates have been deposited in the PDB database.
Results
Spectral Binding Analyses.
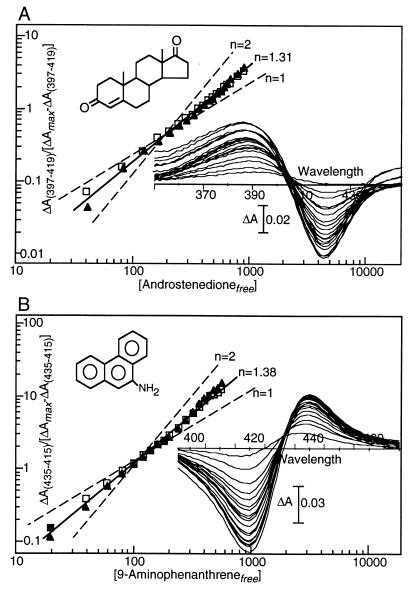
Computer-generated space-filling models indicate that steroids and PAHs are smaller than the substrate of P450eryF, 6-DEB, and model building suggests that the active site of P450eryF is large enough to accommodate these compounds. To determine whether the steroid androstenedione and the PAH 9-aminophenanthrene bind to P450eryF, spectral binding assays were performed. Androstenedione and 9-aminophenanthrene were selected as ligands because they displayed the highest affinity and solubility in the aqueous assay and crystallization buffers of the steroids or PAHs examined. Fig. 1A shows the spectral titration results obtained with androstenedione. Absorption spectra of P450eryF with androstenedione indicate a spectral shift from a low-spin state (Soret peak at 418 nm) to a high-spin state (Soret peak at 397 nm) on ligand binding. This spin shift is similar to the shift observed with 6-DEB binding to P450eryF and is presumably because of displacement of the water ligand from the heme (28, 29). Analysis of the data by using the Hill equation yields half-maximal binding at 365 μM ± 15 μM. The affinity for androstenedione is ≈400-fold less than the affinity for the substrate, 6-DEB, and androstenedione resulted in a maximal spectral shift of only 44% conversion to the high-spin state. P450eryF, however, displayed a Hill coefficient of 1.31 ± 0.6 with androstenedione indicating homotropic cooperativity and the presence of at least two steroid-binding sites.
Figure 1.
Ligand-induced spectral shifts of P450eryF. (A) Effects of androstenedione. Duplicate assays were performed by using 19 substrate concentrations ranging from 40–880 μM; difference spectra from a single assay are shown. Data from two experiments (open and closed symbols) are presented in the form of a Hill plot: the Hill coefficient observed, n = 1.31 ± 0.6, is shown by a solid line, and plots for n = 1 and 2 are shown as dashed lines for comparison. (B) Spectral shifts induced by 9-aminophenanthrene. Duplicate assays were performed by using 19 ligand concentrations ranging from 20 μM-560 μM. Data from two experiments (open and closed symbols) are presented in the form of a Hill plot: the Hill coefficient observed, n = 1.38 ± 0.2, is shown by a solid line, and plots for n = 1 and 2 are shown as dashed lines for comparison.
Fig. 1B shows spectral titration results with 9-aminophenanthrene. This derivative of phenanthrene was chosen to increase the solubility of the PAH in the aqueous assay and crystallization buffers. Binding of 9-aminophenanthrene shifts the Soret maximum from 418 nm to 422 nm, indicating nitrogen coordination to the heme iron (25). Analysis of the titration by using the Hill equation yields a Hill coefficient of 1.38 ± 0.2 and half-maximal saturation at 91 μM ± 5 μM. As found with androstenedione, P450eryF displays homotropic cooperativity with 9-aminophenanthrene, and the Hill coefficient indicates that at least two PAH-binding sites are present. In contrast to androstenedione and 9-aminophenanthrene, spectral binding assays under identical conditions with the natural substrate of P450eryF (6-DEB) yields a Hill coefficient of 0.92 with a half-maximal saturation at 10 μM (data not shown). To our knowledge, this is the first report of homotropic cooperativity with a bacterial P450.
P450eryF/Androstenedione Crystal Structure.
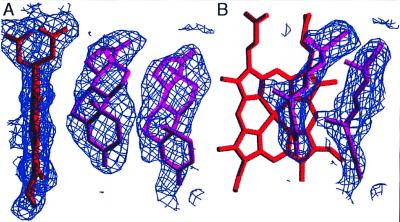
To determine the binding sites for androstenedione, crystals of P450eryF (400 μM) were grown in the presence of saturating androstenedione (800 μM). Under the crystallization conditions used, P450eryF will not crystallize in the absence of a bound ligand, suggesting that androstenedione binding occurred. The P450eryF/androstenedione crystals diffracted to 2.1 Å and 133,137 observations (23,377 unique) were collected with an Rsymm of 8.2%. The initial 2Fo − Fc electron density map obtained without androstenedione included in the model revealed two large regions of electron density in the active site that appeared to correspond to two steroid molecules. The electron density nearest the heme group was well defined with the α and β faces of the steroid clearly distinguishable, and this androstenedione molecule (Andro1) was modeled first.
After refinement of Andro1, the second region of electron density was modeled. This region of density was less defined than the first, and the α and β faces of the steroid were not easily identified. To confirm that this second region of electron density was not water, we attempted to refine the model with water in the site. The 2Fo − Fc electron density map generated from this model suggested that water was not correct at this position. The electron density remained flat, indicative of a ring structure, and there was no definition of density around individual water molecules. In addition, water molecules were arranged in a planar pattern to accommodate the electron density, and this is not a geometrically favored structure for optimum H-bonding. These results suggest that the second electron density is not water but rather a second steroid. Despite not being able to identify the α and β faces of the steroid in the second region of electron density, the location of the A-ring and its carbonyl were visible and used to position a second androstenedione (Andro2) in this site. B-factor refinement of the final model resulted in Andro2 having a higher thermal motion (Bave = 45) than Andro1 (Bave = 35). Because B-factor and occupancy cannot be refined simultaneously in x-plor, a higher B-factor may indicate a decreased occupancy. With the occupancy set at 77% for Andro2, its overall B-factor was the same as Andro1. Refinement of the P450eryF model containing Andro1 and Andro2 gave an r = 18.9%. The final 2Fo − Fc electron density map surrounding the two androstenediones is shown in Fig. 2.
Figure 2.
The final 2Fo − Fc electron density map and model for the P450eryF/androstenedione structure. Two views are shown (A and B), and electron density is displayed only for the region surrounding the active site. Figures were generated by using the program setor (30).
The two androstenedione molecules have similar conformations, with Andro1 positioned such that the α-face of carbon-6 is closest to the heme, 3.87 Å from the central iron, and Andro2 positioned 5.5 Å distal in the active site from Andro1. Fig. 3 shows two views of the active site of P450eryF with androstenedione bound, and residues within 4 Å of the steroids are indicated (listed in Table 1). In addition to the protein–steroid interactions, Andro1 and Andro2 also have interactions with one another. As can be seen in Fig. 3, the majority of protein–steroid interactions occur with the A- and B-rings, whereas the closest steroid–steroid interactions occur between the C and D rings of Andro1 and Andro2.
Figure 3.
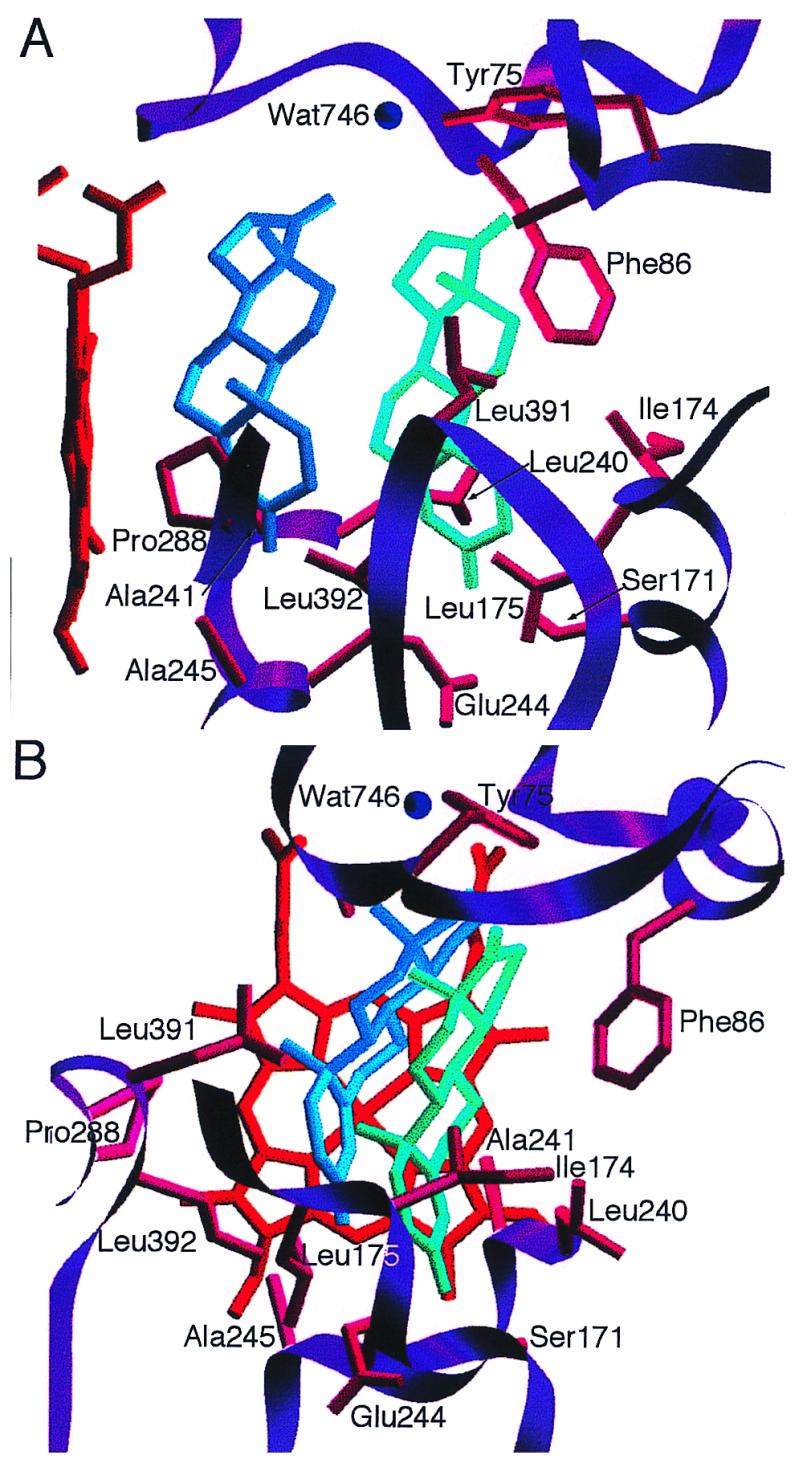
Position of androstenedione in the active site of P450eryF. Two views are shown (A and B). Residues within 4 Å of the ligands that may contact the ligands are shown.
Table 1.
Interactions of P450eryF with androstenedione and 9-aminophenanthrene
| Andro1 | 3A4 | Andro2 | 3A4 | PAH1 | 3A4 | PAH2 | 3A4 |
|---|---|---|---|---|---|---|---|
| Asn-89 | Ala-117 | Ala-74 | — | Gly-91 | Ser-119 | Ala-74 | — |
| Gly-91 | Ser-119 | Tyr-75 | Thr-103 | Val-237 | Ile-301 | Phe-78 | Arg-106 |
| Thr-92 | Ile-120 | Phe-86 | Met-114 | Ala-241 | Ala-305 | Phe-86 | Met-114 |
| Ala-241 | Ala-305 | Ser-171 | Leu-211 | Pro-288 | Ala-370 | Val-237 | Ile-301 |
| Glu-244 | Glu-308 | Ile-174 | Asp-214 | Leu-392 | Gly-480 | Ala-241 | Ala-305 |
| Ala-245 | Thr-309 | Leu-175 | Phe-215 | Leu-391 | Leu-479 | ||
| Glu-288 | Met-371 | Leu-240 | Phe-304 | ||||
| Leu-392 | Gly-480 | Ala-241 | Ala-305 | ||||
| Wat-746 | — | Glu-244 | Glu-308 | ||||
| Leu-391 | Leu-479 |
Homologous residues of P4503A4 are given.
The P450eryF/androstenedione structure defines the two androstenedione-binding sites and demonstrates how the steroids interact to bring about homotropic cooperativity. Binding of Andro2 decreases the effective size and increases the hydrophobicity of the active site. These changes are expected to result in an increase in binding affinity of Andro1 on binding of Andro2, thereby yielding homotropic cooperativity.
P450eryF/9-Aminophenanthrene Crystal Structure.
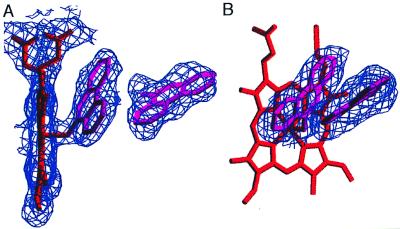
Spectral titrations with 9-aminophenanthrene resulted in a Hill coefficient >1, indicating at least two PAH-binding sites. To determine whether the PAH-binding sites are similar to the two steroid-binding sites, crystals of P450eryF (400 μM) were grown in the presence of 9-aminophenanthrene (400 μM). These crystals diffracted to 2.35 Å, and 95,558 observations (17,093 unique) were collected with an Rsymm of 8.1%. As seen with the androstenedione electron density map, the initial 2Fo − Fc electron density map obtained without 9-aminophenanthrene included in the model contained two large regions of density in the active site. The density nearest the heme group was well defined, and 9-aminophenanthrene was modeled into this electron density (PAH1) with the nitrogen at position 9 coordinated with the heme iron as indicated by spectral binding data. Despite having less defined electron density for the distal PAH molecule, the locations of the B-ring and the 9-amino group were visible and used to position a second 9-aminophenanthrene molecule (PAH2). The P450eryF model containing PAH1 and PAH2 was refined by using the x-plor program suite to an R-value of 19.7%, and B-factor refinement indicated that PAH1 has a lower thermal motion (Bave = 25) than PAH2 (Bave = 35). Because PAH1 is coordinated to the heme iron, a low average B-factor is expected and may account for the difference in the average B-factors of PAH1 and PAH2. As seen with the androstenedione model, the difference in thermal motion may also be caused by decreased occupancy of PAH2 with occupancy of 72% yielding an average B-factor similar to PAH1. The final 2Fo − Fc electron density map surrounding the 9-aminophenanthrenes is shown in Fig. 4.
Figure 4.
The final 2Fo − Fc electron density map and model for the P450eryF/9-aminophenanthrene structure. Two views are shown (A and B), and electron density is displayed only for the region surrounding the active site.
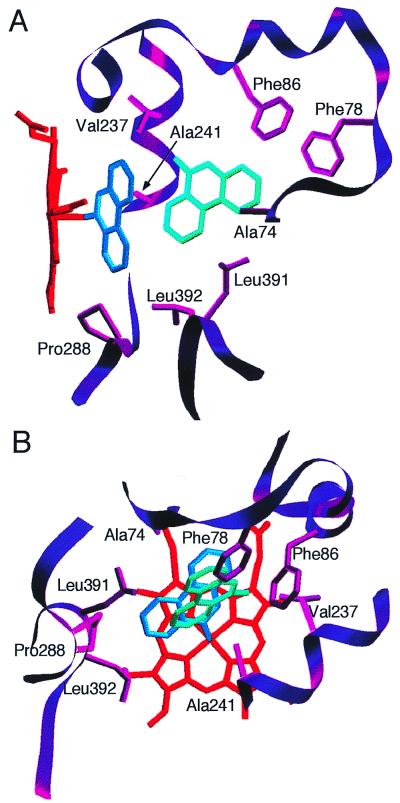
Fig. 5 shows two views of the P450eryF active site with 9-aminophenanthrene bound, and residues within 4 Å of PAH1 and PAH2 are indicated (listed in Table 1). Unlike the results with androstenedione in which the two steroid molecules are in similar conformations, the two PAH molecules are not coplanar; the plane of PAH2 is tilted ≈30° relative to PAH1. In addition, PAH2 is rotated ≈80° compared with PAH1. Positioning of PAH1 is dictated by the coordination of the 9-amino group to the heme iron, whereas PAH2 is rotated to optimize ring stacking with phenylalanine residues at position 78 and 86. In addition, the rotation of PAH2 allows for interactions between the C-rings (carbons 12–18) of PAH2 and PAH1.
Figure 5.
9-Aminophenanthrene in the active site of P450eryF. Two views are shown (A and B). Residues within 4 Å of the ligands that may contact the ligands are shown.
The structure of the P450eryF/9-aminophenanthrene complex demonstrates that P450 enzymes can bind 2 PAH molecules in the active site. As found with androstenedione, the binding of the second ligand may bring about homotropic cooperativity by decreasing the effective size and increasing the hydrophobicity of the active site.
Comparison to P450eryF/6-DEB.
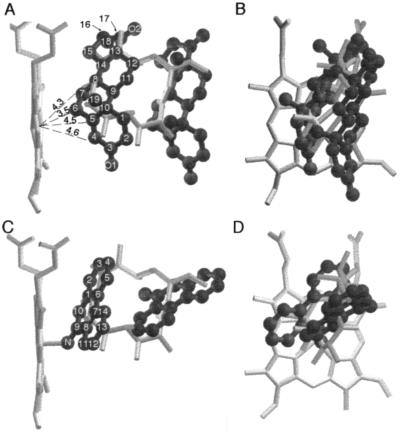
The macrolide 6-DEB is the physiological substrate of cytochrome P450eryF, and the x-ray crystal structure of the P450eryF/6-DEB complex has been determined (23). In P450eryF, the B′ and F helices are positioned differently than in the other bacterial P450s whose structures have been determined, enlarging the substrate binding pocket and allowing the large macrolide to bind. 6-DEB is positioned in the active site with the macrolide ring perpendicular to the heme–porphyrin ring, and carbon-6, the site of hydroxylation, is 4.8 Å from the heme iron. Comparisons of the positions of the two steroids and PAH molecules with that of 6-DEB are shown in Fig. 6. Both the steroid and PAH molecules occupy similar space to that occupied by 6-DEB. The two steroid or PAH molecules are completely within the ligand-binding pocket of P450eryF, and binding is accomplished without conformational changes in the protein molecule. This suggests that other P450 enzymes that bind large substrates may have the capacity to bind two smaller substrates or effectors, with the two smaller ligands occupying similar space to that occupied by the normal substrate.
Figure 6.
Superposition of the P450eryF/6-DEB structure with P450eryF/androstenedione (A and B) or P450eryF/9-aminophenanthrene (C and D). Two views of each structure are presented. The heme group and 6-DEB are shown as stick models, and androstenedione and 9-aminophenanthrene are shown as solid ball-and-stick models. The numbering systems of androstenedione and 9-aminophenanthrene are indicated, and the distances (Å) to the heme iron of carbons 4–7 of Andro1 are given.
Discussion
The mechanism of cooperativity in the mammalian P450s has been a longstanding question, but there has been no structural information on how effectors bind to the P450 enzymes or how this binding alters the substrate-binding site. Our findings establish that cooperativity in ligand binding can occur as a result of binding of two molecules within the same active site. To our knowledge, these results are the first example of cooperativity with a bacterial P450, and the degree of cooperativity observed is similar to that displayed by mammalian P450s. P4503A4 has been shown to have a Hill coefficient ≈1.3 with the steroids progesterone and testosterone (11), and therefore the mechanism of cooperativity of the bacterial P450eryF may provide a model for the mammalian P450 enzymes for which we have no crystal structures.
Kinetic and mutagenesis studies on P4503A4 suggest that the mechanism of cooperativity in mammalian P450s is likely to have a similar structural basis to that of P450eryF. Halpert and coworkers have performed extensive mutagenesis studies on P4503A4 in an attempt to identify residues that form or influence the enzyme active site and/or effector-binding site. Alanine-scanning mutagenesis of residues 210–216 in P4503A4, which are predicted to be within the active site, indicated that substitution of alanine for Leu-210 reduced cooperativity and changed the regioselectivity of testosterone hydroxylation (10). Replacement of Leu-211 with alanine also decreased cooperativity (10). Halpert and coworkers also replaced Leu-211 and Asp-214 with larger amino acids in an attempt to mimic the action of the effector (11). The L211F/D214E double mutant did not exhibit homotropic cooperativity toward testosterone and progesterone, but displayed increased affinity for the steroids as if it possessed a single high-affinity steroid-binding site. Table 1 lists residues of P4503A4 that are homologous to those that are in close contact to the steroid or PAH molecules in the active site of P450eryF (18). Ser-171 and Ile-174 of P450eryF align with Leu-211 and Asp-214 of P4503A4, and both of these residues contact Andro2. Mutagenesis of Ala-305 of P4503A4 has also been shown to reduce cooperativity and alter substrate hydroxylation profiles with progesterone and testosterone (19). Ala-305 aligns with Ala-241 of P450eryF, and this residue contacts Andro1 in the androstenedione complex and PAH2 in the 9-aminophenanthrene complex. The fact that Ala-241 of P450eryF contacts the ligand proximal to the heme group in one structure and the distal ligand in the other structure suggests that it is at the interface of the two ligand-binding sites. This may explain how mutagenesis of this residue could result in altering cooperativity and hydroxylation, similar to the results seen with P4503A4 (19).
Our findings also suggest why cooperativity is not observed with all P450 isoforms. On the basis of the mechanism presented, only P450 enzymes with active sites large enough to accommodate multiple ligands will display this type of cooperativity. Among the bacterial P450s whose structures have been determined, P450eryF has the largest active site and is the only one found thus far to display cooperativity. The substrate 6-DEB for P450eryF is significantly larger than steroids or PAHs. The mammalian P450s that display cooperativity are also capable of binding large substrates. The enzymes involved in detoxification of xenobiotics, of which P4503A4 is the major human isozyme, bind a variety of substrates and must have large active sites to accommodate ligands such as erythromycin. Our results indicate that cooperativity need not involve a separate effector-binding site outside of the active site, and that cooperativity can be obtained without major conformational changes.
In addition to homotropic cooperativity, some mammalian P450 enzymes exhibit heterotropic cooperativity with certain ligands. Although our studies have examined only examples of homotropic cooperativity, heterotropic cooperativity may arise by a similar mechanism. In this case, binding of an effector molecule adjacent to a substrate molecule in the same active site could be envisioned to affect both substrate-binding affinity and hydroxylation regiospecificity. The mutagenesis studies with P4503A4 described above identified several residues that altered both homotropic and heterotropic cooperativity consistent with this type of cooperativity mechanism (10, 11, 19). In heterotropic cooperativity, however, the effector would have a higher affinity for the distal binding site, whereas the substrate must have greater affinity for the binding site proximal to the heme. Several flavonoid compounds have been shown to act as effector molecules and to yield heterotropic cooperativity with both steroid and PAH substrates in the mammalian P450 enzymes (8–11, 13). Flavonoids are similar in size to steroids and PAHs, and their effects on cooperativity and substrate regiospecificity may also arise from simultaneous binding with the substrate in the active site. Because of its large substrate-binding pocket, P450eryF may also prove to be a useful model system for investigating the mechanism of heterotropic cooperativity with flavonoid compounds observed with mammalian P450s.
Acknowledgments
This work was supported by Grant MCB-9808763 from the National Science Foundation and by the Camille and Henry Dreyfus Foundation Young Investigator Award.
Abbreviations
- P450
cytochrome P450
- 6-DEB
6-deoxyerythronolide B
- PAH
polycyclic aromatic hydrocarbon
Footnotes
This paper was submitted directly (Track II) to the PNAS office.
Data deposition: The atomic coordinates have been deposited in the Protein Data Bank, www.rcsb.org (PDB ID codes 1EH0 and 1EGY).
Article published online before print: Proc. Natl. Acad. Sci. USA, 10.1073/pnas.050406897.
Article and publication date are at www.pnas.org/cgi/doi/10.1073/pnas.050406897
References
- 1.Ortiz de Montellano P R, editor. Cytochrome P450: Structure, Mechanism, and Biochemistry. New York: Plenum; 1986. [Google Scholar]
- 2.Gunsalus I C, Pederson T C, Sligar S G. Annu Rev Biochem. 1975;44:377–407. doi: 10.1146/annurev.bi.44.070175.002113. [DOI] [PubMed] [Google Scholar]
- 3.Hayaishi O. Molecular Mechanisms of O2 Activation. New York: Academic; 1974. [Google Scholar]
- 4.Porter T D, Coon M J. FASEB J. 1992;6:669–673. doi: 10.1096/fasebj.6.2.1537454. [DOI] [PubMed] [Google Scholar]
- 5.Guengerich F P. FASEB J. 1992;6:745–748. doi: 10.1096/fasebj.6.2.1537465. [DOI] [PubMed] [Google Scholar]
- 6.Guengerich F P. Chem Res Toxicol. 1990;3:363–371. doi: 10.1021/tx00016a015. [DOI] [PubMed] [Google Scholar]
- 7.Guengerich F P. In: Cytochrome P450: Structure, Mechanism, and Biochemistry. Ortiz de Montellano P R, editor. New York: Plenum; 1995. [Google Scholar]
- 8.Schwab E E, Raucy J L, Johnson E F. Mol Pharmacol. 1988;33:493–499. [PubMed] [Google Scholar]
- 9.He Y A, He Y Q, Szklarz G D, Halpert J R. Biochemistry. 1997;36:8831–8839. doi: 10.1021/bi970182i. [DOI] [PubMed] [Google Scholar]
- 10.Harlow G R, Halpert J R. J Biol Chem. 1997;272:5396–5402. doi: 10.1074/jbc.272.9.5396. [DOI] [PubMed] [Google Scholar]
- 11.Harlow G R, Halpert J R. Proc Natl Acad Sci USA. 1998;95:6636–6641. doi: 10.1073/pnas.95.12.6636. [DOI] [PMC free article] [PubMed] [Google Scholar]
- 12.Ueng Y-F, Kuwabara T, Chun Y-J, Guengerich F P. Biochemistry. 1997;36:370–381. doi: 10.1021/bi962359z. [DOI] [PubMed] [Google Scholar]
- 13.Kerlan V, Dreano Y, Bercovici J P, Beaune P H, Floch H H, Berthou F. Biochem Pharmacol. 1992;44:1745–1756. doi: 10.1016/0006-2952(92)90068-t. [DOI] [PubMed] [Google Scholar]
- 14.Koley A P, Buters J T M, Robinson R C, Markowitz A, Friedman F K. J Biol Chem. 1997;272:3149–3152. doi: 10.1074/jbc.272.6.3149. [DOI] [PubMed] [Google Scholar]
- 15.Shou M, Grogan J, Mancewicz J A, Krausz K W, Gonzalez F J, Gelboin H V, Korzekwa K R. Biochemistry. 1994;33:6450–6455. doi: 10.1021/bi00187a009. [DOI] [PubMed] [Google Scholar]
- 16.Johnson E F, Schwab G E, Vickery L E. J Biol Chem. 1988;263:17672–17677. [PubMed] [Google Scholar]
- 17.Schwab E E, Raucy J L, Johnson E F. Mol Pharmacol. 1988;33:493–499. [PubMed] [Google Scholar]
- 18.Szklarz G D, Halpert J R. J Comput Aided Mol Des. 1997;11:265–272. doi: 10.1023/a:1007956612081. [DOI] [PubMed] [Google Scholar]
- 19.Domanski T L, Liu J, Harlow G R, Halpert J R. Arch Biochem Biophys. 1998;350:223–232. doi: 10.1006/abbi.1997.0525. [DOI] [PubMed] [Google Scholar]
- 20.Andersen J F, Hutchinson C R. J Bacteriol. 1992;174:725–735. doi: 10.1128/jb.174.3.725-735.1992. [DOI] [PMC free article] [PubMed] [Google Scholar]
- 21.Shafiee A, Hutchinson C R. J Bacteriol. 1988;170:1548–1553. doi: 10.1128/jb.170.4.1548-1553.1988. [DOI] [PMC free article] [PubMed] [Google Scholar]
- 22.Cupp-Vickery J R, Li H, Poulos T L. Proteins. 1994;20:197–201. doi: 10.1002/prot.340200210. [DOI] [PubMed] [Google Scholar]
- 23.Cupp-Vickery J R, Poulos T L. Nat Struct Biol. 1995;2:144–153. doi: 10.1038/nsb0295-144. [DOI] [PubMed] [Google Scholar]
- 24.Otwinowski Z, Minor W. In: Methods in Enzymology. Carter C W Jr, Sweet R M, editors. Vol. 276. New York: Academic; 1997. pp. 307–326. [DOI] [PubMed] [Google Scholar]
- 25.Vickery L E. Methods Enzymol. 1991;206:548–558. doi: 10.1016/0076-6879(91)06125-m. [DOI] [PubMed] [Google Scholar]
- 26.Brunger A T. x-plor Ver. 3.1. New Haven, CT: Yale Univ. Press; 1992. [Google Scholar]
- 27.Cambillau C, Harjales E. J Mol Graphics. 1987;5:174–177. [Google Scholar]
- 28.Poulos T L, Finzel B C, Howard A J. Biochemistry. 1986;25:5314–5322. doi: 10.1021/bi00366a049. [DOI] [PubMed] [Google Scholar]
- 29.Sligar S G. Biochemistry. 1976;15:5399–5406. doi: 10.1021/bi00669a029. [DOI] [PubMed] [Google Scholar]
- 30.Evans S V. J Mol Graphics. 1993;11:134–138. doi: 10.1016/0263-7855(93)87009-t. [DOI] [PubMed] [Google Scholar]


