Abstract
The K1 protein of Kaposi's sarcoma-associated herpesvirus (KSHV) efficiently transduces extracellular signals to elicit cellular activation events through its cytoplasmic immunoreceptor tyrosine-based activation motif (ITAM). In addition, the extracellular domain of K1 demonstrates regional homology with the immunoglobulin (Ig) family and contains conserved regions (C1 and C2) and variable regions (V1 and V2). To generate mouse monoclonal antibodies directed against the KSHV K1 protein, BALB/c mice were primed and given boosters with K1 protein purified from mammalian cells. Twenty-eight hybridomas were tested for reactivity with K1 protein by enzyme-linked immunosorbent assay, immunofluorescence, flow cytometry, immunohistochemistry, and immunoblotting. Deletion mutants of the K1 extracellular domain were used to map the epitope of each antibody. All antibodies were directed to the Ig, C1, and C2 regions of K1. Furthermore, antibody recognition of a short sequence (amino acids 92 to 125) of the C2 region overlapping with the Ig region of K1 efficiently induced intracellular free calcium mobilization; antibody recognition of the other regions of K1 did not. The efficient signal transduction of K1 induced by antibody stimulation required both the ITAM sequence of the cytoplasmic domain and the normal structure of the extracellular domain. Finally, immunological assays showed that K1 was expressed during the early lytic cycle of viral replication in primary effusion lymphoma cells. K1 was readily detected in multicentric Castleman's disease tissues, whereas it was not detected in Kaposi's sarcoma lesions, suggesting that K1 is preferentially expressed in lymphoid cells. Thus, these results indicate that the conserved regions, particularly the Ig and C2 regions, of the K1 extracellular domain are exposed on the outer surface and play an important role in K1 structure and signal transduction, whereas the variable regions of K1 appear to be away from the surface.
Kaposi's sarcoma (KS) is a multifocal angiogenic tumor consisting of characteristic spindle cells and infiltrating leukocytes (39). KS occurs in several epidemiologically distinct forms and is the most common AIDS-associated tumor (32, 36). Unlike most cancers, KS does not appear to be the result of clonal expansion of a transformed cell. Instead, it appears to be a hyperplastic disorder caused, in part, by local production of inflammatory cytokines, such as interleukin-1 (IL-1), IL-6, gamma interferon (IFN-γ), and tumor necrosis factor alpha (TNF-α), as well as growth factors, such as basic fibroblast growth factor and vascular endothelial growth factor (11-14). This is supported by the fact that infiltration of inflammatory cells, including CD8+ T cells, monocytes, macrophages, and dendritic cells, precedes transformation of the spindle-shaped endothelial cells (3, 21, 35). Infiltrating cells systematically produce inflammatory cytokines that are likely responsible for activating vessels and endothelial cells, increasing adhesiveness with extravasation, and recruiting lymphocytes and monocytes (10, 12).
Based on strong epidemiological and histopathological evidence, KS-associated herpesvirus (KSHV), also called human herpesvirus 8 (HHV8), is thought to be an etiologic agent of KS. KSHV has been consistently identified in KS tumors from human immunodeficiency virus (HIV)-positive and HIV-negative patients (4, 5, 31). KSHV has also been identified in primary effusion lymphoma (PEL) and an immunoblast variant of multicentric Castleman's disease (MCD), which are of B-cell origin (4, 5, 37). The genomic sequence classifies KSHV as a gamma-2 herpesvirus that is closely related to herpesvirus saimiri (HVS) (32, 38) and rhesus monkey rhadinovirus (RRV) (1, 8, 41).
At a position equivalent to the saimiri transformation protein (STP) of HVS (18) and latent membrane protein 1 (LMP1) of Epstein-Barr virus (EBV) (9), KSHV contains a distinct open reading frame called “K1” (24, 30, 47). The K1 gene is expressed at low levels in PEL, and its expression is significantly induced during the lytic phase of the viral life cycle (24). The K1 protein is predicted to have a signal peptide sequence at the amino terminus, an extracellular domain, a transmembrane domain, and a short cytoplasmic tail at the carboxyl terminus (29). The predicted extracellular domain of the K1 protein demonstrates regional homology with the variable region of the λ chain of the immunoglobulin (Ig) light chain (29). Similar to Igα and Igβ, the cytoplasmic region of K1 contains a functional immunoreceptor tyrosine-based activation motif (ITAM), which transduces extracellular signals to elicit cellular activation events (26, 29). In addition, the amino-terminal region of K1 specifically interacts with the μ chains of B-cell antigen receptor (BCR) complexes, and this interaction inhibits the intracellular transport of BCR, resulting in downregulation of BCR surface expression (27). Recent reports have also shown that ITAM-dependent signaling by K1 modestly augments lytic reactivation in KSHV-infected PEL cells (25), whereas it strongly suppresses chemically induced lytic reactivation (28). These observations indicate that K1 has multiple roles in cellular signal transduction and viral lytic reactivation.
Viral glycoproteins exhibit considerable sequence variation, which helps the virus escape host immune recognition (17). The most-well-characterized viral glycoprotein is the HIV-1 envelope (Env) protein (17). Like HIV Env, the extracellular domain of the K1 protein is also extremely variable. Particularly, two 40-amino-acid blocks at the extracellular domain of K1, variable regions 1 and 2 (V1 and V2, respectively), show as much as 85% divergence at the nucleotide level and 60% divergence at the amino acid level (7, 16, 23, 47). Different V1 and V2 regions seem to correspond to different geographic areas (7, 16, 23, 47). Studies of K1 alleles from various KSHV-infected tissues have defined four major subtypes of K1 (A, B, C, and D) and 13 distinct variants and clades similar to those found for the HIV Env protein (16, 19, 47). Examples of the B subtypes are found almost exclusively in KS patients from Africa or of African heritage, whereas the rare D subtypes are found only in KS patients of Pacific Island heritage (16, 19, 33, 47). In contrast, C subtypes are found predominantly in classic KS and in iatrogenic and AIDS KS in the Middle East and Asia, whereas U.S. AIDS KS sample are primarily A1, A4, and C3 variants (33, 47). It is believed that this unusually high diversity reflects some unknown powerful biological selection process that has been acting preferentially on this early lytic cycle membrane signaling protein.
Despite extensive studies of K1 signal transduction and sequence variation, details of K1 expression in virus-infected tissues are mostly unknown. The main reason for this is the lack of suitable K1-specific antibodies. In this report, we describe the generation of K1-specific mouse monoclonal antibodies directed toward K1 expressed and purified from mammalian cells. Analyses with K1 antibodies indicate that K1 is preferentially expressed in lymphoid tissues and that the short sequence between Ig and C2 regions plays a structurally important role in eliciting signal transduction activity.
MATERIALS AND METHODS
Cell culture and transfection.
Cultures of 293T cells were grown in Dulbecco's modified Eagle's medium (DMEM) supplemented with 10% fetal calf serum. BJAB, BCBL-1, JSC-1, BC1, BC2, BC3, BCP1, APK1, and VG1 cells were grown in RPMI 1640 supplemented with 10% fetal calf serum. KSHV-infected PEL cells were induced with 12-O-tetradecanoylphorbol-13-acetate (TPA; 20 ng/ml; Sigma, St. Louis, Mo.). Fugene 6 (Roche, Indianapolis, Ind.) or calcium phosphate (Clontech, Palo Alto, Calif.) was used for transient expression of K1 in 293T cells. Electroporation at 260 V and 975 μF was used for transient expression of K1 in BJAB cells. A stable BJAB cell line expressing K1 was selected and maintained by the presence of G418 (1 mg/ml).
Recombinant K1 protein and protein purification.
The extracellular portion (amino acids 1 to 226) of the predicted K1 protein was fused in frame to the glutathione S-transferase (GST) gene. The K1 DNA fragment was amplified by PCR using primers containing KpnI and BamHI recognition sequences at the ends and subcloned into KpnI and BamHI cloning sites of the pDEF3 vector. The absence of unwanted mutations was confirmed by DNA sequencing. The plasmid was purified by CsCl2 ultracentrifugation and transfected into 293T cells by the calcium phosphate method (Clontech) according to the manufacturer's instructions. The supernatant of 293T cells was harvested 5 days posttransfection, and secreted glycosylated K1-GST fusion protein was purified with a glutathione Sepharose column (Pharmacia, Piscataway, N.J.). The column was eluted with 40 mM glutathione. Control GST protein was also purified from pDEF3-GST-transfected 293T cells by using a glutathione Sepharose column. Purified proteins were dialyzed against phosphate-buffered saline (PBS) overnight.
Plasmid construction.
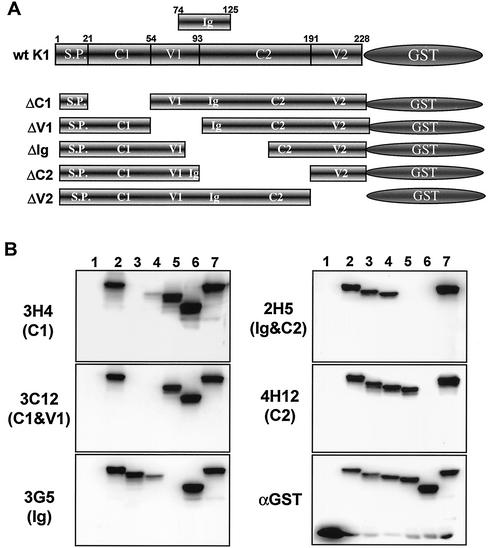
The deletion mutations in the K1 extracellular region were generated by PCR using oligonucleotide-directed mutagenesis. These mutants were K1 ΔC1 (deleting the C1 domain, amino acids 21 to 53), K1 ΔV1 (deleting the V1 domain, amino acids 54 to 93), K1 ΔIg (deleting the Ig domain, amino acids 74 to 125), K1 ΔC2 (deleting the C2 domain, amino acids 94 to 191), and K1 ΔV2 (deleting the V2 domain, amino acids 192 to 228) (see Fig. 2A). After each mutant was completely sequenced to verify the presence of the mutation and the absence of any other changes, it was subcloned into pDEF3-GST vector, the green fluorescent protein (GFP) coexpression vector pTracer-GFP, or the pEF1 expression vector (Invitrogen, San Diego, Calif.). Flag-tagged full-length K1 and its mutants were generated as described previously (26).
FIG. 2.
Epitope mapping of K1 antibodies by immunoblot assay. (A) Schematic diagram of K1-GST mutants. S.P., signal peptide. (B) Reaction of K1 antibodies with wild-type (wt) K1 and its mutants by immunoblot assay. Lysates of 293T cells expressing the wild type and deletion mutants of K1-GST were used for immunoblot assay with anti-K1 antibodies (3H4, 3C12, 3G5, 2H5, and 4H12) and anti-GST (αGST) antibody. Lanes: 1, GST; 2, wild-type K1-GST; 3, K1 ΔC1-GST; 4, K1 ΔV1-GST; 5, K1 ΔIg-GST; 6, K1 ΔC2-GST; and 7, K1 ΔV2-GST. The items in parentheses on the left indicate the region of K1 extracellular domain that did not react with the K1 antibodies. The data were reproduced in at least two independent experiments.
Immunoblots.
Cells were harvested and lysed with lysis buffer (0.15 M NaCl, 1% Nonidet P-40, 50 mM Tris [pH 7.5], 0.1 mM Na2VO3, 1 mM NaF, and protease inhibitors leupeptin, aprotinin, phenylmethylsulfonyl fluoride, and bestatin). For immunoblots, polypeptides from whole-cell lysates were resolved by sodium dodecyl sulfate-polyacrylamide gel electrophoresis (SDS-PAGE) and transferred to nitrocellulose membrane. Immunoblot detection was performed with a 1:2,000 dilution of K1 antibody or anti-GST antibody (Santa Cruz Biotech, Santa Cruz, Calif.). The protein was visualized with chemiluminescent detection reagents (Pierce, Rockford, Ill.) and detected by a Fuji PhosphorImager.
Immunofluorescence.
Cells were fixed with 4% paraformaldehyde for 15 min, permeabilized with cold acetone for 15 min, blocked with 10% goat serum in PBS for 30 min, and reacted with 1:100 to 1:2,000 dilutions of primary antibody in PBS for 30 min at room temperature. After incubation, cells were washed extensively with PBS, incubated with 1:100 diluted Alexa 488- or Alexa 568-conjugated rabbit anti-mouse antibody (Molecular Probes, Eugene, Oreg.) in PBS for 30 min at room temperature, and washed three times with PBS. Nuclear staining was performed for 1 min with To-Pro 3 (Molecular Probes) diluted 1:50,000. Confocal microscopy was performed with a Leica TCS SP laser-scanning microscope (Leica Microsystems, Exton, Pa.) fitted with a ×40 Leica objective (PL APO, 1.4 NA) and with Leica imaging software. Images were collected at a resolution of 512 by 512 pixels. The stained cells were optically sectioned in the z axis, and the images in the different channels (photomultiplier tubes) were collected simultaneously. The step size in the z axis varied from 0.2 to 0.5 μm to obtain 30 to 50 slices per imaged file. The images were transferred to a Macintosh G4 computer (Apple Computer, Cupertino, Calif.), and NIH Image v1.61 software was used to render the images.
FACS analysis.
Cells (5 × 10⁵) were washed with RPMI medium containing 10% fetal calf serum and incubated for 30 min with rabbit polyclonal and mouse monoclonal K1 antibodies, preimmunized rabbit or mouse sera, or anti-Flag antibody (Sigma). Cells were then incubated for 20 min at 4°C with phycoerythrin (PE)-conjugated anti-mouse antibodies (Pharmingen, San Diego, Calif.). After washing, each sample was fixed with 2% paraformaldehyde solution, and fluorescence-activated cell sorter (FACS) analysis was performed with a FACSCalibur (Becton Dickinson, Mountain View, Calif.).
Calcium mobilization analysis.
Cells (2 × 10⁶) were loaded with 1 μM indo-1 in 100 μl of RPMI complete medium for 30 min at 37°C, washed once with complete medium, resuspended in 1 ml of cold RPMI complete medium, and then put on ice until analyzed. Baseline calcium levels were established for 1 min prior to the addition of the antibody. Cells were stimulated with 10 μg of mouse anti-Flag or anti-K1 antibody. In some cases, 10 μg of goat anti-mouse Ig per ml was used for cross-linking. Baseline absolute intracellular calcium levels were determined by using an ionophore and EGTA. Data were collected and analyzed on a FACS Vantage (Becton Dickinson).
Generation of K1 antibodies.
In order to generate antibodies directed against K1-GST in its native form, BALB/c mice were injected with 1 ml of Prestine 1 week before immunization. A portion of purified glycosylated antigen (200 μg) was mixed with complete Freund's adjuvant and injected subcutaneously into six mice. One week later, 100 μg of antigen mixed with incomplete adjuvant was injected into mice, and a reduced amount of antigen was thereafter injected every 2 weeks until a high titer of antibody could be detected in the serum. Two mice that showed the highest activity by enzyme-linked immunosorbent assay (ELISA) were chosen and boosted intravenously with antigen in PBS as a final boosting. Four days after the final booster, the mice were sacrificed and the spleens were removed. Spleen cells were fused with cells of the Sp2/O myeloma line by using polyethylene glycol according to the manufacturer's recommendation (Clonetics). Briefly, fused cells were mixed with methylcellulose-containing HAT (hypoxanthine-aminopterin-thymidine) medium and directly seeded into 10-cm-diameter dishes. Cells were incubated for 10 days until each single cell formed colonies. All colonies derived from the single clone were then picked, inoculated into 24-well plates, and expanded. Some clones were further single-cell cloned by the serial dilution technique if necessary. After fusion and single-cell cloning, each hybridoma supernatant was tested for reactivity against K1-GST protein by ELISA. Rabbit sera were also generated by using mammalian cell-derived K1-GST fusion protein (Rockland, Gilbertsville, Pa.). Secondary antibodies for immunofluorescence and FACS were purchased from Pharmingen (San Diego, Calif.) and Molecular Probes.
ELISA screening of hybridoma culture supernatants.
For antibody capture assays, purified K1-GST protein and GST protein were diluted to 1 μg/ml in PBS (pH 7.5), and wells of a 96-well ELISA plate (Dynex) were coated with 100 μl of the protein solution in coating buffer (pH 9.6) overnight at 4°C. Plates were blocked for 1 h with 1% bovine serum albumin (BSA) in PBS. After blocking, wells were washed with PBS-Tween or water and incubated with hybridoma supernatants for 4 h at room temperature. Plates were washed with PBS and incubated with alkaline phosphatase-conjugated goat anti-mouse Ig (1:4,000; Jackson Laboratories) for 1 h at room temperature. After washing, plates were developed by addition of p-nitrophenyl phosphate (Sigma) in diethanolamine substrate buffer (Pierce).
Purification of K1 monoclonal antibody from hybridoma supernatants.
Antibody was purified from mouse ascites by affinity chromatography on recombinant protein G columns (Gamma Bind Plus; Pharmacia/LKB) according to the manufacturer's instructions. Briefly, ascites were diluted with PBS and loaded directly onto the equilibrated column. The column was washed with equilibration buffer (0.01 M sodium phosphate [pH 7.0], 0.14 M NaCl, 0.01 M EDTA), and antibody was eluted with 0.5 M glycine (pH 2.8), adjusted to pH 7.0 by the addition of 2 M Trizma base. Antibody purity was evaluated by SDS-PAGE and Coomassie blue staining.
Analysis of KS and MCD tissues.
We obtained 13 skin lesions from HIV-positive KS patients and two lymph nodes from HIV-positive MCD patients. Paraffin-embedded tissues were cut into 5-μm sections. The tissues were deparaffinized, rehydrated, and blocked with H2O2 for 5 min. Tissues were unmasked either in citrate buffer (Vector, H-3300) by microwave for 20 min followed by cooling down for 20 min or treated with proteinase K for 5 min, depending on the antibody. Anti-LANA and anti-K1 antibodies were applied at a 1:2,500 dilution in blocking solution (DAKO catalog no. X0909) and incubated at room temperature for 30 min (or at 4°C for 16 h). Biotinylated secondary antibodies—hamster anti-mouse IgG (Vector; BA 2000) for K1 and goat anti-rabbit IgG (Vector, BA 1000) for LANA—were applied at a 1:200 dilution. Immunodetection was performed with Vectastain Elite ABC reagent (Vector; PK-7100) and ready-to-use diaminobenzidine (DAKO catalog no. 003219). All tissues were counterstained with Mayers hematoxylin.
RESULTS
Generation of K1-specific mouse monoclonal antibodies.
Several attempts have been made to generate K1-specific antibodies by a variety of methods (peptides, bacterially purified K1 protein, and insect cell-derived glycosylated K1 protein). The failure of these attempts suggests that, as seen with other glycosylated proteins, generating antibodies against K1 protein may require proper glycosylation of the protein by mammalian cells. Thus, we used mammalian cell-derived K1 protein to generate K1-specific antibody.
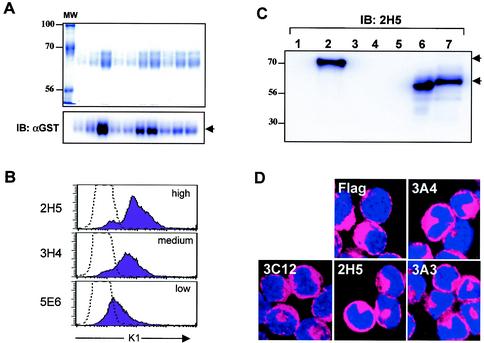
To generate properly glycosylated K1 protein, we used the pDEF-GST-AU1 expression plasmid, which contains the elongation factor promoter and multiple cloning sites linked to a C-terminal AU1 epitope-tagged GST gene. K1 amino acids 1 to 228 of BCBL1 cells, which contain the putative extracellular region without the transmembrane and cytoplasmic regions, were fused in frame into GST-AU1 to create the K1-GST chimera. At 72 h posttransfection with the K1-GST expression vectors, supernatants from 293T cells were harvested. Immunoblotting with anti-GST and anti-AU1 antibodies showed that glycosylated K1-GST protein was efficiently secreted to the supernatant (data not shown). To purify a large quantity of K1-GST protein, 20 liters of supernatant, derived from approximately 1,000 transfections of 293T cells with the pDEF-K1-GST expression vector, was subjected to glutathione affinity chromatography. K1-GST protein was eluted by 40 mM glutathione and dialyzed in PBS overnight. Protein staining showed that K1-GST fusion protein secreted into the supernatant was purified to virtual homogeneity in one step by glutathione affinity chromatography (Fig. 1A). The purified K1-GST specifically reacted with anti-AU1 and anti-GST antibodies (Fig. 1A) (data not shown).
FIG. 1.
Purification of K1-GST protein and antibody production. (A) Purification of K1-GST protein. Supernatants from 293T cells transfected with expression vector pDEF3-K1-GST-AU1 were harvested and run over a glutathione Sepharose resin. Purified proteins were stained with Coomassie blue (top) or subjected to immunoblotting (IB) with an anti-GST antibody (αGST) (bottom). The first lane shows molecular weight (MW) standards, and lanes 2 to 11 contain the K1 proteins from 10 different purifications. (B) Flow cytometry analysis. Surface expression of K1 on BJAB cells was assessed by staining with preimmune mouse serum (dotted line) or anti-K1 antibodies, followed by fluorescein isothiocyanate (FITC)-conjugated anti-mouse secondary antibody. The level of antibody reactivity (high, medium, or low) is indicated. (C) Immunoblot assays. Whole-cell lysates were used for immunoblotting with anti-K1 antibody 2H5. Lanes: 1, 293T cells transfected with pDEF3-GST; 2, 293T cells transfected with pDEF3-K1-GST; 3, 293T cells; 4, Jurkat-T cells; 5, BJAB cells; 6, BJAB-Flag-K1 cells; and 7, BJAB-K1-His cells. The arrows indicate K1 and K1-GST proteins. (D) Immunofluorescence test. BJAB cells expressing the Flag-tagged K1 were fixed, permeabilized, and reacted with anti-Flag or anti-K1 antibodies (3A4, 3C12, 2H5, and 3A3), followed by Alexa 486-conjugated goat anti-mouse IgG. Cells were additionally stained with To-Pro3 solution (blue) for 1 min to show the nucleus. Immunofluorescence was examined with a Leica confocal immunofluorescence microscope, and a single representative optical section is presented.
In order to generate antibody directed against K1 protein in its native form, BALB/c mice were immunized and then twice given boosters with mammalian cell-derived K1-GST fusion protein. Approximately 3 to 4 weeks after the first booster, the mice were bled, and sera were tested by ELISA for reactivity against the purified K1-GST protein. The mice were sacrificed 4 days after final boosting, and the spleens were removed. Spleen cells were fused with the Sp2/O myeloma cell line. Fused cells were seeded into dishes to derive clonal colonies. All colonies derived from single clones were then picked, inoculated into a 24-well plate, and expanded. Some clones were further screened by serial dilution when necessary.
After fusion and single-cell cloning, each hybridoma supernatant was tested for reactivity against the mammalian cell-derived K1-GST protein and GST protein. By ELISA, 28 hybridomas were found to be positive with K1-GST protein, but not with GST protein, at various levels of reactivity (data not shown). Most hybridomas were also positive for reactivity with K1 protein by immunoblotting, immunofluorescence, and flow cytometry assays using BJAB cells stably expressing the Flag-tagged K1 gene (Table 1 and Fig. 1B, C, and D). However, several antibodies, including 1E8, 1B10, 3E5, 4D5, 4C6, and 4G7, reacted with K1 protein only in immunofluorescence and flow cytometry assays, but not in immunoblot assays, indicating that these antibodies react with the conformational epitopes of K1 protein (Table 1). In contrast, the 2G12 antibody strongly reacted with K1 protein in the immunoblot assay, but not in flow cytometry and very weakly in immunofluorescence, indicating that this antibody preferentially recognizes the linear epitope of K1 protein (Table 1).
TABLE 1.
Summary of K1 monoclonal antibodies used in this study
| Clones | Epitope location | Flow cytometrya | Result by:
|
|
|---|---|---|---|---|
| Immunoblotting | Immunofluorescence | |||
| 2A7 | C1 | l | ++++ | ++ |
| 2F8 | m | ++++ | + | |
| 3A4 | l | ++++ | + | |
| 3H4 | m | +++++ | ++ | |
| 5E6 | l | ++++ | +++ | |
| 1G7 | C1 and V1 | h | ++++ | +++ |
| 3D4 | m | +++ | ++ | |
| 3C12 | h | ++++ | +++ | |
| 3D12 | h | +++ | +++ | |
| 5D4 | l | ++ | ++ | |
| 3G5 | Ig | m | + | ++ |
| 1E8 | m | − | + | |
| 1B10 | h | − | + | |
| 3E5 | m/h | − | ++ | |
| 4D5 | h | − | + | |
| 4C6 | m | − | + | |
| 4G7 | l | − | ++ | |
| 1G1 | Ig and C2 | h | ++ | +++++ |
| 2H1 | h | ++ | +++++ | |
| 2F3 | h | ++++ | ++++ | |
| 2H5 | h | ++ | +++++ | |
| 3B11 | h | ++++ | +++++ | |
| 4B11 | h | ++ | +++++ | |
| 4E8 | h | ++ | +++++ | |
| 5E3 | h | ++ | ++++ | |
| 2G12 | C2 | +++ | +/− | |
| 3A3 | l | ++++ | ++ | |
| 4H12 | h | +++ | ++ | |
h, high; m, medium; l, low.
Epitope mapping of K1 antibodies.
The K1 extracellular domain is predicted to have a signal peptide sequence, two conserved regions (C1 and C2), two variable regions (V1 and V2), and an Ig-like region (29, 47). To map the potential epitopes of K1 mouse monoclonal antibodies, several deletion mutant forms of K1-GST fusions were constructed (Fig. 2A). Two days after transfection with an expression vector containing K1-GST or its mutants, the lysates of 293T cells were immunoblotted with anti-GST and anti-K1 mouse monoclonal antibodies. The anti-GST antibody showed similar expression levels for K1-GST and its mutants (Fig. 2B).
Each monoclonal antibody was tested by immunoblot assay of the K1 deletion mutants. Based on the loss of reactivity with specific K1-GST mutants, the epitopes of K1 antibodies 2A7, 2F8, 3A4, 3H4, and 5E6 were in the C1 region; the epitope of antibody 3G5 antibody was in the Ig region; and the epitopes of antibodies 2G12, 3A3, and 4H12 were in the C2 region (Fig. 2B and Table 1). The loss of reactivity with both K1 ΔC1 and K1 ΔV1 fusion proteins indicated that the epitopes of 1G7, 3D4, 3C12, 3D12, and 5D4 were between the C1 and V1 regions. The loss of reactivity with both K1 ΔIg and K1 ΔC2 fusion proteins indicated that the epitopes of 1G1, 2H1, 2H5, 2F3, 3B11, 4B11, 4E8, and 5E3 were in the C2 region overlapping with the Ig region.
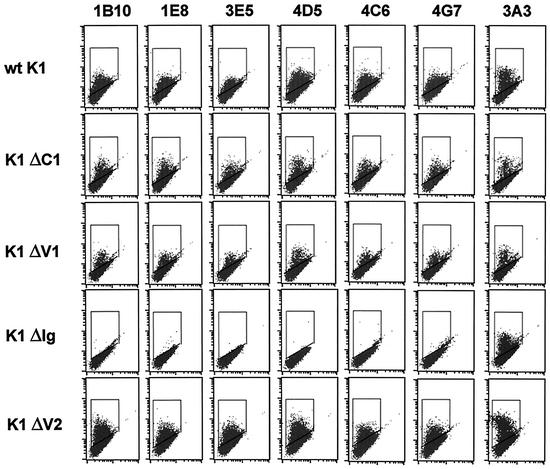
The 1E8, 1B10, 3E5, 4D5, 4C6, and 4G7 antibodies reacted only with nondenatured epitopes of K1 protein (Table 1). In order to define the epitopes of these antibodies, wild-type full-length K1 and its deletion mutants were transiently expressed in BJAB cells. The K1 ΔC2 mutant has poor surface expression, probably due to its large deletion, and was not included in this assay (data not shown). At 24 h postelectroporation, cells were subjected to flow cytometry analysis with 1E8, 1B10, 3E5, 4D5, 4C6, and 4G7 antibodies. Flow cytometry with 3A3 control antibody showed that wild-type K1 and its mutants were expressed at similar levels on BJAB cells, with the exception of K1 ΔV2, which displayed higher surface expression (Fig. 3). To our surprise, 1E8, 1B10, 3E5, 4D5, 4C6, and 4G7 antibodies all displayed the same reactivity: while they readily reacted with wild-type K1, K1 ΔC1, K1 ΔV1, and K1 ΔV2, they all completely lacked reactivity with the K1 ΔIg mutant (Fig. 3). Since the K1 ΔV1 mutant contained a deletion of amino acids 53 to 93 and the K1 ΔIg mutant contained a deletion of amino acids 74 to 125, the potential conformational epitopes of the 1E8, 1B10, 3E5, 4D5, 4C6, and 4G7 antibodies are confined to the short amino acid sequence between amino acids 92 and 125.
FIG. 3.
Conformational epitope mapping of K1 antibody by flow cytometry. BJAB cells were electroporated with pDEF3 containing the full-length or mutant K1 gene indicated. At 24 h postelectroporation, the cells were stained with the indicated K1 antibodies, followed by fluorescein isothiocyanate (FITC)-conjugated anti-mouse secondary antibody. The gated population in the box indicates the K1-positive BJAB cells. wt, wild type.
Induction of intracellular free calcium mobilization upon antibody stimulation of K1.
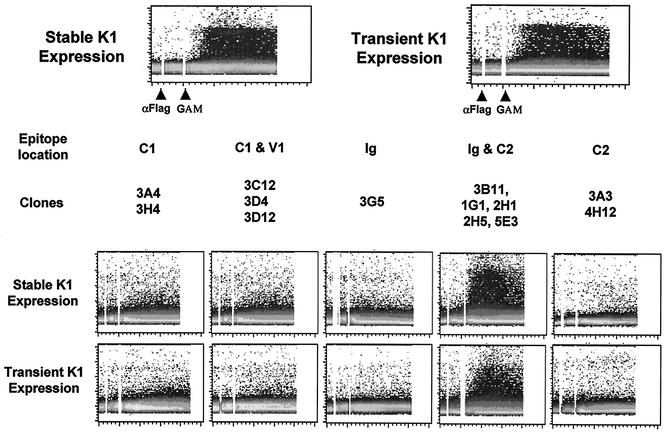
Antibody stimulation of lymphocyte surface molecules has been shown to be sufficient to elicit early and late signal transducing events (44). To determine the ability of K1 antibodies to elicit an increase in cytoplasmic free calcium concentration, BJAB cells stably expressing the Flag-tagged K1 or BJAB cells transiently expressing the Flag-tagged K1 were treated with an anti-Flag antibody, and intracellular free calcium levels were monitored by flow cytometry. As previously shown (28), BJAB-Flag-K1 cells exhibited a prolonged increase in intracellular calcium concentration immediately after anti-Flag antibody stimulation (Fig. 4). K1 antibodies were divided into five groups based on the locations of their epitopes (Table 1). K1 antibodies from each group were used to stimulate BJAB cells stably or transiently expressing Flag-K1. Antibodies were cross-linked with a goat anti-mouse antibody and monitored by flow cytometry to measure intracellular free calcium mobilization. Interestingly, five K1 antibodies (3B11, 1G1, 2H1, 2H5, and 5E3), which all recognize amino acids 92 to 125, were capable of inducing an increase in intracellular calcium concentration and tyrosine phosphorylation (Fig. 4) (data not shown). In contrast, none of antibodies that reacted with the other regions of the K1 extracellular domain were capable of inducing intracellular free calcium mobilization under the same conditions (Fig. 4). These results indicate that the antibodies that react with the short sequence in the C2 region overlapping with the Ig region of K1 are able to stimulate K1.
FIG. 4.
Intracellular free calcium mobilization upon K1 antibody stimulation. For stable K1 expression, neomycin-resistant BJAB cells stably expressed Flag-tagged K1. For transient expression, BJAB cells were electroporated with pTracer-GFP containing the Flag-tagged K1 gene. At 24 h posttransfection, BJAB cells were gated for GFP expression and used for the calcium mobilization assay. Stably and transiently K1-expressing BJAB cells were stimulated with 10 μg of anti-Flag or anti-K1 antibodies, followed by 10 μg of antimouse antibody. Calcium mobilization was monitored over time by changes in the ratio of violet to blue (405 to 485 nm) fluorescence of cells loaded with indo-1 and analyzed by flow cytometry. Data are presented as a histogram of the number of cells with a particular fluorescence ratio (y axis) versus time (x axis). Two arrowheads indicate the addition of anti-Flag (αFlag) or K1 antibody and goat anti-mouse antibody (GAM). The breaks in the graphs indicate the time intervals during addition of antibodies. The data were similar in two independent experiments.
Effect of K1 mutations of the extracellular domain on K1-mediated signal transduction induced by antibody stimulation.
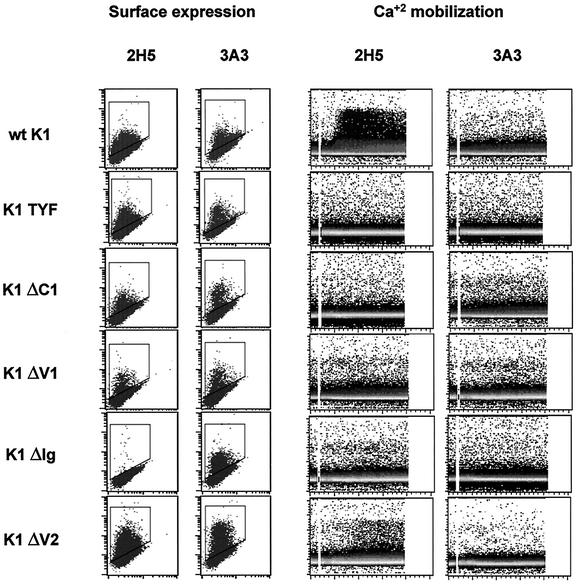
K1 protein efficiently transduces extracellular signals to elicit cellular activation events through its cytoplasmic ITAM. To further investigate the role of the K1 extracellular domain in signal transduction, K1 ΔC1, K1 ΔV1, K1 ΔIg, and K1 ΔV2 deletion mutants were examined for their ability to induce intracellular free calcium mobilization upon cross-linking with 2H5 (a stimulating antibody that reacted with the short sequence in the C2 region overlapping with the Ig region), and with 3A3 (a nonstimulating antibody that reacted with the C2 region). As a control, we included the K1 TYF mutant, which has the tyrosine residues of the cytoplasmic ITAM replaced with phenylalanines (29). BJAB cells were electroporated with pTracer-GFP vector containing wild-type K1 or its mutants. At 24 h postelectroporation, BJAB cells were examined for the surface expression of K1 and its mutants. Flow cytometry with both antibodies showed that wild-type K1 and its mutants were expressed at various but similar levels on the BJAB cells, with the exception of K1 ΔV2, which displayed higher surface expression than the others (Fig. 5). GFP-positive BJAB cells were then gated, stimulated with 2H5 or 3A3 antibody, and monitored by flow cytometry to measure intracellular free calcium mobilization. The K1 TYF mutant completely lacked K1-mediated calcium mobilization upon 2H5 antibody stimulation, whereas wild-type K1 efficiently induced intracellular free calcium mobilization under the same conditions (Fig. 5). The K1 ΔC1 and K1 ΔV1 mutants were also incapable of inducing an increase in intracellular calcium mobilization upon 2H5 antibody stimulation (Fig. 5). Furthermore, despite its higher level of surface expression than wild-type K1, calcium mobilization induced by the K1 ΔV2 mutant was considerably weaker in extent and significantly delayed in rate than that induced by wild-type K1 (Fig. 5). Since wild-type K1 and its mutants (except K1 ΔIg) reacted readily with 2H5 antibody, the inability of K1 mutants to induce intracellular calcium mobilization was not due to their lack of reactivity with 2H5 antibody (Fig. 5). Finally, the stimulation of wild-type K1 and its mutants with 3A3 antibody did not induce intracellular free calcium concentration to any detectable extent (Fig. 5). These results indicate that K1 signal transduction induced by antibody stimulation requires both the ITAM sequence of the cytoplasmic domain and the authentic conformation of the extracellular domain.
FIG. 5.
Effect of mutations in the K1 extracellular domain on K1 signal transduction induced by antibody stimulation. BJAB cells were electroporated with pTracer-GFP containing full-length wild-type (wt) K1 or the K1 TYF, K1 ΔC1, K1 ΔV1, K1 ΔIg, and K1 ΔV2 mutants. To determine surface expression, at 24 h postelectroporation, BJAB cells were stained with the 2H5 and 3A3 antibodies and analyzed by flow cytometry. For Ca2+ mobilization, GFP-positive BJAB cells were stimulated with 10 μg of the 2H5 or 3A3 antibodies, and calcium mobilization was monitored over time by changes in the ratio of violet to blue (405 to 485 nm) fluorescence of cells loaded with indo-1 and analyzed by flow cytometry. Data for calcium mobilization are presented as a histogram of the number of cells with a particular fluorescence ratio (y axis) versus time (x axis). The breaks in the graphs indicate the time intervals during addition of K1 antibodies. The data were similar in two independent experiments.
Lytic expression of KSHV K1 protein.
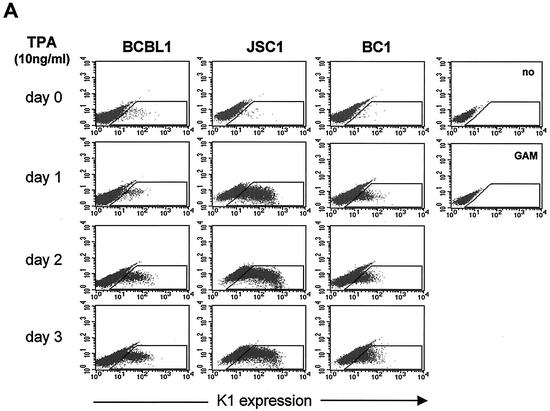
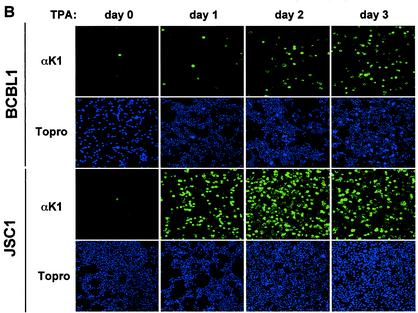
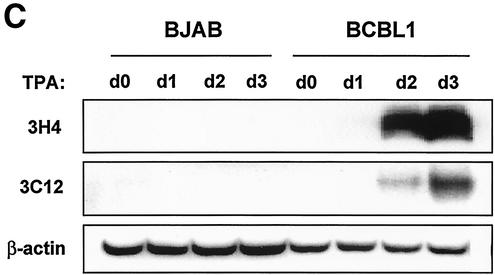
BCBL-1 cells infected with KSHV and JSC-1 and BC-1 cells coinfected with KSHV and EBV were used to examine K1 expression during TPA-induced lytic replication. Cells were stimulated with TPA for 0, 24, 48, and 72 h, followed by flow cytometry with K1 antibody. The 2H1 antibody was selected for this assay because it reacted with all three K1 alleles of BCBL-1, BC-1, and JSC-1 cells. While a small population of unstimulated cells showed K1 surface expression, the level of K1 expression gradually increased on BCBL-1, BC-1, and JSC-1 cells during the time course of TPA stimulation (Fig. 6A). To further test expression of K1, BCBL-1 and JSC-1 cells were used for immunofluorescence assays. After 0, 24, 48, and 72 h of TPA stimulation, BCBL-1 and JSC-1 cells were fixed, permeabilized, and reacted with antibody 2H1. Only a few unstimulated cells were positive for K1 expression, but the level of K1 expression dramatically increased during the time course of TPA stimulation (Fig. 6B). The higher level of K1 expression in JSC-1 cells than that in BCBL-1 and BC-1 cells was likely due to the higher level of TPA-mediated KSHV lytic replication in JSC-1 cells (6). Finally, TPA-stimulated BJAB and BCBL-1 cells were lysed and immunoblotted with K1 antibodies. K1 expression was extremely low in unstimulated cells but dramatically increased during TPA stimulation (Fig. 6C). These results demonstrate that K1 is expressed on a minor population of unstimulated KSHV-infected PEL cells and that its expression was further enhanced during lytic replication of KSHV.
FIG. 6.
Lytic expression of K1. (A) Flow cytometry analysis of K1 surface expression. BCBL-1, BC-1, and JSC-1 cells were stimulated with TPA for 0, 1, 2, and 3 days. Cells were fixed with paraformaldehyde and reacted with anti-K1 antibody 2H1, followed by PE-conjugated anti-mouse IgG. As negative controls, unstimulated BCBL-1 cells were stained without antibody (no) or with only PE-conjugated goat anti-mouse IgG (GAM). The gated population in the box represents the K1-positive cells. (B) Immunofluorescence assay of K1 expression. BCBL-1 and JSC-1 cells were harvested at days 0, 1, 2, and 3 after TPA stimulation. Cells were fixed, permeabilized, and reacted with anti-K1 (αK1) antibody 2H1, followed by PE-conjugated goat anti-mouse IgG. Cells were additionally stained with To-Pro3 (Topro) solution (blue) for 1 min to show the nucleus. Immunofluorescence was examined with a Leica confocal immunofluorescence microscope, and a single representative optical section is presented. (C) Immunoblot analysis of K1 expression. BJAB and BCBL-1 cells were harvested at days 0, 1, 2, and 3 after TPA stimulation. Cell lysates were analyzed by immunoblotting and probed with several mouse anti-K1 antibodies. As an internal control, an antiactin antibody was used.
K1 expression in KSHV-infected PEL cells and MCD tissues.
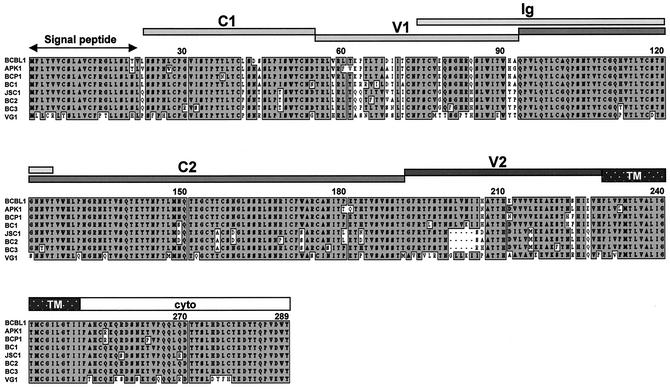
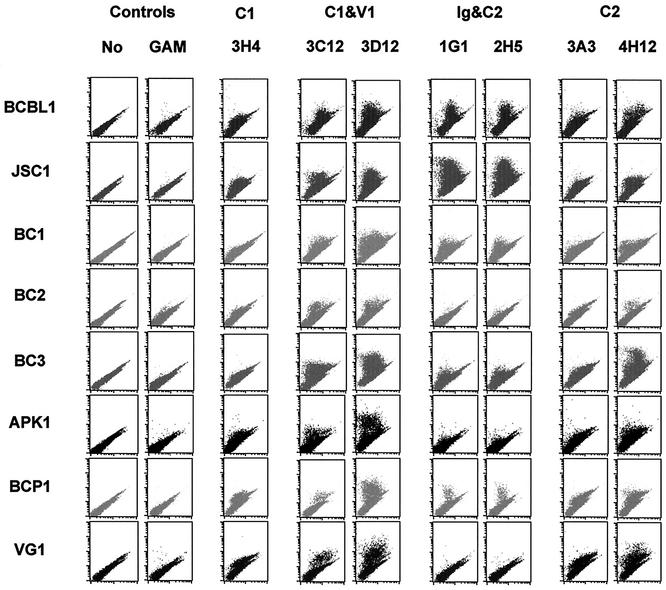
We next tested whether antibodies derived from BCBL1 K1 protein reacted with the K1 alleles of various PEL lines, including BC-1, BC-2, BC-3, BCP-1, APK1, JSC-1, and VG1 cells. First, we cloned and sequenced K1 genes from the APK1, VG1, BCP1, and JSC-1 PEL lines (Fig. 7). The K1 sequences of BCBL-1, BC-1, BC-2, and BC-3 have been published previously (47). Based on the previous report (47) and our analysis, K1 of BCBL-1, BC-1, BCP1, and APK1 cells represented subtype A, and K1 of BC-2, BC-3, and JSC-1 cells represented subtype C (Fig. 7 and Table 2). In addition, K1 of VG1 cells represented subtype B. These cells were stimulated with TPA for 60 h, and K1 surface expression was then assessed by flow cytometry with 13 K1 antibodies. Since K1 antigen was derived from BCBL-1 cells, most K1 antibodies reacted with BCBL-1 cells at a higher level than with other PEL lines (Fig. 8 and Table 2). While several antibodies (1G1, 2H1, 2F3, 2H5, 4E8, and 4B11) readily reacted with K1 alleles on BCP1, BCBL-1, BC-2, BC-3, and JSC-1 cells, they showed little or no reactivity with K1 alleles on APK1 and VG1 cells (Fig. 8 and Table 2). In contrast, the 3D4, 3C12, and 3D12 antibodies broadly reacted with all K1 alleles from eight different PEL lines, but with an overall lower reactivity (Fig. 8 and Table 2). In addition, the 4H12 antibody also showed a broad spectrum of reactivity with all K1 alleles of eight PEL lines (Fig. 8 and Table 2). Thus, the 3D4, 3C12, and 3D12 antibodies, which react with the sequence between the C1 and V1 regions, and the 4H12 antibody, which reacts with the C2 region, have a broad spectrum of reactivity with K1 alleles.
FIG. 7.
Amino acid alignment of K1 alleles of PEL lines. Grey boxes indicate identical amino acid sequences of K1, and white boxes indicate variable amino acid sequences. Deletions are indicated by dashed lines. TM and Cyto indicate transmembrane and cytoplasmic region, respectively.
TABLE 2.
Summary of antibody reactivity with K1 alleles on various PEL cell lines
| Antibody and epitope | Result for PEL line (K1 subtype):
|
|||||||
|---|---|---|---|---|---|---|---|---|
| BCP1 (A) | BC1 (A) | BCBL-1 (A) | BC2 (C) | BC3 (C) | JSC-1 (C) | APK1 (A) | VG1 (B) | |
| C1 | ||||||||
| 1G7 | − | − | + | − | − | − | − | − |
| 2A7 | − | − | + | − | − | + | − | − |
| 2F8 | − | − | + | − | − | − | − | − |
| 3H4 | + | +/− | + | +/− | +/− | + | + | + |
| C1 and V1 | ||||||||
| 3D4 | + | ++ | ++ | + | + | +++ | ++ | ++ |
| 3C12 | ++ | + | ++ | + | ++ | +++ | +++ | ++ |
| 3D12 | +++ | +++ | ++ | + | ++ | +++ | +++++ | ++++ |
| Ig and C2 | ||||||||
| 1G1 | ++ | + | ++++ | − | + | +++++ | − | − |
| 2H1 | ++ | + | ++++ | − | + | +++++ | − | − |
| 2F3 | ++ | + | ++++ | − | + | +++++ | − | − |
| 2H5 | ++ | + | ++++ | − | + | ++++ | − | − |
| 4B11 | ++ | + | +++ | − | + | +++++ | − | − |
| 4E8 | ++ | + | ++++ | + | + | +++++ | − | − |
| C2 | ||||||||
| 3A3 | + | + | + | + | + | + | + | + |
| 4H12 | ++ | ++ | ++ | + | ++++ | ++ | ++ | +++ |
FIG. 8.
Flow cytometry analysis of K1 antibody reactivity with TPA-stimulated PEL lines. After 60 h of TPA stimulation, eight PEL lines (shown to the left) were fixed with paraformaldehyde and reacted with anti-K1 antibodies (goat anti-mouse IgG [GAM], 3H4, 3C12, etc.) specific for the epitopes or epitope combinations shown at the top (C1, V1, etc.), followed by PE-conjugated goat anti-mouse IgG. As negative controls, unstimulated cells were stained without antibody (No) or with only PE-conjugated goat anti-mouse IgG.
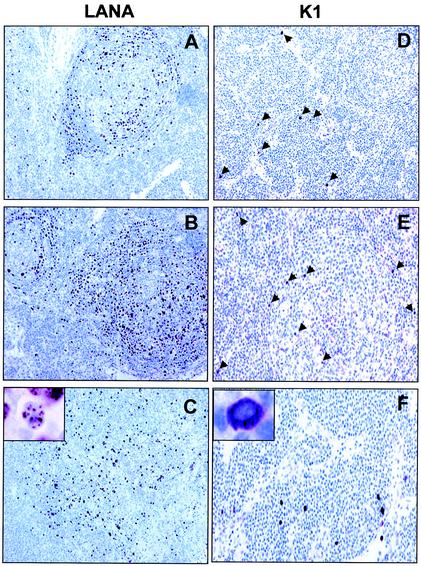
We next stained sections of plasmablastic lymphomas of KSHV-positive MCD with K1 antibody 4H12, 2H5, or 3C12 or a mixture of these monoclonal antibodies. Rabbit polyclonal LANA antibody was included as a control. The lymphoid tissues of these patients were heavily infiltrated with large lymphocytes, possibly immunoblast-like or plasma cells or macrophages, and there were many metastatic and apoptotic cells. Hyalinization of germinal centers also appeared as a characteristic pattern in these tissues (Fig. 9) (data not shown). LANA antigen was generally detected in the germinal center area, especially in the follicular mantle zone, of both MCD patients, but was also detected outside of the germinal center with characteristic nuclear staining (Fig. 9A to C). On the other hand, only a few cells in the germinal center were weakly positive for K1 antigen (Fig. 9D to F). In contrast, numerous K1-positive cells were detected outside of the germinal center, between germinal centers, or at the boundaries of nodular tissues or hyalinization of the germinal center area (Fig. 9D to F). In addition, these cells likely expressed a higher level of K1 antigen than cells in the germinal center. However, regardless of location, K1 antigen was detected with the characteristic cytoplasmic and membrane staining (Fig. 9F). Furthermore, 13 different KS lesions were tested for K1 antigen expression under the same conditions. In contrast to MCD, K1 antigen was not detected in all KS tissues tested, whereas LANA antigen was readily detected in all samples under the same conditions (data not shown). These results indicate that K1 is preferentially expressed in MCD tissues, but not in KS lesions. Thus, as previously described (2, 20, 34, 42, 43), MCD tissues likely have a broader spectrum of KSHV protein expression than KS lesions.
FIG. 9.
LANA and K1 expression of plasmablasts in KSHV-positive MCD tissues. (A to C) LANA expression. LANA was detectable primarily in mantle zone lymphocytes and rarely outside of follicles of KSHV-positive MCD tissues with characteristic nuclear staining. An inset shows the nuclear staining of LANA. (D to F) K1 expression. K1 was detectable in a subpopulation of mantle zone lymphocytes and outside of follicles of KSHV-positive MCD tissues with characteristic cytoplasmic staining. Representative optical sections of a single MCD patient stained with 2H5 antibody are presented. Arrows indicate K1 expression. An inset shows the cytoplasmic staining of K1.
DISCUSSION
Here we report on the generation of mouse monoclonal antibodies directed against the KSHV K1 protein. These antibodies were tested for reactivity with K1 protein by ELISA, immunofluorescence, flow cytometry, immunohistochemistry, and immunoblot analyses. Interestingly, all K1 antibodies were directed to the Ig, C1, and C2 regions, but none reacted directly with the V1 and V2 regions. In addition, the antibody recognition of amino acids 92 to 125 in the C2 region overlapping with the Ig region efficiently induced intracellular free calcium mobilization, whereas antibody recognition of the other regions did not. Furthermore, all conformational epitopes are confined to the Ig region. These results suggest that the conserved regions, particularly the Ig and C2 regions, of the K1 extracellular domain are exposed on the outer surface and play an important role in K1 structure and signal transduction.
Comparison of gp120 sequences from HIV-1 isolates reveals the presence of discrete, highly variable regions interspersed among more conserved regions (17). Antibody mapping and crystal structure analyses indicate that the mature envelope oligomer folds in such a way that the variable regions lie on the exposed outer surface of the complex (17, 22). Thus, the variable regions may serve as an antigenically changeable shield covering the more conserved, functional elements within the core of the complex. Remarkably, the KSHV K1 protein also demonstrates a dramatic sequence variation, almost as much as seen with HIV Env. Particularly, two 40-amino-acid blocks of the V1 and V2 regions show as much as 85% divergence at the nucleotide level and 60% divergence at the amino acid level (47). Interestingly, the V1 region of K1 is flanked by conserved cysteine residues, which may in turn form intrachain disulfide bonds similar to the HIV variable loop (22, 46). In addition, this sequence variation has been shown to be correlated with geographic distribution (16). Analysis with K1 antibodies showed that all 28 antibodies were directed to the Ig, C1, and C2 regions, but not the V1 and V2 regions, of K1. This indicates that unlike in HIV Env, whose variable regions are exposed on the surface, the variable regions of K1 do not appear to be exposed on the surface. Thus, it seems implausible that the high variability of K1 simply represents a mechanism to evade recognition by host antibodies. In fact, unlike the HIV-1 Env, there is no evidence at present that any variability is generated during infection of a single KS patient (47). Thus, the biological role of this unusually high diversity, which reflects some unknown but powerful biological selection process acting preferentially on K1 signaling protein, remains a mystery.
Antibody stimulation of lymphocyte surface receptors has been shown to mimic the receptor-ligand interaction, which ultimately elicits early and late signal transducing events (44). Interestingly, the five K1 antibodies that reacted with amino acids 92 to 125 between the Ig and C2 regions were capable of inducing an increase in intracellular calcium concentration, whereas none of the antibodies that reacted with other regions of the K1 extracellular domain were capable of doing so. This result suggests that the short sequence in the C2 region overlapping with the Ig region of K1 plays a structurally important role in eliciting signal transduction activity. This short sequence displays 60 to 68% amino acid homology to the killer cell inhibitory receptor (KIR) and Igα (CD79a antigen) and 50 to 55% amino acid homology to the extreme N terminus of the mature form of the variable domains of Ig λ light chains. These regions of KIR and Igα have been shown to interact with major histocompatibility complex class I molecules and BCR, respectively (15, 45). In fact, we have previously shown that the K1 extracellular region interacts with BCR μ chain and that this interaction inhibits intracellular transport of BCR complexes to the plasma membrane, resulting in downregulation of BCR surface expression (27). Furthermore, we have found that the glycosylated K1 extracellular protein interacts with several cellular proteins other than the BCR μ chain (unpublished results). Thus, identification of these cellular factors that interact with the K1 extracellular region should be an important step toward a better understanding of the mechanism of K1-mediated signal transduction and could expose a strategy for intervening in KS and PEL development. In addition, the variability of the K1 extracellular domain raises the intriguing possibility that different K1 alleles have different ligands or a different dependence on ligand. Further studies will address these issues.
Despite the extreme sequence variation, the cytoplasmic region of K1 is relatively conserved and resembles a common motif for signal transduction, ITAM. In fact, we and others have demonstrated that K1 elicits signal transduction through this cytoplasmic ITAM, which results in the mobilization of intracellular free calcium and the activation of NF-AT and NF-κB (25, 29, 40). Our study of antibody stimulation indicates that not only the ITAM sequence of the cytoplasmic domain, but also the proper structure of the extracellular domain, is necessary for K1 signal transduction induced by antibody stimulation. Alteration of the K1 extracellular domain, particularly the C1, V1, and Ig regions, completely abolishes its ability to mobilize intracellular free calcium upon antibody stimulation. While the ΔC2 mutant was not assessed for the structural and signaling analyses because of its lack of surface expression, this region would also be important in the conformation and signaling activity of K1. Further detailed structural analysis is necessary to fully understand role of each region of the K1 extracellular domain in sequence variation, potential ligand binding, and signal transduction.
Even though it is a laborious technique, the purification of mammalian cell-derived glycosylated K1 protein has proven to be useful to generate specific antibodies. In addition, K1 antibodies promise to be useful reagents for the functional and structural analysis of the K1 protein. With all observations taken into account, it is conceivable that the conserved regions of the K1 extracellular domain play an important role in its structural conformation and potential ligand binding and, thereby, the initiation of signal transduction. However, the biological role of the variable regions of the K1 extracellular domain remains to be studied.
Acknowledgments
We especially thank D. Ganem, P. Moore, R. Ambinder, D. Scadden, K. M. Kaye, and C. Brendan for providing PEL lines; D. Pauley and L. Hendricks for immunohistochemistry; H. S. Kang for technical advice; and J. Macke for manuscript editing.
This work was partly supported by Public Health Service grants CA82057, CA91819, and RR00168 and ACS grant RPG001102. J. U. Jung is a Leukemia & Lymphoma Society Scholar.
REFERENCES
- 1.Alexander, L., L. Denekamp, A. Knapp, M. R. Auerbach, B. Damania, and R. C. Desrosiers. 2000. The primary sequence of rhesus monkey rhadinovirus isolate 26-95: sequence similarities to Kaposi's sarcoma-associated herpesvirus and rhesus monkey rhadinovirus isolate 17577. J. Virol. 74:3388-3398. [DOI] [PMC free article] [PubMed] [Google Scholar]
- 2.Brousset, P., E. Cesarman, F. Meggetto, L. Lamant, and G. Delsol. 2001. Colocalization of the viral interleukin-6 with latent nuclear antigen-1 of human herpesvirus-8 in endothelial spindle cells of Kaposi's sarcoma and lymphoid cells of multicentric Castleman's disease. Hum. Pathol. 32:95-100. [DOI] [PubMed] [Google Scholar]
- 3.Browning, P. J., J. M. Sechler, M. Kaplan, R. H. Washington, R. Gendelman, R. Yarchoan, B. Ensoli, and R. C. Gallo. 1994. Identification and culture of Kaposi's sarcoma-like spindle cells from the peripheral blood of human immunodeficiency virus-1-infected individuals and normal controls. Blood 84:2711-2720. [PubMed] [Google Scholar]
- 4.Cesarman, E., Y. Chang, P. S. Moore, J. W. Said, and D. M. Knowles. 1995. Kaposi's sarcoma-associated herpesvirus-like DNA sequences in AIDS-related body-cavity-based lymphomas. N. Engl. J. Med. 332:1186-1191. [DOI] [PubMed] [Google Scholar]
- 5.Chang, Y., E. Cesarman, M. S. Pessin, F. Lee, J. Culpepper, D. M. Knowles, and P. S. Moore. 1994. Identification of herpesvirus-like DNA sequences in AIDS-associated Kaposi's sarcoma. Science 266:1865-1869. [DOI] [PubMed] [Google Scholar]
- 6.Ciufo, D. M., J. S. Cannon, L. J. Poole, F. Y. Wu, P. Murray, R. F. Ambinder, and G. S. Hayward. 2001. Spindle cell conversion by Kaposi's sarcoma-associated herpesvirus: formation of colonies and plaques with mixed lytic and latent gene expression in infected primary dermal microvascular endothelial cell cultures. J. Virol. 75:5614-5626. [DOI] [PMC free article] [PubMed] [Google Scholar]
- 7.Cook, R. D., T. A. Hodgson, A. C. W. Waugh, E. M. Molyneux, E. Borgstein, A. Sherry, C. G. Teo, and S. R. Porter. 2002. Mixed patterns of transmission of human herpesvirus-8 (Kaposi's sarcoma-associated herpesvirus) in Malawian families. J. Gen. Virol. 83:1613-1619. [DOI] [PubMed] [Google Scholar]
- 8.Desrosiers, R. C., V. G. Sasseville, S. C. Czajak, X. Zhang, K. G. Mansfield, A. Kaur, R. P. Johnson, A. A. Lackner, and J. U. Jung. 1997. A herpesvirus of rhesus monkeys related to the human Kaposi's sarcoma-associated herpesvirus. J. Virol. 71:9764-9769. [DOI] [PMC free article] [PubMed] [Google Scholar]
- 9.Eliopoulos, A. G., and L. S. Young. 2001. LMP1 structure and signal transduction. Semin. Cancer Biol. 11:435-444. [DOI] [PubMed] [Google Scholar]
- 10.Ensoli, B., C. Sgadari, G. Barillari, M. C. Sirianni, M. Sturzl, and P. Monini. 2001. Biology of Kaposi's sarcoma. Eur. J. Cancer 37:1251-1269. [DOI] [PubMed] [Google Scholar]
- 11.Ensoli, B., and M. Sturzl. 1998. Kaposi's sarcoma: a result of the interplay among inflammatory cytokines, angiogenic factors and viral agents. Cytokine Growth Factor Rev. 9:63-83. [DOI] [PubMed] [Google Scholar]
- 12.Ensoli, B., M. Sturzl, and P. Monini. 2000. Cytokine-mediated growth promotion of Kaposi's sarcoma and primary effusion lymphoma. Semin. Cancer Biol. 10:367-381. [DOI] [PubMed] [Google Scholar]
- 13.Fiorelli, V., R. Gendelman, F. Samaniego, P. D. Markham, and B. Ensoli. 1995. Cytokines from activated T cells induce normal endothelial cells to acquire the phenotypic and functional features of AIDS-Kaposi's sarcoma spindle cells. J. Clin. Investig. 95:1723-1734. [DOI] [PMC free article] [PubMed] [Google Scholar]
- 14.Fiorelli, V., R. Gendelman, M. C. Sirianni, H. K. Chang, S. Colombini, P. D. Markham, P. Monini, J. Sonnabend, A. Pintus, R. C. Gallo, and B. Ensoli. 1998. Gamma-interferon produced by CD8+ T cells infiltrating Kaposi's sarcoma induces spindle cells with angiogenic phenotype and synergy with human immunodeficiency virus-1 Tat protein: an immune response to human herpesvirus-8 infection? Blood 91:956-967. [PubMed] [Google Scholar]
- 15.Gauld, S. B., J. M. Dal Porto, and J. C. Cambier. 2002. B cell antigen receptor signaling: roles in cell development and disease. Science 296:1641-1642. [DOI] [PubMed] [Google Scholar]
- 16.Hayward, G. S. 1999. KSHV strains: the origins and global spread of the virus. Semin. Cancer Biol. 9:187-199. [DOI] [PubMed] [Google Scholar]
- 17.Johnson, W. E., and R. C. Desrosiers. 2002. Viral persistence: HIV's strategies of immune system evasion. Annu. Rev. Med. 53:499-518. [DOI] [PubMed] [Google Scholar]
- 18.Jung, J. U., J. K. Choi, A. Ensser, and B. Biesinger. 1999. Herpesvirus saimiri as a model for gammaherpesvirus oncogenesis. Semin. Cancer Biol. 9:231-239. [DOI] [PubMed] [Google Scholar]
- 19.Kasolo, F. C., M. Monze, N. Obel, R. A. Anderson, C. French, and U. A. Gompels. 1998. Sequence analyses of human herpesvirus-8 strains from both African human immunodeficiency virus-negative and -positive childhood endemic Kaposi's sarcoma show a close relationship with strains identified in febrile children and high variation in the K1 glycoprotein. J. Gen. Virol. 79:3055-3065. [DOI] [PubMed] [Google Scholar]
- 20.Katano, H., Y. Sato, T. Kurata, S. Mori, and T. Sata. 1999. High expression of HHV-8-encoded ORF73 protein in spindle-shaped cells of Kaposi's sarcoma. Am. J. Pathol. 155:47-52. [DOI] [PMC free article] [PubMed] [Google Scholar]
- 21.Kraffert, C., L. Planus, and N. S. Penneys. 1991. Kaposi's sarcoma: further immunohistologic evidence of a vascular endothelial origin. Arch. Dermatol. 127:1734-1735. [PubMed] [Google Scholar]
- 22.Kwong, P. D., R. Wyatt, J. Robinson, R. W. Sweet, J. Sodroski, and W. A. Hendrickson. 1998. Structure of an HIV gp120 envelope glycoprotein in complex with the CD4 receptor and a neutralizing human antibody. Nature 393:630-631. [DOI] [PMC free article] [PubMed] [Google Scholar]
- 23.Lacoste, V., J. G. Judde, J. Briere, M. Tulliez, E. Kassa-Kelembho, J. Morvan, P. Couppie, E. Clyti, J. F. Vila, B. Rio, A. Delmer, P. Mauclere, and A. Gessain. 2000. Molecular epidemiology of human herpesvirus 8 in Africa: both B and A5 K1 genotypes, as well as the M and P genotypes of K14.1/K15 loci, are frequent and widespread. Virology 278:60-74. [DOI] [PubMed] [Google Scholar]
- 24.Lagunoff, M., and D. Ganem. 1997. The structure and coding organization of the genomic termini of Kaposi's sarcoma-associated herpesvirus. Virology 236:147-154. [DOI] [PubMed] [Google Scholar]
- 25.Lagunoff, M., D. M. Lukac, and D. Ganem. 2001. Immunoreceptor tyrosine-based activation motif-dependent signaling by Kaposi's sarcoma-associated herpesvirus K1 protein: effects on lytic viral replication. J. Virol. 75:5891-5898. [DOI] [PMC free article] [PubMed] [Google Scholar]
- 26.Lagunoff, M., R. Majeti, A. Weiss, and D. Ganem. 1999. Deregulated signal transduction by the K1 gene product of Kaposi's sarcoma-associated herpesvirus. Proc. Natl. Acad. Sci. USA 96:5704-5709. [DOI] [PMC free article] [PubMed] [Google Scholar]
- 27.Lee, B. S., X. Alvarez, S. Ishido, A. A. Lackner, and J. U. Jung. 2000. Inhibition of intracellular transport of B cell antigen receptor complexes by Kaposi's sarcoma-associated herpesvirus K1. J. Exp. Med. 192:11-21. [DOI] [PMC free article] [PubMed] [Google Scholar]
- 28.Lee, B.-S., M. Paulose-Murphy, Y.-H. Chung, M. Connlole, S. Zeichner, and J. U. Jung. 2002. Suppression of tetradecanoyl phorbol acetate-induced lytic reactivation of Kaposi's sarcoma-associated herpesvirus by K1 signal transduction. J. Virol. 76:12185-12199. [DOI] [PMC free article] [PubMed] [Google Scholar]
- 29.Lee, H., J. Guo, M. Li, J.-K. Choi, M. DeMaria, M. Rosenzweig, and J. U. Jung. 1998. Identification of an immunoreceptor tyrosine-based activation motif of K1 transforming protein of Kaposi's sarcoma-associated herpesvirus. Mol. Cell. Biol. 18:5219-5228. [DOI] [PMC free article] [PubMed] [Google Scholar]
- 30.Lee, H., R. Veazey, K. Williams, M. Li, J. Guo, F. Neipel, B. Fleckenstein, A. Lackner, R. C. Desrosiers, and J. U. Jung. 1998. Deregulation of cell growth by the K1 gene of Kaposi's sarcoma-associated herpesvirus. Nat. Med. 4:435-440. [DOI] [PubMed] [Google Scholar]
- 31.Mesri, E. A., E. Cesarman, L. Arvanitakis, S. Rafii, M. A. Moore, D. N. Posnett, D. M. Knowles, and A. S. Asch. 1996. Human herpesvirus-8/Kaposi's sarcoma-associated herpesvirus is a new transmissible virus that infects B cells. J. Exp. Med. 183:2385-2390. [DOI] [PMC free article] [PubMed] [Google Scholar]
- 32.Neipel, F., J.-C. Albrecht, and B. Fleckenstein. 1997. Cell-homologous genes in the Kaposi's sarcoma-associated rhadinovirus human herpesvirus 8: determinants of its pathogenicity? J. Virol. 71:4187-4192. [DOI] [PMC free article] [PubMed] [Google Scholar]
- 33.Nicholas, J., J. C. Zong, D. J. Alcendor, D. M. Ciufo, L. J. Poole, R. T. Sarisky, C. J. Chiou, X. Zhang, X. Wan, H. G. Guo, M. S. Reitz, and G. S. Hayward. 1998. Novel organizational features, captured cellular genes, and strain variability within the genome of KSHV/HHV8. J. Natl. Cancer Inst. Monogr. 23:79-88. [DOI] [PubMed] [Google Scholar]
- 34.Parravicini, C., B. Chandran, M. Corbellino, E. Berti, M. Paulli, P. S. Moore, and Y. Chang. 2000. Differential viral protein expression in Kaposi's sarcoma-associated herpesvirus-infected diseases: Kaposi's sarcoma, primary effusion lymphoma, and multicentric Castleman's disease. Am. J. Pathol. 156:743-749. [DOI] [PMC free article] [PubMed] [Google Scholar]
- 35.Regezi, J. A., L. A. MacPhail, T. E. Daniels, Y. G. DeSouza, J. S. Greenspan, and D. Greenspan. 1993. Human immunodeficiency virus-associated oral Kaposi's sarcoma. A heterogeneous cell population dominated by spindle-shaped endothelial cells. Am. J. Pathol. 143:240-249. [PMC free article] [PubMed] [Google Scholar]
- 36.Reitz, M. S., Jr., L. S. Nerurkar, and R. C. Gallo. 1999. Perspective on Kaposi's sarcoma: facts, concepts, and conjectures. J. Natl. Cancer Inst. 91:1453-1458. [DOI] [PubMed] [Google Scholar]
- 37.Renne, R., M. Lagunoff, W. Zhong, and D. Ganem. 1996. The size and conformation of Kaposi's sarcoma-associated herpesvirus (human herpesvirus 8) DNA in infected cells and virions. J. Virol. 70:8151-8154. [DOI] [PMC free article] [PubMed] [Google Scholar]
- 38.Russo, J. J., R. A. Bohenzky, M. C. Chien, J. Chen, M. Yan, D. Maddalena, J. P. Parry, D. Peruzzi, I. S. Edelman, Y. Chang, and P. S. Moore. 1996. Nucleotide sequence of the Kaposi sarcoma-associated herpesvirus (HHV8). Proc. Natl. Acad. Sci. USA 93:14862-14867. [DOI] [PMC free article] [PubMed] [Google Scholar]
- 39.Ruszczak, Z., A. Mayer-Da Silva, and C. E. Orfanos. 1987. Kaposi's sarcoma in AIDS. Multicentric angioneoplasia in early skin lesions. Am. J. Dermatopathol. 9:388-398. [PubMed] [Google Scholar]
- 40.Samaniego, F., S. Pati, J. Karp, O. Prakash, and D. Bose. 2001. Human herpesvirus 8 K1-associated nuclear factor-kappa b-dependent promoter activity: role in Kaposi's sarcoma inflammation? J. Natl. Cancer Inst. Monogr. 28:15-23. [DOI] [PubMed] [Google Scholar]
- 41.Searles, R. P., E. P. Bergquam, M. K. Axthelm, and S. W. Wong. 1999. Sequence and genomic analysis of a rhesus macaque rhadinovirus with similarity to Kaposi's sarcoma-associated herpesvirus/human herpesvirus 8. J. Virol. 73:3040-3053. [DOI] [PMC free article] [PubMed] [Google Scholar]
- 42.Staskus, K. A., R. Sun, G. Miller, P. Racz, A. Jaslowski, C. Metroka, H. Brett-Smith, and A. T. Haase. 1999. Cellular tropism and viral interleukin-6 expression distinguish human herpesvirus 8 involvement in Kaposi's sarcoma, primary effusion lymphoma, and multicentric Castleman's disease. J. Virol. 73:4181-4187. [DOI] [PMC free article] [PubMed] [Google Scholar]
- 43.Staskus, K. A., W. Zhong, K. Gebhard, B. Herndier, H. Wang, R. Renne, J. Beneke, J. Pudney, D. J. Anderson, D. Ganem, and A. T. Haase. 1997. Kaposi's sarcoma-associated herpesvirus gene expression in endothelial (spindle) tumor cells. J. Virol. 71:715-719. [DOI] [PMC free article] [PubMed] [Google Scholar]
- 44.van Oers, N. S., and A. Weiss. 1995. The Syk/Zap-70 protein tyrosine kinase connection to antigen receptor signaling processes. Semin. Immunol. 7:227-236. [DOI] [PubMed] [Google Scholar]
- 45.Vilches, C., and P. Parham. 2002. KIR: diverse, rapidly evolving receptors of innate and adaptive immunity. Annu. Rev. Immunol. 20:217-251. [DOI] [PubMed] [Google Scholar]
- 46.Wyatt, R., and J. Sodroski. 1998. The HIV envelope glycoproteins: fusogens, antigens, and immunogens. Science 280:1884-1888. [DOI] [PubMed] [Google Scholar]
- 47.Zong, J. C., D. M. Ciufo, D. J. Alcendor, X. Wan, J. Nicholas, P. J. Browning, P. L. Rady, S. K. Tyring, J. M. Orenstein, C. S. Rabkin, I.-J. Su, K. F. Powell, M. Croxson, K. E. Foreman, B. J. Nickoloff, S. Alkan, and G. S. Hayward. 1999. High-level variability in the ORF-K1 membrane protein gene at the left end of the Kaposi's sarcoma-associated herpesvirus genome defines four major virus subtypes and multiple variants or clades in different human populations. J. Virol. 73:4156-4170. [DOI] [PMC free article] [PubMed] [Google Scholar]


