

Abstract
The Gene Expression Omnibus (GEO) repository at the National Center for Biotechnology Information (NCBI) archives and freely distributes high-throughput molecular abundance data, predominantly gene expression data generated by DNA microarray technology. The database has a flexible design that can handle diverse styles of both unprocessed and processed data in a MIAME- (Minimum Information About a Microarray Experiment) supportive infrastructure that promotes fully annotated submissions. GEO currently stores about a billion individual gene expression measurements, derived from over 100 organisms, submitted by over 1,500 laboratories, addressing a wide range of biological phenomena. To maximize the utility of these data, several user-friendly Web-based interfaces and applications have been implemented that enable effective exploration, query, and visualization of these data, at the level of individual genes or entire studies. This chapter describes how the data are stored, submission procedures, and mechanisms for data retrieval and query. GEO is publicly accessible at http://www.ncbi.nlm.nih.gov/projects/geo/.
THE PURPOSE AND SCOPE OF GEO
The post-genomic era has led to a multitude of high-throughput methodologies that generate massive volumes of gene expression data. The GEO repository was established by NCBI in 2000 to house and distribute these data to the public with no restrictions or login requirements (for more information, please read the GEO Data Disclaimer1). The primary role of GEO is data archiving, functioning as a hub for data deposit and retrieval (Edgar et al., 2002; Barrett et al, 2005).
GEO is currently the largest, fully public gene expression resource. At the time of writing, the database holds over 50,000 samples, comprising approximately a billion individual expression measurements, 13 million gene expression profiles, for over 100 organisms, submitted by almost 1,500 laboratories. These data address a very broad diversity of biological themes including disease, development, evolution, metabolics, toxicology, immunity, ecology, transgenesis, and so on. Most data are provided by the research community in compliance with grant or journal provisos that require microarray data to be made available in a public repository, the objective being to facilitate independent evaluation of results, reanalysis, and full access to all parts of the study (Ball et al., 2004).
Data types currently stored include, but are not limited to, cDNA and oligonucleotide microarrays that examine gene expression, serial analysis of gene expression (SAGE), massively parallel signature sequencing (MPSS), array comparative genomic hybridization, chromatin-immunoprecipitation on arrays (ChIP-chip) studies, and peptide profiling techniques such as tandem mass spectrometry (MS/MS). In keeping with the theme of the book, this chapter will focus on gene expression data generated by DNA microarrays.
Although primarily a data storage and retrieval facility, it was clear early on that the resource must also enable effective searching and data mining as means to identify entries of interest. Consequently, several user-friendly Web-based query tools have been developed to assist even those unfamiliar with microarray technology to effectively explore and analyze GEO data. However, it is important to realize that GEO is not intended to be used as a Laboratory Information Management System (LIMS), or a pre-/first-analysis environment, since data submitted to GEO are generally processed data that form the basis for discussion in accompanying manuscripts.
This chapter explains the database design for storage of microarray information, how to submit data, and how to effectively retrieve and examine information in the GEO database.
STRUCTURE
The GEO database architecture is designed for the efficient capture, storage, and retrieval of heterogeneous sets of high-throughput molecular abundance data. The structure is sufficiently flexible to accommodate evolving state of the art technologies. There are many different varieties of microarray technology and researchers use a wide assortment of hardware and software packages to generate and process the data. Consequently, the data have many different styles and comprise varying content. For example, the sequences on an array may be described by multiple attributes including gene symbols, GenBank accession numbers, clone identifiers, ontology categories, feature coordinates, to name a few. Similarly, hybridization data may contain many types of supporting measurements and calculations that supplement final expression values. Importantly, expression data are worthless unless complemented with comprehensive contextual biological details and data analysis methodologies under which they were generated. GEO was built with all these considerations in mind and has an open, adaptable design that can handle variety and a MIAME-supportive (Brazma et al., 2001) infrastructure that promotes fully annotated submissions. Extensive technical details regarding database design and data flow are beyond the scope of this chapter, but it helps to understand that data and metadata are stored separately within the database. GEO’s versatility is largely attributed to the fact that tabular data are not fully granulated in the core database but instead are treated as “blobs”, that is, compressed text tab-delimited tables that may contain any number of rows or columns. Data in selected columns are extracted to a secondary database and used in subsequent indexing and query applications. Descriptive or informative metadata are fully normalized in the schema as needed.
Submitter-supplied data
Data supplied by submitters are stored as three main entities in a MSSQL Server relational database:
Platform
Includes a summary description of the array and a data table defining the array template. Each row in the table corresponds to a single element, and includes sequence annotation and tracking information as provided by the submitter.
Sample
Includes a description of the biological source and the experimental protocols to which it was subjected, and a data table containing hybridization measurements for each element on the corresponding Platform.
Series
Defines a set of related Samples considered to be part of a study, and describes the overall study aim and design.
Each of these objects is assigned an accession number that may be used to cite and retrieve the records. In addition to the Sample data tables and descriptive information, accompanying supplementary files such as original microarray scan images, or pre-processed quantification data are accepted and stored on an FTP site with database links.
GEO-constructed DataSets
Despite the variability in the style and content of incoming data, a common set of salient information is submitted:
sequence identity tracking information for each feature on the array
normalized hybridization measurements
a description of the biological source used in each hybridization
Using a combination of automated data extraction and manual curation, this information is rendered into an upper-level unit called a GEO DataSet (Figure 1). A DataSet represents a collection of similarly-processed, experimentally-related Sample hybridizations and provides a coherent synopsis for a study. Samples within a DataSet are further categorized according to experimental variables, for example they are organized by gender, disease state, etc.
Figure 1.
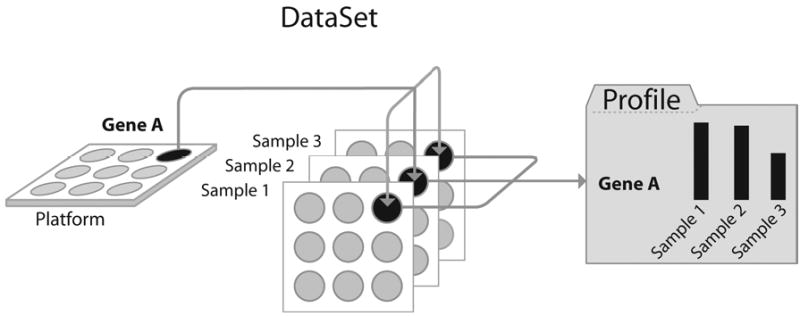
Schematic diagram of the relations between GEO Platform, Sample, DataSet, and Profiles. For each gene on a Platform, multiple Sample measurement values are generated. Related Samples constitute a DataSet, from which multiple gene expression profile entities are generated.
A DataSet provides two separate perspectives of the data:
An experiment-centered rendering that encapsulates the whole study. This information is presented as a “DataSet record”. DataSet records comprise a synopsis of the experiment, a breakdown of the experimental variables, access to auxiliary objects, several data display and analysis tools, and download options (Figure 2).
A gene-centered rendering that presents quantitative gene expression measurements for one gene across a DataSet. This information is presented as a “GEO Profile”. A GEO Profile comprises gene identity annotation, the DataSet title, links to auxiliary information, and a chart depicting the expression level of that gene across each Sample in the DataSet (Figure 3). The following section describes more information on interpreting GEO Profile charts.
Figure 2.
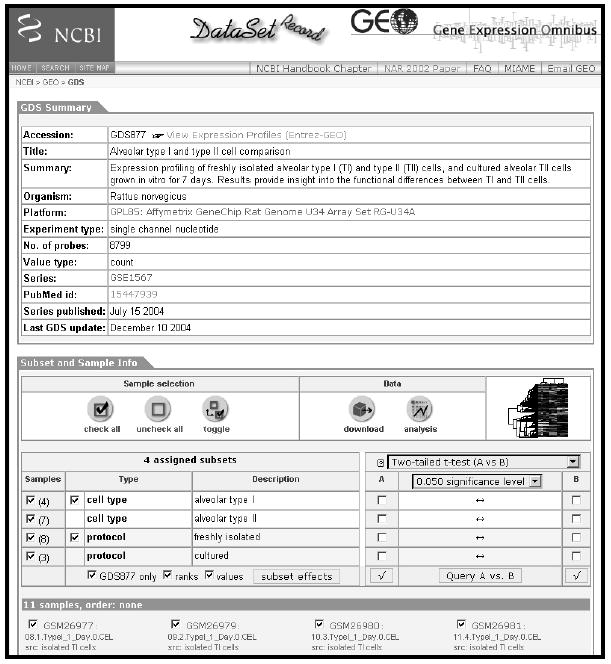
Screenshot of a typical DataSet record GDS877 (Gonzalez et al., 2005). The record includes a summary of the experiment, links to related records and publications, subset designations and classifications, download options, and access to mining features such as cluster heat maps and ‘Query group A vs B’ tool.
Figure 3.
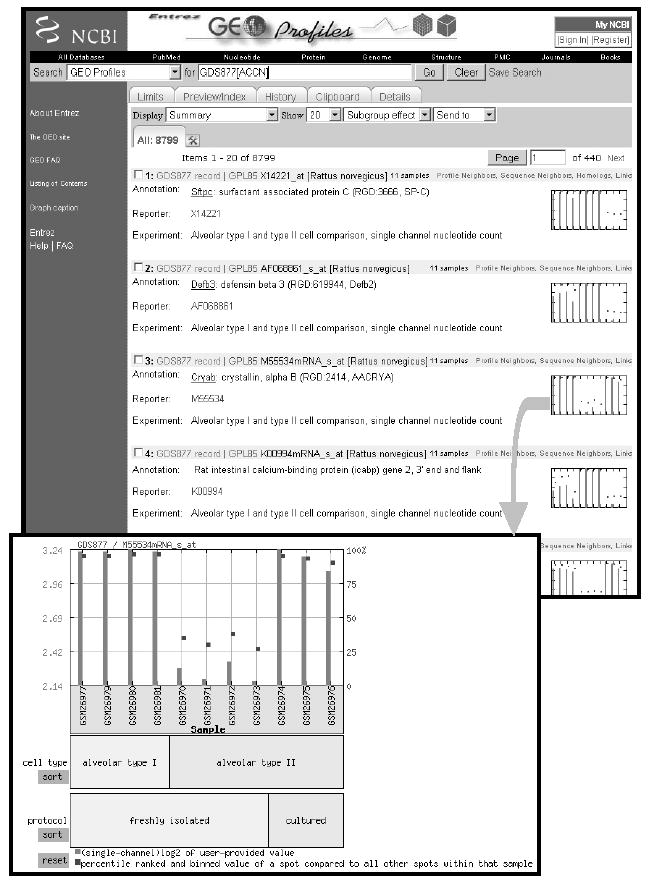
Screenshot of Entrez GEO Profiles retrieval results; each entity includes sequence identifier and DataSet information, and a thumbnail profile image. Links to other Entrez databases or related profiles are provided above the thumbnail image. The expanded profile chart depicts values (bars) and rank (squares) information for the crystallin gene across each Sample in GEO DataSet GDS877 (Gonzalez et al., 2005). Experimental subset groupings are reflected in labels at foot of chart.
DataSets enable transformation of diverse styles of submitted data such that they are readily accessible in a uniform format upon which to base downstream data analysis tools.
INTERPRETING GEO PROFILES CHARTS
GEO Profile charts track the expression behavior of one gene across all Samples in a DataSet. Several categories of information are presented in GEO Profile charts – expression measurement values, expression measurement rankings, and an outline of the experimental design and variables (Figure 3).
The value data (red bars, scale at the left side of the chart) are extracted from the ‘VALUE’ column of corresponding Sample records from which the DataSet is composed. All Sample data tables include this column which contains the final normalized expression level measurements as supplied by the submitter. Other than to log transform single-channel expression counts for graphic visualization, no additional processing is applied by GEO to value data.
An important point to consider is that there is no standard unit for gene expression; a very wide variety of technologies, software packages and algorithms generate these data, so the values should be considered arbitrary units. Consequently, it is inadvisable to attempt to draw direct comparisons between expression values in unrelated DataSets. However, it can be assumed that the value measurements of each Sample within a DataSet are comparable and have been calculated in an equivalent manner, i.e., considerations such as background processing and normalization/scaling are consistent across the DataSet. The ‘Value distribution’ box and whisker plots available on DataSet records allow users to easily evaluate how well distributed, and thus comparable, the Sample values within a DataSet are.
In addition to the value profile display for individual genes, most DataSets also provide a rank percentile view (blue squares, scale on the right side of the chart). Ranks provide an indication of the expression level of that gene compared to all other genes on that array. Ranks are calculated as follows: (i) the total number of genes in the Sample is divided to 100 bins such that there are n genes per bin; (ii) genes are sorted by value, (iii) the lowest n genes are assigned to the first bin, subsequent n genes to the next bin, and so on. Binning is rather sensitive to local (Sample) distribution and global (DataSet) normalization. It is therefore useful to note if a gene displays the same pattern of behavior in both value and rank space - a disparity in trends can indicate that the data are not normalized or the existence of other effects such as non-specific hybridization.
Currently, faded data points are specific to Affymetrix technology (this mode of display will likely be applied to other technology types in the future). They indicate where the Affymetrix algorithms have assigned a ‘Detection call = absent’ to an expression signal. An absent call can be assigned for two reasons - either the detected signal was so low that the transcript was deemed not to be present, or stray cross-hybridization was detected in which case the signal is deemed unreliable for that transcript.
The bars at the horizontal foot of the chart provide experiment annotation and contextual information about the gene expression profile under review. The ‘sort’ button allows users to resort the Samples in the DataSet according to a particular experimental parameter, thus assisting visualization of expression trends in experiments with complex design.
SUBMISSION
The GEO database is a MIAME-supportive infrastructure; the MIAME guidelines outline the minimal information that should be provided to allow unambiguous interpretation of microarray experiment data (Brazma et al., 2001). While the submission procedures promote MIAME-compliance, ultimately it is the submitters’ responsibility to ensure that their data are sufficiently well annotated. Large volumes of contextual information may be provided, including the cell or tissue type, characteristics of the organism (e.g., species, age, sex, disease state, etc) from which the Sample was isolated, comprehensive explanations of the perturbations that the cells or organisms were subjected to, Sample isolation and preparation protocols, data processing and normalization strategies, and more.
There are several ways in which data may be deposited with GEO. Deciding which method to use depends on the amount of data to be submitted, what format the data are in already, and the level of computational expertise of the submitter. Regardless of the submission method the final GEO records look the same and contain equivalent information.
Web deposit
The Web submission process is designed for the quick and easy deposit of individual records by occasional submitters. This route comprises a set of interactive Web forms that provide a simple step-by-step procedure for deposit of data tables and accompanying descriptive information.
Batch direct deposit using SOFT format
SOFT (Simple Omnibus Format in Text) is a simple line-based format designed for rapid batch submission (and retrieval) of data. A single SOFT file can hold both data tables and accompanying descriptive information for multiple Platforms, Samples, and/or Series records. SOFT files may be readily produced from common database and spreadsheet applications, and can be uploaded directly to the database.
FTP deposit
If data are already in matrix format (e.g., Affymetrix pivot file), submission via a SOFT-formatted spreadsheet is recommended. Valid MAGE-ML-formatted (Spellman et al., 2002) reports are also acceptable. These file types are transferred to GEO via FTP.
Full instructions and examples of these various submission routes and formats are provided on the GEO Web site. All submissions are reviewed and checked by a GEO curator, assuring that records contain meaningful information and are organized correctly. If no structural or content problems are identified the submissions are approved and assigned GEO accession numbers. If problems are identified, the curator will work with the submitter to make any modifications necessary to achieve successful deposit. The GEO accession numbers are unique and stable and may be quoted in corresponding manuscripts. The records may remain private for several months, typically pending manuscript publication. Submitters may generate a secondary account that enables collaborators or reviewers read-only, confidential access to prepublication data. Submitters retain full editorial control over their records and may perform updates and edits at any time.
NAVIGATING GEO AND FINDING WHAT YOU NEED
Browsing
Original submitter-supplied Platform, Sample and Series records may be browsed using the Repository Browser at http://www.ncbi.nlm.nih.gov/geo/query/browse.cgi. These browser pages allow data to be sorted by various categories such as submitter, organism, Platform and Sample type, titles, release dates, and supplementary file type. DataSet records may be browsed at http://www.ncbi.nlm.nih.gov/projects/geo/gds/gds_browse.cgi and may be sorted by title, organism, type, creation date, and Platform. Within records, reciprocal links are provided to all related records for easy, uninterrupted browsing.
Downloading
Several download options are available:
Each Platform, Sample and Series record has a mechanism at the head of the page that enables download (SOFT format) or viewing (HTML) of that record and/or related records, with the option to restrict to only descriptive data or tabular data.
DataSet records include a link for download of a text tab-delimited value matrix and associated Platform element gene annotation.
All Platform, Sample, Series, DataSet, and supplementary data are available for bulk download via FTP at ftp://ftp.ncbi.nih.gov/pub/geo/.
Query and analysis
GEO provides a variety of strategies for locating and visualizing information of interest. Query approaches include standard and Boolean text-based searches, sequence-based searches, mining based on expression behavior characteristics, or combinations of these parameters. Figure 4 depicts a schematic overview of the query workflow, and how the various features and tools are interlinked. A summary of where these features are located, their purpose, and methodology, is provided below.
Figure 4.
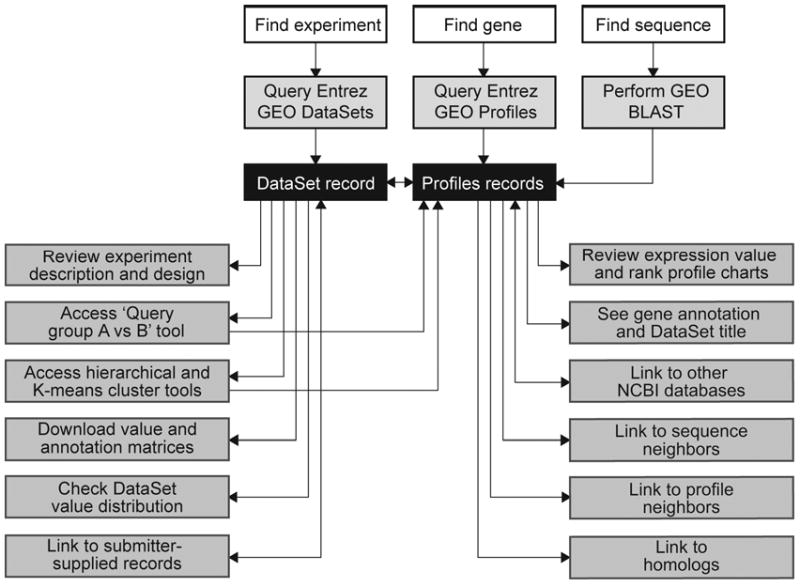
Schematic overview of the query workflow, and how the various features and tools are interlinked.
Deciding where to begin a search generally depends on what type of information one needs to retrieve. Often, there is more than one way to identify relevant data. Users should always keep in mind that the features provided on the GEO site are not intended for robust systematic analyses. The heterogeneous nature of GEO data coupled with the limitations of Web browsing limits to some extent the statistical tools that can be developed. Diverse data are treated similarly; criteria like sample size, number of repeats, prior filtering, and normalization factors are not considered. That said, these tools are extremely useful for the quick and easy identification of relevant and noteworthy data.
Entrez GEO DataSets
Where
From the GEO home page or at http://www.ncbi.nlm.nih.gov/entrez/query.fcgi?db=gds
Purpose
A query interface that facilitates identification of DataSets relevant to a particular area of study.
Method
Effective query and mining is achieved using keywords or Boolean phrases restricted to supported attribute fields (Table I). Retrievals display the DataSet titles, a brief experiment description, a link to the complete DataSet record (Figure 2), as well as links to publications and other databases.
Table I.
Entrez qualifier fields
| Field name | Field description |
|---|---|
| GEO DataSets | |
| Author | Authors associated with the experiment |
| Experiment Type | The experiment type, e.g., cDNA, genomic, protein, SAGE |
| GDS Text | DataSet description text |
| GEO Accession | The GEO accession number |
| GEO Description/Title Text | Text provided in the description/title of original records |
| Number Of Samples | The number of Samples in the DataSet* |
| Number of Platform Probes | The number of Platform reporters in the DataSet* |
| Organism | The organism from which the reporters on the array were derived/designed |
| Reporter Identifier | The identifier for the array reporter (GenBank accession, gene name, etc). |
| Sample Source | The source biological material of the Sample |
| Sample Title | Sample title |
| Submitter Institute | Submitter institute |
| Subset Description | The description of the experimental variable |
| Subset Variable Type | The type of experimental variable, e.g., age, strain, gender |
| GEO Profiles | |
| Experiment Type | The experiment type, e.g., cDNA, genomic, protein, SAGE |
| Flag Information | Specific experimental variable flags, e.g., age, strain, gender |
| Flag Type | Flag types, e.g., rank and value subset effects |
| GDS Text | DataSet description text |
| GEO Accession | The GEO accession number |
| GEO Description/Title Text | Text provided in the description/title of original records |
| GI | Mapped GenBank identifier |
| Gene Description | Gene description, symbol, alias |
| ID_REF | The unique identifier for a reporter as given on the array |
| Max Value Rank | The maximum value rank* |
| Max value in profile | The maximum value in profile* |
| Median value in GDS | The median value in DataSet* |
| Median value in profile | The median value in profile* |
| Min Value Rank | The minimum value rank* |
| Min value in profile | The minimum value in profile* |
| Number Of Samples | The number of Samples in the DataSet* |
| Organism | The organism from which the Samples were derived |
| Ranked Standard Deviation | The ranked standard deviation |
| Reporter Identifier | The identifier for a reporter |
| Sample Source | The source biological material of the Sample |
Useful qualifier fields for performing restricted GEO DataSets and GEO Profiles queries.
indicates possible range operation e.g., 20:50[Number Of Samples] will find DataSets containing 20 to 50 Samples
Entrez GEO Profiles
Where
From the GEO home page or at http://www.ncbi.nlm.nih.gov/entrez/query.fcgi?db=geo
Purpose
A query interface that facilitates identification of gene expression profiles of interest.
Method
Effective query and mining is achieved using keywords or Boolean phrases restricted to supported attribute fields (Table I). Retrievals display the mapped gene name, the DataSet title, a thumbnail image of the gene expression profile, as well as links to publications and other databases. Clicking on the thumbnail image will enlarge the chart to display the full profile details and Sample subset partitions that reflect experimental design (Figure 3)
Advanced Entrez features
Where
The tool bar at the head of all NCBI Entrez query and retrieval pages.
Purpose
Facilitates powerful mining and linking across many NBCI databases (Wheeler et al., 2005; Schuler et al., 1996).
Method
The ‘Preview/Limits’ link assists greatly in construction of complex queries. Users employ indices to browse and/or select the terms by which the data are described, and build multipart queries. The ‘History’ tab stores previous queries which can be combined to form a new search query, enabling sophisticated mining that traverses DataSets and Platforms. The ‘Display’ pull-down menu enables users to find related data in other Entrez resources in batch mode.
DataSet Clusters
Where
On the DataSet record under the ‘analysis’ button.
Purpose
Clustering is a popular method to visualize and examine high-dimensional DataSets. Typically, the goal of a microarray cluster analysis is to organize genes so that those with similar expression patterns are grouped together. It can be hypothesized that genes that behave similarly might have a coordinated transcriptional response, possibly inferring a common function or regulatory elements.
Method
Many different clustering algorithms exist; all employ various combinations of mathematical distance metrics and linkages (Eisen et al., 1998). Nine varieties of pre-computed hierarchical clusters are available on GEO DataSet records, as well as user-defined K-means or K-median clustering. Results are depicted as a color-coded ‘heat map’ image, where rows represent individual elements on the array (genes) and columns represent individual Samples (hybridizations), and color A (high expression level) transitions into color B (low expression level). Users can visually scan these images for cluster ‘hot spots’ that represent a group of genes with similar expression. The heat maps are interactive; after selecting a region, or regions, of interest using a moveable box, the corresponding data may be downloaded as a text file, or linked to the genes in Entrez GEO Profiles. Care must be taken not to over-interpret cluster output. Different clustering algorithms may yield different clustering solutions using the same data. Clustering provides suggestions for possible relationships between data, but does not prove them.
Profile neighbors
Where
The ‘Profile Neighbors’ link on the top right side of Entrez GEO Profiles retrievals.
Purpose
Connects groups of genes that show a similar or reversed profile shape within a DataSet. It can be hypothesized that genes that behave similarly might be co-regulated or have related functionality.
Method
Profile neighbors are pre-calculated using an adjusted Pearson linear correlation. The user need only click the ‘Profile Neighbors’ link to retrieve related genes. Profile neighbors are subject to an arbitrary cutoff limit.
Sequence neighbors
Where
The ‘Sequence Neighbors’ link on the top right side of Entrez GEO Profiles retrievals.
Purpose
Connects groups of genes related by nucleotide sequence similarity across all DataSets. Genes related by sequence similarity can provide insights into the possible function of the original sequence if it has not yet been characterized, or can identify related gene family members.
Method
Sequence neighbors are pre-calculated using standard BLAST (Altschul et al., 1990). The user need only click the ‘Sequence Neighbors’ link to retrieve related genes. Sequence neighbors are subject to an arbitrary cutoff limit.
Links
Where
The ‘Links’ link on the top right side of Entrez GEO Profiles and Entrez GEO DataSets retrievals.
Purpose
Connects GEO data to related data in other NCBI resources, facilitating seamless navigation and cross-referencing between multiple data domains.
Method
Where possible, reciprocal links are provided to and from GenBank, PubMed, Gene, UniGene, OMIM, Homologene, Taxonomy, SAGEMap and MapViewer databases. The user need only click the ‘Links’ link and select the relevant resource from the pull-down menu to link to retrieve related data.
GEO BLAST
Where
The GEO BLAST link on the GEO home page.
Purpose
Retrieves gene profiles that are related to a user-defined nucleotide sequence of interest.
Method
This tool performs a BLAST (Altschul et al., 1990) search of a user-provided nucleotide sequence against all GenBank identifiers represented on microarray Platforms or SAGE libraries in GEO. The retrievals resemble conventional BLAST output with each alignment receiving a score and expect value, and a link to corresponding GEO Profiles. This interface is helpful in locating expression data for specified nucleotide sequences, for identifying sequence homologs, e.g., related gene family members or for cross-species comparisons, or for providing insight into potential roles of the original sequence if it has not yet been functionally characterized.
Sorting and limit options using subset effects flags
Where
Intrinsic to standard Entrez GEO Profiles retrievals which are default-ordered according to subset effect flags, and specifiable using [Flag Type] and [Flag information] qualifiers (Table I) in Entrez GEO Profiles.
Purpose
Attempts to identify genes that display marked differences in expression level according to experimental variables.
Method
Genes whose values or ranks pass a threshold of statistical difference between any non-single experimental variable subset and another are flagged in the database. This allows users to search across all GEO for genes that show an interesting effect with respect to particular experimental variable types, such as ‘age’. The fact that standard Entrez GEO Profiles retrievals are default-ordered according to these flags makes potentially interesting results more visible (alternative sorting options include profile deviation and mean value). It is important to realize that subset effects are calculated with arbitrarily-defined thresholds with no consideration of data type and processing, and merely provide suggestions of what could be interesting profiles.
Query group A vs. B tool
Where
On the DataSet record on the right side of the subset assignment section.
Purpose
Assists filtering and identification of gene profiles that display marked differences in expression level between two specified sets of Samples within a DataSet.
Method
Using checkboxes, the user assigns one or more Samples to group A, and other Samples to group B. Samples are selected/deselected on the basis of their experimental subset designations. The user then chooses from several varieties of filtering procedures and stringency parameters by which to compare the two groups, including one-tailed or two-tailed t-tests, or a mean log values or ranks fold difference. Genes that meet the user-defined criteria are presented in Entrez GEO Profiles. Note that this tool uses rudimentary means of filtering data - retrievals may have no statistical significance; the compared subsets may be too small to provide any statistic value.
CONCLUSION
DNA microarray technology has led to rapid accumulation of gene expression data generated in the last several years. GEO serves as a unifying resource for these data, operating primarily as a public archive, but also providing flexible data mining strategies and tools that allow users to query, filter, select, and inspect data in the context of their specific interests. Many of these features use traditional data reduction techniques designed to filter inherently noisy data, and concise displays that allow human scanning. The integration of GEO data with extensive sequence, mapping, and bibliographic resources via the Entrez system of linked databases offers additional ancillary information that can assist in the interpretation of biological data and evaluate the relevance of microarray results.
Examination of published gene expression data can help researchers prioritize candidates for further study and direct the design of new experiments. The literature reveals that researchers are using GEO data to complement and support their own studies (e.g., Rico-Bautista et al., 2005; Yant et al., 2005; Nakai et al., 2005; Ozyildirim et al., 2005; Brockington et al., 2005).
Compiling large volumes of diverse gene expression data into one location, and making them accessible through common integrated interfaces imparts a powerful investigative factor not attainable when considering solitary experiments. This large compendium of data affords more opportunity to gather corroboratory evidence for global metabolic and regulatory networks, to investigate what the majority of evidence implies about the behavior and function of a gene or group of genes, and to generate hypotheses on functional models and themes (e.g., Zhou et al., 2005; Ott et al., 2005; Jordan et al., 2004). This macro-approach to discovery will only strengthen as the database continues to grow.
The GEO database and tools continue to undergo intensive development and modification, so the features and data presentation strategies discussed in this chapter will evolve over time. To receive announcements of site developments, subscribe to the GEO-announce list at geo@ncbi.nlm.nih.gov.
Acknowledgments
The authors unreservedly acknowledge the efforts the GEO curation and programming staff, including Tugba Suzek, Dennis Troup, Steve Wilhite, Pierre Ledoux, Dmitry Rudnev, Carlos Evangelista, and Alexandra Soboleva. Also Todd Groesbeck is thanked for assistance with manuscript figures.
Footnotes
edgar@ncbi.nlm.nih.gov, NIH/NLM/NCBI, 45 Center Drive, MSC 6510, Building 45, Room AS25A, Bethesda, MD, 20892-6510, Ph: (301) 435-3449, Fax: (301) 480-0109
barrett@ncbi.nlm.nih.gov, NIH/NLM/NCBI, 45 Center Drive, MSC 6510, Building 45, Room AS21, Bethesda, MD, 20892-6510, Ph: (301) 402-4057, Fax: (301) 480-0109
This chapter is an official contribution of the National Institutes of Health; not subject to copyright in the United States.
References
- Altschul SF, et al. Basic local alignment search tool. J Mol Biol. 1990;215:403–410. doi: 10.1016/S0022-2836(05)80360-2. [DOI] [PubMed] [Google Scholar]
- Ball C, et al. Microarray Data Standards: An Open Letter. PLoS Biol. 2004;2:23–24. [Google Scholar]
- Barrett T, et al. NCBI GEO: mining millions of expression profiles - database and tools. Nucleic Acids Res. 2005;33:D562–D566. doi: 10.1093/nar/gki022. [DOI] [PMC free article] [PubMed] [Google Scholar]
- Brazma A, et al. Minimum information about a microarray experiment (MIAME)-toward standards for microarray data. Nat Genet. 2001;29:365–371. doi: 10.1038/ng1201-365. [DOI] [PubMed] [Google Scholar]
- Brockington M, et al. Localization and functional analysis of the LARGE family of glycosyltransferases: significance for muscular dystrophy. Hum Mol Genet. 2005;14(5):657–665. doi: 10.1093/hmg/ddi062. [DOI] [PubMed] [Google Scholar]
- Edgar R, Domrachev M, Lash AE. Gene Expression Omnibus: NCBI gene expression and hybridization array data repository. Nucleic Acids Res. 2002;30:207–210. doi: 10.1093/nar/30.1.207. [DOI] [PMC free article] [PubMed] [Google Scholar]
- Eisen MB, et al. Cluster analysis and display of genome-wide expression patterns. Proc Natl Acad Sci USA. 1998;95:14863–14868. doi: 10.1073/pnas.95.25.14863. [DOI] [PMC free article] [PubMed] [Google Scholar]
- Gonzalez R, et al. Freshly isolated rat alveolar type I cells, type II cells, and cultured type II cells have distinct molecular phenotypes. Am J Physiol Lung Cell Mol Physiol. 2005;288(1):L179–189. doi: 10.1152/ajplung.00272.2004. [DOI] [PubMed] [Google Scholar]
- Jordan IK, et al. Conservation and coevolution in the scale-free human gene coexpression network. Mol Biol Evol. 2004;21(11):2058–2070. doi: 10.1093/molbev/msh222. [DOI] [PubMed] [Google Scholar]
- Nakai H, et al. Large-scale molecular characterization of adeno-associated virus vector integration in mouse liver. J Virol. 2005;79(6):3606–3614. doi: 10.1128/JVI.79.6.3606-3614.2005. [DOI] [PMC free article] [PubMed] [Google Scholar]
- Ott S, et al. Superiority of network motifs over optimal networks and an application to the revelation of gene network evolution. Bioinformatics. 2005;21(2):227–238. doi: 10.1093/bioinformatics/bth484. [DOI] [PubMed] [Google Scholar]
- Ozyildirim AM, et al. The lacrimal gland transcriptome is an unusually rich source of rare and poorly characterized gene transcripts. Invest Ophthalmol Vis Sci. 2005;46(5):1572–1580. doi: 10.1167/iovs.04-1380. [DOI] [PubMed] [Google Scholar]
- Rico-Bautista E, et al. Suppressor of cytokine signaling-2 deficiency induces molecular and metabolic changes that partially overlap with growth hormone-dependent effects. Mol Endocrinol. 2005;19(3):781–793. doi: 10.1210/me.2004-0040. [DOI] [PubMed] [Google Scholar]
- Schuler GD, et al. Entrez: molecular biology database and retrieval system. Methods Enzymol. 1996;266:141–162. doi: 10.1016/s0076-6879(96)66012-1. [DOI] [PubMed] [Google Scholar]
- Spellman PT, et al. Design and implementation of microarray gene expression markup language (MAGE-ML) Genome Biol. 2002;3:RESEARCH0046. doi: 10.1186/gb-2002-3-9-research0046. [DOI] [PMC free article] [PubMed] [Google Scholar]
- Wheeler DL, et al. Database resources of the National Center for Biotechnology Information. Nucleic Acids Res. 2005;33:D39–45. doi: 10.1093/nar/gki062. [DOI] [PMC free article] [PubMed] [Google Scholar]
- Yant SR, et al. High-resolution genome-wide mapping of transposon integration in mammals. Mol Cell Biol. 2005;25:2085–2094. doi: 10.1128/MCB.25.6.2085-2094.2005. [DOI] [PMC free article] [PubMed] [Google Scholar]
- Zhou XJ, et al. Functional annotation and network reconstruction through cross-platform integration of microarray data. Nat Biotechnol. 2005;23(2):238–243. doi: 10.1038/nbt1058. [DOI] [PubMed] [Google Scholar]