

Abstract
Motivation
Determining orthology relations among genes across multiple genomes is an important problem in the post-genomic era. Identifying orthologous genes can not only help predict functional annotations for newly sequenced or poorly characterized genomes, but can also help predict new protein–protein interactions. Unfortunately, determining orthology relation through computational methods is not straightforward due to the presence of paralogs. Traditional approaches have relied on pairwise sequence comparisons to construct graphs, which were then partitioned into putative clusters of orthologous groups. These methods do not attempt to preserve the non-transitivity and hierarchic nature of the orthology relation.
Results
We propose a new method, COCO-CL, for hierarchical clustering of homology relations and identification of orthologous groups of genes. Unlike previous approaches, which are based on pairwise sequence comparisons, our method explores the correlation of evolutionary histories of individual genes in a more global context. COCO-CL can be used as a semi-independent method to delineate the orthology/paralogy relation for a refined set of homologous proteins obtained using a less-conservative clustering approach, or as a refiner that removes putative out-paralogs from clusters computed using a more inclusive approach. We analyze our clustering results manually, with support from literature and functional annotations. Since our orthology determination procedure does not employ a species tree to infer duplication events, it can be used in situations when the species tree is unknown or uncertain.
1 INTRODUCTION
Comparative genomic approaches have been proven to be extremely valuable in functional characterization of sequenced genomes. One important goal of such analysis is to identify groups of homologous genes that are expected to play the same biological role across two or more organisms. Two genes are homologous if they have descended, usually with divergence, from a common ancestral gene. Homology relations are subdivided into two disjoint subtypes. Two genes from two different species are said to be orthologs if they evolved directly from a single gene in the last common ancestor (Fitch, 1970, Fitch, 2000). Genes that evolved from a single gene that was duplicated within a genome are called paralogs. Typically, orthologs perform the same function, whereas paralogs within a genome often evolve to perform a new function. Thus orthology relations can immediately be used to predict functional annotations for newly sequenced or poorly characterized genomes (Tatusov et al., 1997). Also, recent studies on protein–protein interaction networks show the importance of orthology relations towards predicting new protein–protein interactions (Sharan et al., 2005; Yu et al., 2004).
Paralogs are further classified into two subtypes: in-paralogs and out-paralogs (Remm et al., 2002; Sonnhammer and Koonin, 2002). With respect to a given speciation event, E, paralogs that evolved by gene duplications that happened after E are called in-paralogs, whereas paralogs that evolved by gene duplications that happened before E are called out-paralogs. This concept of in-paralogs and out-paralogs helps distinguish recent paralogs from distant paralogs An example illustrating this is presented as Figure 1.
Fig. 1.
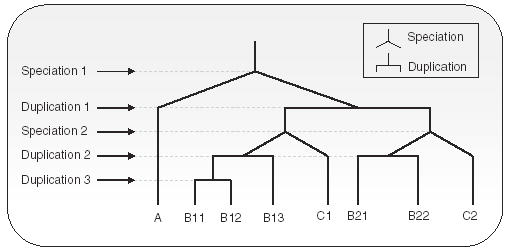
Evolution of a gene is shown, descending to three organisms A, B and C. There are two speciation events (inverse Y junctions), and three gene-duplication events (horizontal bars). Two genes whose common ancestor is at a Y junction(speciation) are orthologous, e.g. A and B11 and B21 and C2. Two genes whose common ancestor is at a horizontal bar junction (duplication) are paralogs, e.g. B11 and B13, and B12 and C2. Genes B11, B12 and B13 are in-paralogs to A (and C) because the speciation event 1 (speciation event 2, resp.) occurred before the duplication events that gave rise to B11, B12 and B13. Genes B11, B12 B13 and C1 are out-paralogs to genes B21, B22, and C2, as the initial duplication occurred before B-C speciation.
Due to the existence of numerous paralogs resulting from lineage specific duplications, correct assignment of the orthology relation is far from obvious. Consequently, gene orthology between two organisms is not necessarily a one-to-one relation—it could be a one-to-many or a many-to-many relation. The extension of the orthology concept to more than two genomes is further complicated by the fact that the orthology relation, in general, is non-transitive (Fitch, 1970, Fitch, 2000). For example, B11 and B12 in Figure 1 are paralogous to each other, but orthologous to A and C1. This potential lack of transitivity in the orthology relation indicates that one has to be extremely careful while extending this relation to multiple organisms. On the other hand, information that can be derived from multiple organisms is often more powerful than that provided by pairwise genome comparisons, and identifying clusters containing orthologous genes is of great value. In the rest of the paper, we use the terms gene and protein interchangeably.
Sequence similarity has been the major tool used to identify orthologs between fully sequenced genomes. For example, Chervitz et al. 1998 performed a comparative analysis of worm and yeast genomes. In a separate study, Makalowski and Boguski (1998) analyzed 1880 unique human-rodent sequence pairs, and reported 1212 human-rat orthologs, 1138 human-mouse orthologs and 470 human-mouse-rat orthologs.
To extract maximum amount of information from the rapidly accumulating genome sequences, Tatusov et al. 1997, 2000 proposed a method for clustering orthologous genes or orthologous groups of paralogs. Since, as mentioned above, the orthology relation is not necessarily transitive, Tatusov et al. redefined the task of identifying orthologs as a delineation of clusters of orthologous groups (COGs). Each COG contains individual orthologous genes or orthologous groups of paralogs from at least three phylogenetic lineages. Any two proteins from a given COG are expected to be orthologs if they are from sufficiently different lineages. Each COG is assumed to contain proteins that evolved from a single ancestral gene through a series of speciation and duplication events. COGs were constructed by performing pairwise sequence comparisons among proteins encoded in complete genomes. For each protein, the best-hit (BeT) in each of the other genomes is detected. The (directed) BeT relation is conceptualized with a graph. First, triangles (three-gene cliques) in this graph are identified. The authors argue that if gene x from organism X has BeTs in organisms Y (gene y) and Z (gene z), then it is highly unlikely that y and z are BeTs for one another unless they are bona fide orthologs. Using this premise, orthologous groups of genes are gathered by merging adjacent triangles in the graph.
The original COG clusters contained only prokaryotes, archaea, and three eukaryotic organisms. The idea was subsequently extended to eukaryotic genomes [TOGA (Lee et al., 2002), KOGs (Tatusov et al., 2003), and OrthoMCL (Li et al., 2003)]. Like the COG method, these new approaches rely on clustering using the BeT information. Consequently, they all impose transitive closure on the orthology relation and collapse the species hierarchy to the last common ancestor of all species in a given cluster. This leads to higher inclusiveness, resulting in a set with out-paralogs (paralogs that predate the species split at the last common ancestor) that can easily be confused with true orthologs. Figure 2 depicts a scenario where a single gene loss in each genome could lead to highly inclusive orthologous cluster. Methods based on pairwise sequence comparisons will not recognize such a scenario, and would thus cluster genes 1, 2, 3 and 4 from all four genomes into a single orthologous group.
Fig. 2.
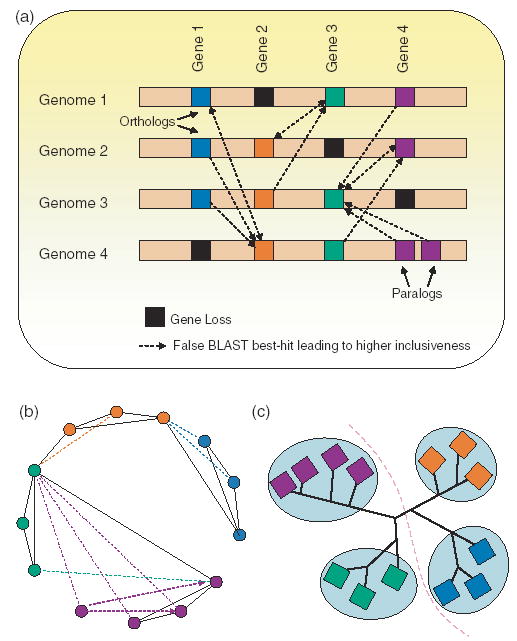
(a) A scenario where gene losses could lead to higher inclusiveness. COG-like methods based on pairwise sequence comparisons will not recognize false best-hits (non-orthologous genes) in a genome. For example, loss of gene 1 in genome 4 could trigger false best-hits to gene 2 in genome 4, which will result in higher inclusiveness when it comes to delineating an orthologous group with gene 1’s functionality. (b) BLAST best-hits (BeTs) graph. which will be used by the COG algorithm to cluster all the genes together. Dark edges are mutual BeTs, and colored dotted edges are one-way BeTs. (c) Phylogenetic tree that may shed some light on gene losses.
Sequence-based clustering approaches, which employ just the pairwise sequence comparisons, are often unable to separate in-paralogs from out-paralogs, as well as correctly depict the orthology relation between more closely related organisms in the presence of more diverse organisms. To address this problem, Remm et al. 2002 designed INPARANOID, an algorithm that allows for searching for orthologs and in-paralogs between two completely sequenced organisms. Like Tatusov et al.’s, their method starts with bi-directional BeTs. Subsequently, they use BLAST (Altschul et al., 1990) scores and a careful inclusion criterion to add putative in-paralogs.
Li et al. 2003 extend Remm et al.’s method to multiple organisms (in the program OrthoMCL) for identification of orthologous groups for eukaryotic genomes. The idea behind OrthoMCL is similar to that of TOGA and COG, but compared to TOGA, several assumptions were relaxed leading to larger clusters. Subsequently, these clusters have to be subdivided using a Monte Carlo clustering method with some tunable parameters. Like previous approaches, OrthoMCL relies on pairwise best-hits and does not attempt to preserve the non-transitivity and hierarchic nature of the orthology relation.
Since orthology is defined based on phylogeny, it makes sense that phylogeny should be used as a part of a strategy to identify orthology (Eisen and Wu, 2002). The most direct way using phylogeny relies on computing reconciled trees (Chen et al., 2000; Dufayard et al., 2005; Durand et al., 2005; Engelhardt et al., 2005; Goodman et al., 1979; Guigo et al., 1996; Mirkin et al., 1995; Page and Charleston, 1997; Page, 1994; Storm and Sonnhammer, 2002; Yuan et al., 1998; Zmasek and Eddy, 2001, 2002). Tree reconciliation methods have been used in both directions: to infer species tree from one or more gene-trees, and to visualize the history of a gene family within an organismal phylogeny assuming that the species tree is available. In the latter case, subsequent improvements on these methods have led to algorithms that (under assumption that the species tree is correct) allow the gene-tree to be uncertain, and consider bootstrap resampled gene trees (Zmasek and Eddy, 2002) or various topologies around the edges with low bootstrap values (Durand et al., 2005). There are cases when the species tree is not available. In those situations, clustering remains a natural choice to delineate orthology relation.
Since the orthology relation is inherently hierarchical, it should be depicted as an hierarchy of clusters. In this work, we propose a hierarchical clustering algorithm called COCO-CL (COrrelation COefficient-based CLustering). While retaining the simplicity of previous clustering approaches, our method is guided by phylogenetic relations. Our method utilizes evolutionary relations between genes and performs clustering based on evolutionary histories of genes. Given a refined set of homologous proteins, obtained using a less-conservative clustering method, our method identifies orthology/paralogy relationship between them. One application of our method is to identify and remove putative out-paralogs, and create cluster(s) of orthologous proteins that include proteins from all or nearly all species represented in the input set. However, it is also possible that our method can be used to perform a deeper hierarchical clustering leading to orthologous subclusters imposed by speciation. We provide bootstrap scores for the obtained clusters, and confidence scores for the predicted duplication events. Since our orthology determination procedure does not employ a species tree information to infer gene duplication events, it can be used when the species tree is unknown or uncertain.
2 METHODS
2.1 Sequence and correlation analysis
Let n be the number of proteins in a given set of homologous proteins. Homologous sequences contained in a given set were aligned using ClustalW v1.83. Similarity matrix, M, from the multiple sequence alignment is calculated using ClustalW. Let Vi denote the vector of evolutionary distances in the similarity matrix from protein i. A new matrix called the ‘correlation coefficient matrix’ is calculated, in which each entry rij represents the agreement between column vectors Vi and Vj in the similarity matrix (refer to Fig. 1 in the Supplementary material). The extent of agreement between vectors Vi and Vj in the similarity matrix is evaluated using the Pearson’s correlation coefficient given by
where Vi(l) and Vj(l) are the evolutionary distances from protein l to proteins i and j, respectively, and and are the mean of all Vi(l) and Vj(l) values, respectively. The value of rij ranges from −1.0 to +1.0. Correlation coefficient close to 1 indicates that the evolutionary histories of the two genes are closely related. Negative correlation coefficient indicates lack of such correlation (relative to their evolutionary distances to other genes in the set).
2.2 Clustering
First, we replace each entry rij in the correlation coefficient matrix (ranging from −1.0 to +1.0) by 1−rij. Next, we perform a single linkage clustering (Johnson, 1967) of the genes (connected component) over the values in the correlation coefficient matrix. The objective here is to cluster a given set of genes into exactly two clusters during each run of our algorithm. In each run, the final edge (link) introduced during the clustering process, to connect the last two clusters, is the edge (cut) across which the two clusters are defined. In other words, the last two remaining clusters are what we are after. Let C1 and C2 be the two resulting clusters (sets of genes). Let SC1and SC2be the number of species represented in sets C1 and C2, respectively. Let S be the number of species common to both C1 and C2. Let split-score
A split-score of 0 indicates a speciation event, while a split-score of 1 or nearly 1 indicates a duplication event with high possibility. In general, a split could be viewed as a putative duplication with confidence score σ, or a putative speciation event with confidence score 1 − σ. The higher the value of σ, the higher the confidence that the split is a duplication event.
If a split is a putative duplication event, the cluster, say C1, that contains proteins from almost all the species is the refined set of orthologous/homologous proteins, while cluster C2 is the set of out-paralogs with respect to the refined set. Depending on C2’s coverage of species, one could classify it as yet another set of orthologous/homologous proteins. In the extreme case, when one of the clusters contains several proteins belonging to just one species and the other cluster also contains a protein from the same species, it is theoretically possible that all these proteins are in-paralogs that diverged significantly after the last speciation event. An interesting example with such a possibility is discussed in Section 3 under ‘Ribonuclease H’ subsection.
One may recursively refine a set of orthologous/homologous proteins, until no more out-paralogs can be removed or there is not enough clustering bootstrap support for further refinement.
2.3 Estimation of statistical significance of clustering
We perform bootstrap analysis to provide percentage level of confidence on the clustering. Let A be a multiple sequence alignment of a set of proteins that needs to be clustered, and let C1 and C2 be the two resulting clusters. From A, we generate 1000 bootstrap alignments, where the length of each bootstrap alignment is same as that of A, with each column drawn (with replacement) uniformly at random from A. Let A* be a bootstrap alignment, and let and be the two resulting clusters on application of our clustering mechanism. For each bootstrap alignment, we computed a clustering agreement score on how well the resulting clusters ( and ) agree with the original clusters (C1 and C2) obtained from A. The clustering agreement score is given by
where |X| denotes number of proteins in set X. The value of α ranges from 0.0 to 1.0, with α = 1.0 indicating maximal agreement (C1 = and C2 = , or C1 = and C2 = ).
The bootstrap score for an obtained clustering (C1 and C2) is the average of the clustering agreement scores of all 1000 bootstrap alignments. We consider a clustering split to be reliable if and only if the bootstrap score is above a certain threshold. We chose the threshold to be 0.75. In other words, we call a split to be a putative duplication event with confidence score σ if and only if the clustering bootstrap score is at least 0.75 (clustering bootstrap scores in the 0.7–0.8 range should be handled with caution, as we consider this range to be a twilight zone). Thus, with each split we associate two confidence numbers: bootstrap score measuring the confidence of the split, and split-score σ measuring the confidence that the split is a putative duplication event separating out-paralogs (with respect to the lowest common ancestor of the set of species in the group). Again, a split is a putative duplication with confidence score σ, or a putative speciation event with confidence score 1−σ.
3 RESULTS
For this study, we used homologous sets of proteins from the COG database, although our method applies equally well to any other protein classification database. We tested our approach as a refinement of complex COGs (Tatusov et al., 1997). Based on the literature and database search, we selected COGs that have significant number of paralogs. Since there does not exist any database of gold standard for correctly identified (and non-trivial) orthologous clusters, we analyze our results manually, with support from literature and functional annotations.
In the discussion below, we use the following naming conventions. Let C be a cluster of homologous proteins. Then C_a, where a is either 1 or 2, refers to the a-th subcluster of C. Consequently, C_ab refers to the b-th subcluster of C_a and so on.
3.1 DNA-directed RNA polymerases, sigma subunit
As a first test of our COCO-CL algorithm, we examined COG0568 from the COGs database, which contains 103 proteins from 50 prokaryotic species. COG0568 is annotated as ‘DNA-directed RNA polymerase, sigma subunit (sigma70/sigma32).’ This COG was characterized as a complex COG by Tatusov et al. 1997 due to the presence of numerous paralogs. Figure 3b presents the phylogenetic tree of COG0568, constructed via neighbor joining from the multiple sequence alignment using ClustalW v1.83. Application of COCO-CL algorithm on COG0568 resulted in two main clusters, COG0568_1 and COG0568_2, with a bootstrap score 0.82 (Fig. 3). Cluster COG0568_1 contained 102 proteins from 50 species, while COG0568_2 contained the remaining protein (DR2482) belonging to Deinococcus radiodurans, which we characterized as an outlier with split-score (confidence) 1.0. We ran our algorithm on COG0568_1, hoping to see meaningful clusters. Interestingly, COG0568_1 was clustered into two subclusters, COG0568_11 and COG0568_12, with a bootstrap score 0.91. Cluster COG0568_11 contained 78 proteins from 50 species, while COG0568_12 contained the remaining 24 proteins from 21 species, indicating a putative duplication event with confidence score 1.0. In other words, two proteins from the same species that are in two different clusters are putative out-paralogs.
Fig. 3.
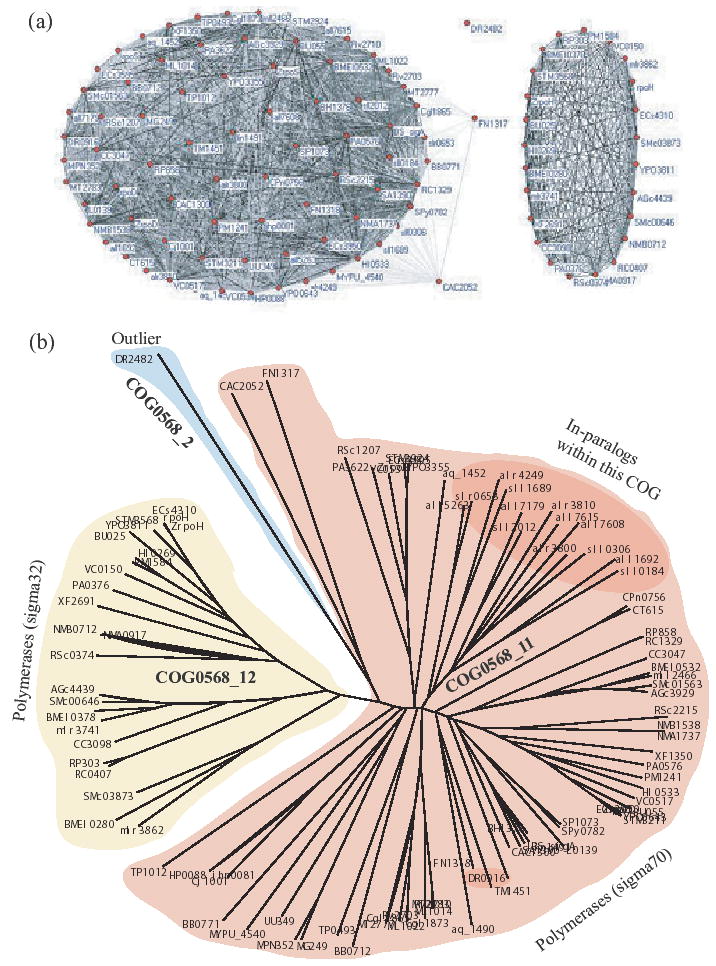
COG0568 (DNA-directed RNA polymerase, sigma subunit (sigma70/sigma32)) with 103 proteins from 50 species. (a) Initial clustering on COG0568 resulted in two subclusters: COG0568_1 with 102 proteins from 50 species, and COG0568_2 with just one protein. Recursive clustering of COG0568_1 resulted in COG0568_11 (78 proteins from 50 species) and COG0568_12 (24 proteins from 21 species). The darker the edge in the graph, the higher the correlation between the two nodes that it connects. (b) Neighbor joining phylogenetic tree of COG0568 proteins, showing our clustering results.
In order to validate our clustering, we examined the functionalities of all 103 proteins in COG0568. Our decision to designate the lone protein in COG0568_2 as an outlier is justified by the fact that DR2482 is a hypothetical protein, whose functionality is yet to be annotated. Furthermore, our examination revealed that proteins in COG0568_11 have functional annotation ‘DNA-directed RNA polymerase, sigma subunit (sigma70),’ and proteins in COG0568_12 have functional annotation ‘DNA-directed RNA polymerase, sigma subunit (sigma32).’ This strongly suggests that our clustering correctly identified two clusters, proteins in each of which are orthologous. Subsequent clustering of COG0568_11 resulted in COG0568_111 (with 76 proteins from 50 species) and COG0568_112 (with just two proteins CAC2052 and FN1317) with 0.89 bootstrap score and 1.0 confidence score. COG0568_111 splits into COG0568_1111 (75 proteins) and COG0568_1112 (with just TP1012) with 0.82 bootstrap score and 1.0 confidence score. Further clustering of COG0568_1111 resulted in clusters with low bootstrap score of 0.25, which was not high enough to proceed any further.
3.2 Periplasmic serine proteases (ClpP class)
Next, we tested COG0616, annotated as ‘periplasmic serine proteases (ClpP class),’ which contains 89 proteins from 51 prokaryotic and archaic species. Members of this COG are supposed to be involved in pre-protein translocation across the membrane and subsequent processing (Bolhuis et al., 1999). Our initial clustering resulted in two clusters: cluster COG0616_1 containing 77 proteins from 47 species, and cluster COG0616_2 containing 12 proteins from 11 species with a clustering bootstrap score 0.97 (Fig. 4a). Our algorithm characterizes this split as a putative duplication event with 0.64 confidence score, a prediction supported by the evidence that unlike COG0616_1, COG0616_2 contains only hypothetical proteins whose functions are yet to be annotated. Recursive application of our algorithm on COG0616_1 revealed two subclusters: cluster COG0616_11 containing 65 proteins from 46 species, and COG0616_12 containing 12 proteins from 12 species with a bootstrap score 0.77 (Fig. 4b). Again, our algorithm predicted this split to be a putative duplication event with 0.92 confidence score, a decision supported by the fact that the 12 proteins in COG0616_12 are annotated as putative/possible proteases. If evidence is presented that COG0616_12 proteins are in fact proteases, it is quite possible that these proteins (paralogs to their counterparts in COG0616_11) retained their functionality after duplication. Another round of clustering on COG0616_11 resulted in two subclusters: cluster COG0616_111 with 56 proteins from 46 species, and cluster COG0616_112 with 9 proteins (from Salmonella typhimurium and two strains of Escheria coli). The clustering had a bootstrap score of 0.85 (Fig. 4c), and was characterized as a duplication event with 1.0 confidence score. The 9 proteins in COG0616_112 are annotated not as proteases, but as putative capsid or putative head-tail connector proteins. We did try to apply our algorithm on COG0616_111 with 56 proteins from 46 species, which resulted in a clustering along the taxonomy with a low bootstrap score of 0.28. This signaled that no further meaningful clustering is possible. Since COG0616_111 contains almost all species from COG0616, and the subclusters separated out have high bootstrap and confidence scores, COG0616_111 correctly refines the original COG.
Fig. 4.
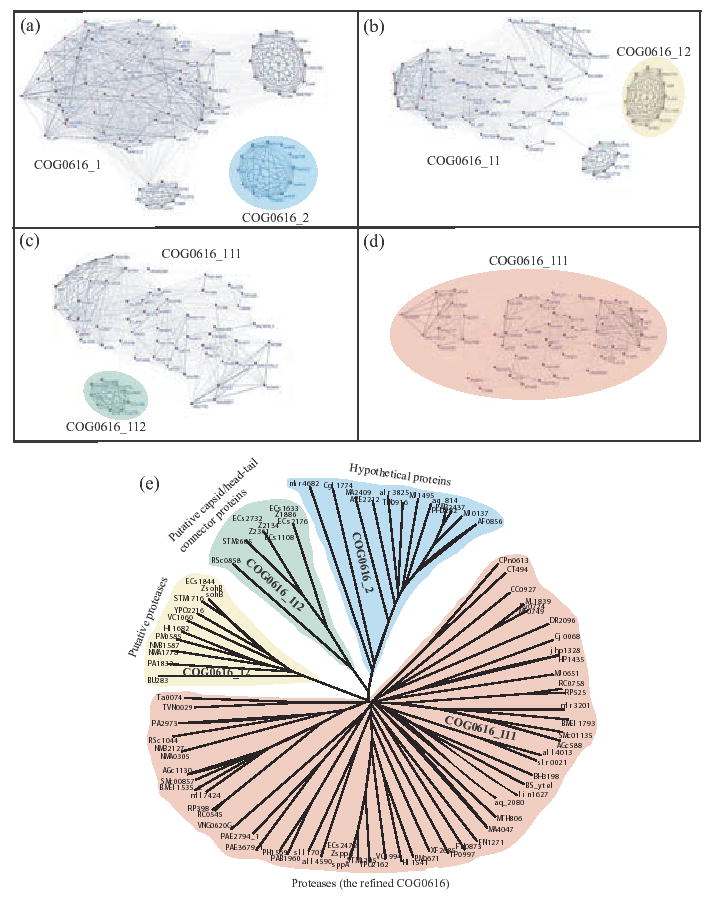
COG0616 (periplasmic serine proteases) with 89 proteins from 51 species. (a) Initial clustering on COG0616 resulted in subclusters COG0616_1 and COG0616_2 (12 hypothetical proteins 11 species). (b) Second round of clustering on COG0616_1 yielded subclusters COG0616_11 and COG0616_12 (12 proteins, annotated as ‘putative proteases’, from 12 species). (c) Clustering COG0616_11 resulted in subclusters COG0616_111 (56 proteins, annotated as ‘periplasmic serine proteases’, from 46 species) and COG0616_112 (9 proteins, annotated as ‘putative capsid or head-tail preconnector proteins,’ from E.coli). (d) Clustering COG0616_111 resulted in a two subclusters, split along the taxonomy, with low bootstrap support. (e) Neighbor joining phylogenetic tree of COG0616 proteins showing our clustering results.
3.3 Glutamyl- and glutaminyl-tRNA synthetases
To test the rigorousness of our algorithm, we ran it on COG0008, annotated as ‘glutamyl- and glutaminyl-tRNA synthetases,’ a family of proteins known to have had horizontal gene transfers (Siatecka et al., 1998; Brown and Doolittle, 1999; Wolf et al., 1999). This COG contains 111 proteins from 66 species, representing all three domains of life (prokaryotes, eukaryotes and archaea). Our clustering revealed two cleanly split clusters with 1.0 bootstrap score: cluster COG0008_1 with 77 proteins from 52 prokaryotic and eukaryotic species, and cluster COG0008_2 with 34 proteins from 31 species representing all three domains of life. COCO-CL defines this split to be a putative duplication event with 0.55 confidence score. Manually-curated Conserved Domain Database (CDD) (Marchler-Bauer et al., 2005) classification, showing that COG0008_1 proteins are grouped under CD00808 [based on ‘descriminating Glutamyl-tRNA synthetase (GluRS) catalytic core domain’] and COG0008_2 proteins are grouped under a closely related CD00807 [based on ‘glutaminyl-tRNA synthetase (GlnRS) and non-descriminating Glutamyl-tRNA synthetase (GluRS) catalytic core domain’], justifies our clustering.
However, the split is a speciation event and not a duplication event as called by COCO-CL (Fig. 5). Due to the manner in which the confidence score σ is computed by COCO-CL, horizontal gene transfers can artificially decrease the confidence score of a speciation event. In cases with ancient (or rampant) horizontal gene transfer(s), our method may incorrectly call a speciation event to be a duplication event with high confidence score. That is, the extent of horizontal transfers could influence (increase) the σ score, thereby increasing the chances of wrongly inferring a speciation event to be a duplication event. In the case of COG0008, an early duplication of the GluRS gene in eukaryotes gave rise to the gene for GlnRS, a copy of which was subsequently transferred to proteobacteria (Lamour et al., 1994). This gene transfer wrongly boosted the confidence score to just over 0.5 cutoff, which resulted in wrongly calling the speciation event to be a duplication event. Clustering methods based on bi-directional BLAST best-hits may get such cases correctly due to their insensitivity to horizontal gene transfers.
Fig. 5.
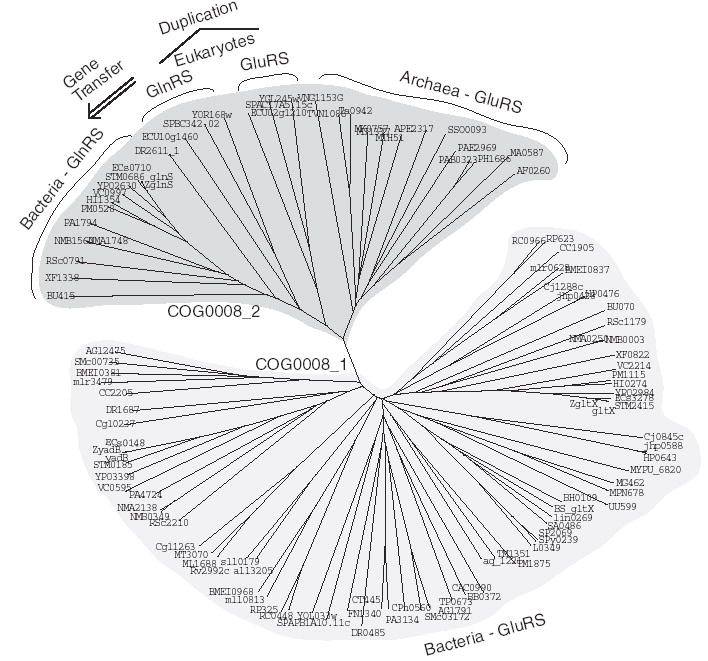
COG0008 (glutamyl- and glutaminyl-tRNA synthetases) with 111 proteins from 66 species. COCO-CL on COG0008 resulted in two subclusters: COG00008_1 with 77 proteins from 52 species, and COG0008_2 with 34 proteins from 31 species, with 17 species represented in both subclusters. The clustering is correct based on Conserved Domain Database (CDD) classification, which has clustered these proteins along similar lines based on the Glutamyl-tRNA synthetase (GluRS)/Glutaminyl-tRNA synthetase (GlnRS) cataytic core domain. However, COCO CL wrongly called this split as a duplication, while it is in fact a speciation. This confusion is due to an early duplication of the GluRS gene in eukaryotes, which gave rise to the gene for GlnRS, a copy of which was subsequently transferred to proteobacteria.
On further clustering, COG0008_1 splits with a low bootstrap score of 0.48, while COG0008_2 splits across the taxonomy with a bootstrap score 1.0 (separating archaea from the rest).
3.4 Ribonuclease H
On eukaryotic KOG3752 (annotated as ‘ribonuclease H’) with 10 proteins from five organisms, application of our algorithm resulted in two clusters with bootstrap score 0.72. The first cluster KOG3752_1 had eight proteins from five organisms, and the second cluster KOG3752_2 had two proteins (CE06185 and CE16374) from Caenorhabditis elegans (refer to Fig. 2 in the Supplementary material). The low clustering bootstrap score is in the twilight zone indicating that the split is not clear-cut, and thus cannot be fully trusted to make any reliable prediction. Our algorithm’s decision not to split KOG3752 is consistent with Arudchandran et al. 2002’s argument that C.elegans has five genes encoding ribonuclease H-related proteins.
3.5 Large-scale experiments
We ran COCO-CL on all 4873 manually curated COGs (comprising a total of 1 44 320 proteins) from the COG database. The results from one iteration of COCO-CL on the 4873 COGs are presented in Figure 6. Data on our test results data are available at http://www.ncbi.nlm.nih.gov/CBBresearch/Przytycka/COCOCL/. We used a clustering bootstrap threshold (α) of 0.75 to ensure that the clustering splits are high-confidence splits. A split is predicted to be a duplication if the confidence score σ for that split is greater than 0.5 (at least 50% of the species in the smaller subcluster has paralogs in the larger subcluster). Our results show that the more the number of genomes represented in a COG, the highly likely the high-confidence split is a duplication. This suggests that COG-like approaches works very well for elucidating orthologous groups of genes for smaller number of genomes (up to 15 or 20 genomes), whereas such approaches exhibit inclusiveness as the number of genomes under consideration increases. This raises scalability issues of COG-like approaches, which can be easily dealt on applying COCO-CL on the clusters generated by COG-like methods. Our results show that at least 15% of the current COGs are inferred to contain putative out-paralogs. This percentage is higher for COGs containing proteins from more genomes.
Fig. 6.
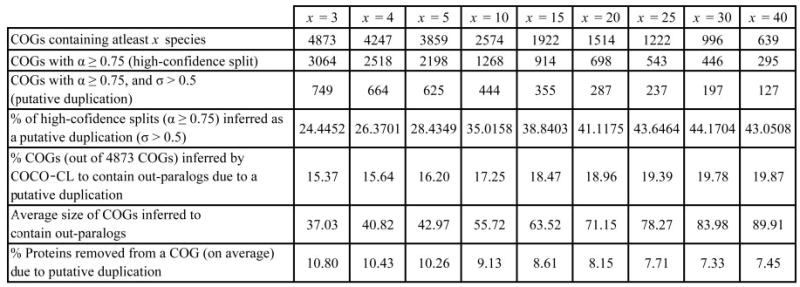
Results from a single iteration of COCO-CL on 4873 manually curated COGs (comprising a total of 1 44 320 proteins) from the COG database. A cluster split is inferred to be a duplication, if and only if its clustering bootstrap threshold α ≥ 0.75, and its confidence score σ > 0.5 (at least 50% of the species in the smaller subcluster has paralogs in the larger subcluster). The more the number of genomes represented in a COG, the highly likely the high-confidence split is a duplication. At least 15% of the 4873 COGs are inferred to contain putative out-paralogs.
3.6 Control experiments
We performed control experiments to verify whether our algorithm can successfully isolate (pick) a COG from a set of homologous proteins. We combined two homologous COGs—COG0616 annotated as ‘periplasmic serine proteases (ClpP class)’ (Fig. 4b), and COG1030 annotated as ‘membrane-bound serine proteases (ClpP class)’ with 18 proteins from 16 species—and ran our clustering algorithm on the resulting set of homologous proteins. Our algorithm successfully separated the two COGs with bootstrap score 0.84, with just one protein (PAE2539) from COG1030 switching to COG0616. On verification, the switch is justified as protein PAE2539 (annotated as a hypothetical protein) correctly clusters with sub-COG COG0616_2 (hypothetical proteins) of COG0616 (Fig. 4b).
We combined 5 homologous ORTHOMCL clusters (ORTHOMCL1008, ORTHOMCL17163, ORTHOMCL2887, ORTHOMCL1382 and ORTHOMCL771) to obtain a super-set of 190 proteins from 55 genomes (16 bacterial genomes, 4 archaic genomes, 21 single-cellular eukaryotes and 14 multi-cellular eukaryotes). Iterative application of COCO-CL on the superset resulted in four well-defined subclusters, which are shown in Figure 7. The COG database classifies this superset of proteins into two clusters: COG0442 (Prolyl-tRNA synthetases) and COG0008 (Glutamyl-and glutaminyl-tRNA synthetases). ORTHOMCL seems to have over-clustered ‘descriminating Glutamyl-tRNA synthetases’ into two groups: ORTHOMCL1008 and ORTHOMCL17163. COCO-CL correctly groups the two glutamyl-tRNA syntetases from ORTHOMCL1382 in ORTHOMCL2887. This specific example clearly demonstrates the ability of COCO-CL to correctly cluster orthologous genes in contrast to the overclustering exhibited by the ORTHOMCL.
Fig. 7.
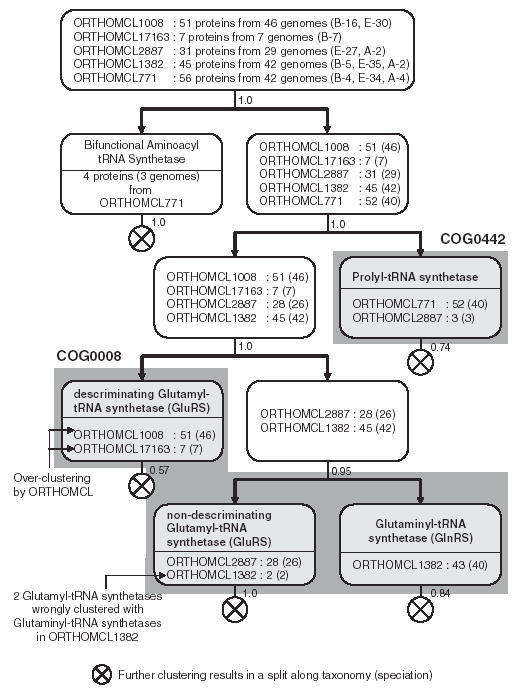
Five homologous ORTHOMCL clusters (ORTHOMCL1008, ORTHOMCL17163, ORTHOMCL2887, ORTHOMCL1382, ORTHOMCL771) were combined to obtain a superset of 190 proteins representing 55 genomes (16 bacterial, 4 archaic, 21 single-cellular eukaryotic, and 14 multi-cellular eukaryotic genomes). Letters B, E and A refer to bacterial eukaryotic and archaic genomes, respectively. Numbers within parentheses indicate the number of genomes, and numbers along the edges represent the clustering bootstrap score. The cumulative clustering results for four rounds of COCO-CL is shown. This example demonstrates the over-clustering by the ORTHOMCL algorithm.
Clustering results of COCO-CL on raw BLAST searches are presented in the Supplementary material.
4 DISCUSSION AND CONCLUSION
In this work, we propose a new clustering method, COCO-CL, for hierarchical clustering of homologous genes. COCO-CL can be used as a semi-independent method that takes as input a refined set of homologous proteins obtained using a less-conservative clustering algorithm, or as a refinement of clusters produced by other more-inclusive methods. Unlike most hierarchical clustering methods, which use evolutionary distances to cluster, COCO-CL takes advantage of the global topology of correlation networks and explores correlation of evolutionary histories in a more global context. Consequently, it is not easily mislead by erroneous BLAST best-hits. Evolutionary distance between genes x and y captures only the relationship between genes x and y, while the correlation of evolutionary histories of genes x and y captures the relationship between x and y with respect to the set that contains them. The clustering signal is amplified when evolutionary correlations are used instead of evolutionary distances (refer to Figure 3 in the Supplementary material). Our idea to use correlation of evolutionary histories of genes is motivated by works (Goh et al., 2000; Goh and Cohen, 2002; Jothi et al., 2005; Pazos and Valencia, 2001; Ramani and Marcotte, 2003) that used evolutionary correlations to study correlated mutations and protein-protein interactions.
Since our method does not use a species tree, it can be used to infer duplication events when the species tree is unknown or uncertain. Also, our method does not use the gene tree directly, but it implicitly uses the evolutionary information contained in the evolutionary distance matrix. This makes our method independent of phylogenetic tree construction methods. There are cases where our method may fail completely. Especially, cases with rampant gene losses, ancient horizontal gene transfer(s) or incomplete data sets due to partial genomic data.
The ribonuclease example analyzed in the previous section points out that there is a real possibility of in-paralogs diverging so significantly that they can be confused with out-paralogs. In the analyzed example, the incorrect split was prevented by low clustering bootstrap value. Suppose we decide to trust the split, ignoring the low bootstrap support. Then, it would mean that the two C.elegans proteins in KOG3752_2 are out-paralogs to the C.elegans proteins in KOG3752_1 with 1.0 confidence score. This is in direct contrast to the argument made by Arudchandran et al. 2002 that C.elegans has five genes encoding ribonuclease H-related proteins (four genes encoding RNase H1 proteins, and one gene for RNase H2). The authors provide a convincing argument that all the five C.elegans proteins are in-paralogs.
An important utility of our method is its ability to correctly separate clusters of out-paralogs without the assumption that the species tree is known. Using our hierarchical clustering approach, one can forcefully perform a recursive hierarchical clustering of a given set of homologs, until each subcluster contains just one gene. This way, we can obtain a tree with proteins at the leaves, and internal nodes labeled as putative speciation/duplication events. It is important to observe that this tree may not necessarily be the correct gene tree. That is, we do not provide a ‘back door’ solution to the reconciliation problem. The reason being that while our method attempts to identify the type of event (speciation/duplication) separating two clusters, it does not attempt to resolve the ordering of these events (refer to Fig. 4 in the Supplementary material).
Using BLAST e-values or pairwise sequence identity scores, instead of a multiple sequence alignment similarity matrix, resulted in not-so-well-defined clusters. In other words, the signal was very low. Complicating the problem was lack of parameters to perform any meaningful bootstrap analysis, i.e. we could not quantify the quality of the clustering. Moreover, since orthology is defined based on phylogeny, using pairwise metrics may not be the best way to identify orthology.
Even though COG-like approaches work very well for elucidating orthologous clusters from fewer number of genomes (up to 15 or 20 genomes), they become more inclusive as the number of genomes under consideration is high. Our results in Figure 6 show that while only 25–35% of the high-confidence splits (α ≥ 0.75) are inferred to have out-paralogs, the percentage increases to 40% or more as the number of genomes represented in a COG is at least 20. Thus, in cases where the number of genomes under consideration is high, COCO-CL can directly be used as a refiner to refine the inclusive clusters generated by COG-like approaches.
Supplementary Material
Acknowledgments
We thank Madan M. Babu, S. Balaji, Alejandro Schäffer and Roman L. Tatusov for valuable discussions, and Praveen F. Cherukuri, Tarek Hassan, Maricel G. Kann and Mona Singh for useful comments. This work was supported by the National Institutes of Health, National Library of Medicine intramural research program. Funding to pay the Open Access publication charges was provided by the intramural research program of the National Institutes of Health.
Footnotes
Associate Editor: Martin Bishop
Contact: jothi@mail.nih.gov, przytyck@mail.nih.gov
Supplementary information: Supplementary materials are available at Bioinformatics online.
Conflict of Interest: none declared.
References
- Altschul SF, et al. Basic local alignment search tool. J Mol Biol. 1990;215:403–410. doi: 10.1016/S0022-2836(05)80360-2. [DOI] [PubMed] [Google Scholar]
- Arudchandran A, et al. Multiple ribonuclease H-encoding genes in the Caenorhabditis elegans genome contrasts with the two typical ribonuclease H-encoding genes in the human genome. Mol Biol Evol. 2002;19:1910–1919. doi: 10.1093/oxfordjournals.molbev.a004015. [DOI] [PubMed] [Google Scholar]
- Bolhuis A, et al. Signal peptide peptidase- and ClpP-like proteins of bacillus subtilis required for efficient translocation and processing of secretory proteins. J Biol Chem. 1999;274:24585–24592. doi: 10.1074/jbc.274.35.24585. [DOI] [PubMed] [Google Scholar]
- Brown JR, Doolittle WF. Gene descent, duplication, and horizontal transfer in the evolution of glutamyl- and glutaminyl-tRNA synthetases. J Mol Evol. 1999;49:485–495. doi: 10.1007/pl00006571. [DOI] [PubMed] [Google Scholar]
- Chen K, et al. NOTUNG: a program for dating gene duplication and optimizing gene family trees. J Comput Biol. 2000;7:429–447. doi: 10.1089/106652700750050871. [DOI] [PubMed] [Google Scholar]
- Chervitz SA, et al. Comparison of the complete protein sets of worm and yeast: orthology and divergence. Science. 1998;282:2022–2028. doi: 10.1126/science.282.5396.2022. [DOI] [PMC free article] [PubMed] [Google Scholar]
- Dufayard JF, et al. Tree pattern matching in phylogenetic trees: automatic search for orthologs or paralogs in homologous gene sequence databases. Bioinformatics. 2005;21:2596–2603. doi: 10.1093/bioinformatics/bti325. [DOI] [PubMed] [Google Scholar]
- Durand D, et al. A hybrid micro-macro approach to gene tree reconstruction. RECOMB. 2005:250–264. doi: 10.1089/cmb.2006.13.320. [DOI] [PubMed] [Google Scholar]
- Eisen JA, Wu M. Phylogenetic analysis and gene functional predictions: phylogenomics in action. Theor Popul Biol. 2002;61:481–487. doi: 10.1006/tpbi.2002.1594. [DOI] [PubMed] [Google Scholar]
- Engelhardt BE, et al. Protein molecular function prediction by Bayesian phylogenomics. PLoS Computat Biol. 2005;1:e45. doi: 10.1371/journal.pcbi.0010045. [DOI] [PMC free article] [PubMed] [Google Scholar]
- Fitch WM. Distinguishing homologous from analogous proteins. Syst Zool. 1970;19:99–106. [PubMed] [Google Scholar]
- Fitch WM. Homology a personal view on some of the problems. Trends Genet. 2000;16:227–231. doi: 10.1016/s0168-9525(00)02005-9. [DOI] [PubMed] [Google Scholar]
- Goh CS, et al. Co-evolution of proteins with their interaction partners. J Mol Biol. 2000;299:283–293. doi: 10.1006/jmbi.2000.3732. [DOI] [PubMed] [Google Scholar]
- Goh CS, Cohen FE. Co-evolutionary analysis reveals insights into protein–protein interactions. J Mol Biol. 2002;324:177–192. doi: 10.1016/s0022-2836(02)01038-0. [DOI] [PubMed] [Google Scholar]
- Goodman M, et al. Fitting the gene lineage into its species lineage: a parsimony strategy illustrated by cladograms constructed from globin sequences. Syst Zool. 1979;28:132–168. [Google Scholar]
- Guigo R, et al. Reconstruction of ancient phylogenies. Mol Phylogenet Evol. 1996;6:189–213. doi: 10.1006/mpev.1996.0071. [DOI] [PubMed] [Google Scholar]
- Johnson SC. Hierarchical clustering schemes. Psychometrika. 1967;2:241–254. doi: 10.1007/BF02289588. [DOI] [PubMed] [Google Scholar]
- Jothi R, et al. Predicting protein–protein interaction by searching evolutionary tree automorphism space. Bioinformatics. 2005;21 (Suppl 1):i241–i250. doi: 10.1093/bioinformatics/bti1009. [DOI] [PMC free article] [PubMed] [Google Scholar]
- Lamour V, et al. Evolution of the Glx-tRNA synthetase family: the glutaminyl enzyme as a case of horizontal gene transfer. Proc Natl Acad Sci USA. 1994;91:8670–8674. doi: 10.1073/pnas.91.18.8670. [DOI] [PMC free article] [PubMed] [Google Scholar]
- Lee Y, et al. Cross-referencing eukaryotic genomes: TIGR Orthologous Gene Alignments (TOGA) Genome Res. 2002;12:493–502. doi: 10.1101/gr.212002. [DOI] [PMC free article] [PubMed] [Google Scholar]
- Li L, et al. OrthoMCL : identification of ortholog groups for eukaryotic genomes. Genome Res. 2003;13:2178–2189. doi: 10.1101/gr.1224503. [DOI] [PMC free article] [PubMed] [Google Scholar]
- Makaowski W, Boguski MS. Evolutionary parameters of the transcribed mammalian genome: an analysis of 2,820 orthologous rodent and human sequences. Proc Natl Acad Sci USA. 1998;95:9407–9412. doi: 10.1073/pnas.95.16.9407. [DOI] [PMC free article] [PubMed] [Google Scholar]
- Marchler-Bauer A, et al. CDD: a conserved domain database for protein classification. Nucleic Acids Res. 2005;33:D192–D196. doi: 10.1093/nar/gki069. [DOI] [PMC free article] [PubMed] [Google Scholar]
- Mirkin B, et al. A biologically consistent model for comparing molecular phylogenies. J Comput Biol. 1995;2:493–507. doi: 10.1089/cmb.1995.2.493. [DOI] [PubMed] [Google Scholar]
- Page RD, Charleston MA. From gene to organismal phylogeny: reconciled trees and gene tree/species tree problem. Mol Phylogenet Evol. 1997;7:231–240. doi: 10.1006/mpev.1996.0390. [DOI] [PubMed] [Google Scholar]
- Page RDM. Maps between trees and cladistic analysis of historical associations among genes, organisms, and areas. Syst Biol. 1994;43:58–77. [Google Scholar]
- Pazos F, Valencia A. Similarity of phylogenetic trees as indicator of protein–protein interaction. Protein Eng. 2001;14:609–614. doi: 10.1093/protein/14.9.609. [DOI] [PubMed] [Google Scholar]
- Ramani A, Marcotte EM. Exploiting co-evolution of interacting proteins to discover interaction specificity. J Mol Biol. 2003;327:273–284. doi: 10.1016/s0022-2836(03)00114-1. [DOI] [PubMed] [Google Scholar]
- Remm M, et al. Automatic clustering of orthologs and in-paralogs from pariwise species comparisons. J Mol Biol. 2002;314:1041–1052. doi: 10.1006/jmbi.2000.5197. [DOI] [PubMed] [Google Scholar]
- Sharan R, et al. Conserved patterns of protein interaction in multiple species. Proc Natl Acad Sci USA. 2005;102:1974–1979. doi: 10.1073/pnas.0409522102. [DOI] [PMC free article] [PubMed] [Google Scholar]
- Siatecka M, et al. Modular evolution of the Glx-tRNA synthetase family–rooting of the evolutionary tree between the bacteria and archaea/eukarya branches. Eur J Biochem. 1998;256:80–87. doi: 10.1046/j.1432-1327.1998.2560080.x. [DOI] [PubMed] [Google Scholar]
- Sonnhammer EL, Koonin EV. Orthology, paralogy and proposed classification for paralog subtypes. Trends Genet. 2002;18:619–620. doi: 10.1016/s0168-9525(02)02793-2. [DOI] [PubMed] [Google Scholar]
- Storm CE, Sonnhammer EL. Automated ortholog inference from phylogenetic trees and calculation of orthology reliability. Bioinformatics. 2002;18:92–99. doi: 10.1093/bioinformatics/18.1.92. [DOI] [PubMed] [Google Scholar]
- Tatusov RL, et al. A genomic perspective on protein families. Science. 1997;278:631–637. doi: 10.1126/science.278.5338.631. [DOI] [PubMed] [Google Scholar]
- Tatusov RL, et al. The COG database: a tool for genome-scale analysis of protein functions and evolution. Nucleic Acids Res. 2000;28:33–36. doi: 10.1093/nar/28.1.33. [DOI] [PMC free article] [PubMed] [Google Scholar]
- Tatusov RL, et al. The COG database: an updated version includes eukaryotes. BMC Bioinformatics. 2003;4:41. doi: 10.1186/1471-2105-4-41. [DOI] [PMC free article] [PubMed] [Google Scholar]
- Wolf YI, et al. Evolution of aminoacyl-tRNA synthetases–analysis of unique domain architectures and phylogenetic trees reveals a complex history of horizontal gene transfer events. Genome Res. 1999;9:689–710. [PubMed] [Google Scholar]
- Yu H, et al. Annotation transfer between genomes: protein–protein interologs and protein-DNA regulogs. Genome Res. 2004;14:1107–1118. doi: 10.1101/gr.1774904. [DOI] [PMC free article] [PubMed] [Google Scholar]
- Yuan YP, et al. Towards detection of orthologues in sequence databases. Bioinformatics. 1998;14:285–289. doi: 10.1093/bioinformatics/14.3.285. [DOI] [PubMed] [Google Scholar]
- Zmasek CM, Eddy SR. A simple algorithm to infer gene duplication and speciation events on a gene tree. Bioinformatics. 2001;17:821–828. doi: 10.1093/bioinformatics/17.9.821. [DOI] [PubMed] [Google Scholar]
- Zmasek CM, Eddy SR. RIO: analyzing proteomes by automated phylogenomics using resampled inference of orthologs. BMC Bioinformatics. 2002;3:14. doi: 10.1186/1471-2105-3-14. [DOI] [PMC free article] [PubMed] [Google Scholar]
Associated Data
This section collects any data citations, data availability statements, or supplementary materials included in this article.