Abstract
How DNA glycosylases search through millions of base pairs and discriminate between rare sites of damage and otherwise undamaged bases is poorly understood. Even less understood are the details of the structural states arising from DNA glycosylases interacting with undamaged DNA. Recognizing the mutagenic lesion 7,8-dihydro-8-oxoguanine (8-oxoguanine, oxoG) represents an especially formidable challenge, because this oxidized nucleobase differs by only two atoms from its normal counterpart, guanine (G), and buried in the structure of naked B-form DNA, oxoG and G are practically indistinguishable from each other. We have used disulfide cross-linking technology to capture a human oxoG repair protein, 8-oxoguanine DNA glycosylase I (hOGG1) sampling an undamaged G:C base pair located adjacent to an oxoG:C base pair in DNA. The x-ray structure of the trapped complex reveals that the presence of the 8-oxoG drastically changes the local conformation of the extruded G. The extruded but intrahelical state of the G in this structure offers a view of an early intermediate in the base-extrusion pathway.
Keywords: 8-oxoguanine, base-excision repair, disulfide trapping, base-extrusion pathway
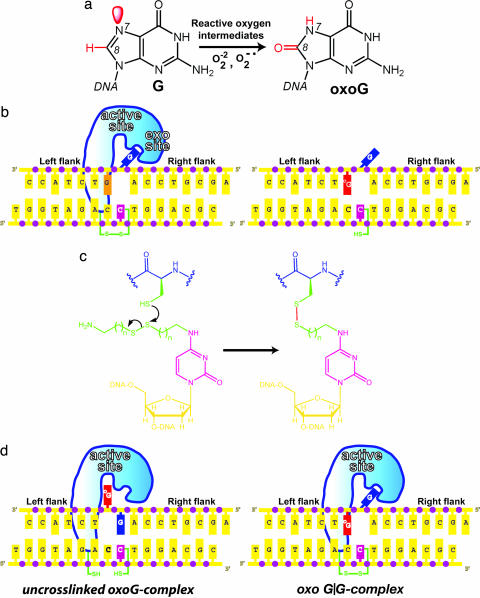
Aberrant nucleobases in DNA pose a persistent threat to the genomic integrity of all living organisms (1). Among the most pernicious and extensively studied of such lesions is 8-oxoguanine (oxoG), which arises through the attack of reactive oxygen intermediates on guanine (Fig. 1a) (2, 3). OxoG preferentially mispairs with adenine during replicative DNA polymerization (4), ultimately giving rise to a G:C to T:A transversion mutation. The mutagenic burden imposed by spontaneous guanine oxidation is diminished by the existence of a base-excision DNA repair (BER) process evolved to eradicate oxoG lesions from DNA and restore the original guanine residues (5, 6). This process is initiated by DNA glycosylase enzymes that target oxoG lesions for removal through a multistep excision reaction cascade; the resulting mangled product is subsequently removed from DNA and the original sequence restored by general downstream components of the BER pathway. OxoG glycosylases routinely surmount one of the most formidable needle-in-the-haystack problems in biology, that of locating a single oxoG base embedded on average in 107 bases of normal DNA before replication unveils the mutagenic potential of the lesion (7, 8). This problem is made all the more vexing by the fact that oxoG forms normal Watson–Crick base pairs with C, that the presence of the lesion has little effect on the double-helical structure or thermodynamic stability of duplex DNA (9, 10), and that oxoG glycosylases make no use of biochemical energy to propel them along DNA while searching for damage.
Fig. 1.
Schematic overview of the DXL experimental strategy. (a) Oxidation of G to oxoG. Red denotes the differences in structure between the two. (b) The left-hand schematic illustrates the G complex, with the extrahelical target G (blue) in the hOGG1 exo-site flanking the active site. Replacement of the G (orange) neighboring the target G with oxoG (red) gives the sequence on the right, which was used in this study. (c) Disulfide cross-linking chemistry. (d) Two possible DNA-bound structures formed between N149ChOGG1 and the DNA used in this study. See the text for details.
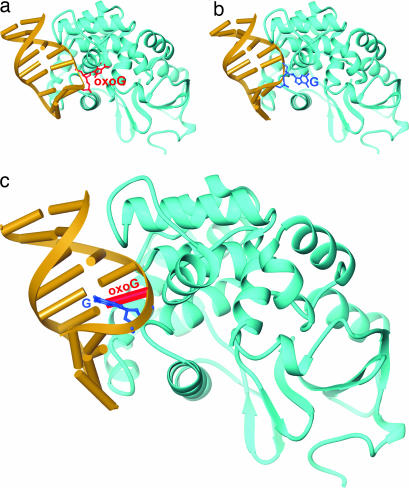
OxoG DNA glycosylases exist in two varieties, Ogg1 in eukaryotes (hOGG1 in humans) and MutM (also known as Fpg) in bacteria. Although Ogg1 and MutM perform very similar biochemical functions, they do so using completely different three-dimensional structures (11–13). The general features of lesion recognition and catalysis in both systems have been extensively studied and therefore are reasonably well understood (6, 14, 15). Numerous structures of hOGG1 in complex with substrate DNA at various stages of the excision repair cascade have provided a comprehensive picture of oxoG recognition and removal (11, 16–19). Of particular note, the lesion-recognition complex (LRC) formed between an oxoG-containing duplex and a catalytically disabled mutant of hOGG1 (K249Q hOGG1) revealed that hOGG1 drastically remodels the DNA substrate, sharply bending the duplex and inserting into it three amino acid side chains, while extruding the entire oxoG nucleoside moiety from the duplex stack to adopt an extrahelical disposition (Fig. 2a) (11). The extrahelical oxoG is inserted deeply into an active site pocket on the enzyme lined with residues that recognize the lesion nucleobase specifically and perform catalysis on its sugar moiety. In a recent study, we used intermolecular disulfide cross-linking (DXL) technology to stabilize a complex in which the normal base G, in place of the substrate oxoG, was presented to the active site pocket of hOGG1 (20). In this complex, the target G nucleoside was swiveled out from the DNA helix much as with oxoG, except the normal base was denied insertion into the oxoG-recognition pocket and remained at an exo-site (20) on the periphery of the active site (Fig. 2b). Consistent with this rejection of G by the active site, the disulfide cross-linked complex presenting G to the active site (G complex) failed to undergo any detectable base-excision, even though cross-linking per se does not prevent catalysis.
Fig. 2.
Overall structures of hOGG1–DNA complexes. In each structure, hOGG1 is represented as a blue ribbon trace and the bound DNA as a yellow ribbon-and-cylinders drawing. The target base in each is shown in a framework model, and its identity is denoted. (a) oxoG lesion-recognition complex (LRC) (11). (b) G complex (20). (c) oxoG|G complex.
With the structure of the G complex in hand, we were curious to know whether the introduction of an oxoG:C base pair neighboring the target base pair would affect the overall structure of the protein–DNA interface. Here we report the use of DXL to entrap such a complex and crystallize it. The x-ray structure of this oxoG-neighbored G complex reveals that the target G, although extruded from the helical stack, is not strictly extrahelical because it folds back into the major groove and forms a lesion-specific hydrogen bond with oxoG. The structure demonstrates that hOGG1 can detect the presence of a neighboring oxoG even when not interrogating it directly. Moreover, the structure provides a view of the earliest extrahelical intermediate yet observed in the base extrusion pathway.
Results
Experimental Strategy.
Trapping an oxoG-neighbored G complex (oxoG|G complex) appeared difficult if not impossible at the outset. HOGG1 binds oxoG-containing DNA several orders of magnitude more strongly than non-lesion-containing DNA, owing in large part to the stabilization provided by interactions between the active site pocket and the extrahelical oxoG. Thus, any attempt to capture hOGG1 presenting a normal nucleobase to the active site would have to overcome the formidable thermodynamic preference of the protein to present the oxoG right next door in the same DNA molecule. Furthermore, in the likely event that the cross-linking reaction did not proceed to completion, the resulting product would contain two protein DNA complexes, the uncross-linked LRC and the cross-linked oxoG|G complex (Fig. 1d). Such a mixture could not be expected to produce informative structural results, and the feasibility of separating them was far from certain. To test the cross-linking efficiency, we incubated a hOGG1 mutant engineered for DXL, N149C hOGG1 (20), with duplex DNA containing an activated two-carbon thiol tether at the C opposite the target G, and containing an oxoG on the immediate 3′ side of the target G (Fig. 1 c and d). Unexpectedly, nonreducing SDS/PAGE and anion exchange (mono-Q) chromatographic analyses of the reaction mixture after 24 h revealed that ≈75% of the input DNA, the limiting reagent, had undergone cross-linking to N149C hOGG1 (data not shown). The N149C mutant of hOGG1 retains much of the catalytic activity of the wild-type protein (Fig. 6 and Supporting Text, which are published as supporting information on the PNAS web site); therefore, we performed the cross-linking reactions at 4°C, at which temperature we have found the catalytic activity of hOGG1 to be drastically reduced relative to 25°C. Fortunately, we discovered that the un-cross-linked LRC dissociates during anion-exchange chromatography, whereas the covalently cross-linked oxoG|G complex remains intact; by taking advantage of this observation, we were able to obtain homogenous samples of the oxoG|G complex in sufficient quantity for crystallization.
Structure of the oxoG|G Complex.
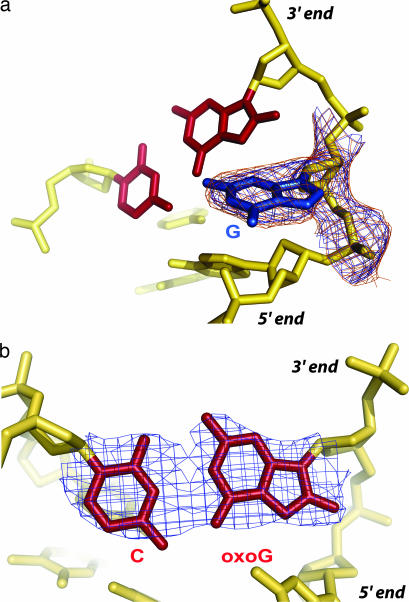
Crystals of the oxoG|G complex were obtained under similar conditions to those used for the G complex (20), and the structure was solved to 2.6 Å resolution starting with the phases from the fully refined G complex (20). The overall architecture of the oxoG|G complex is very similar to that of the LRC and G complex, with a sharply bent duplex harboring several invading residues from the protein (Fig. 2c). The target base G in the complex is clearly extruded from the duplex, and the oxoG:C base pair bordering the locus of helix invasion is unambiguously intact (Fig. 3 a and b). Despite the high degree of similarity between the G complex (Fig. 2b) and the oxoG|G complex (Fig. 2c), close examination of the protein–DNA interface reveals one important point of divergence. Whereas the extrahelical target G nucleoside is fully disengaged from the rest of the DNA surface in the G complex, enabling it to occupy an exo-site flanking the lesion-recognition pocket, the target G in the oxoG|G complex is unpaired from its C partner and is extruded from the helical stack, but it is not bound in the exo-site and indeed is not even fully extrahelical. The target G in the oxoG|G complex is folded into the major groove and actually forms a noncanonical base pair with the major groove face of the neighboring, intrahelical oxoG (Figs. 2, 3, and 4c); the C:oxoG:G pairing interaction is, to our knowledge, the first instance of a base-triple in duplex DNA, although such pairing is widely observed in RNA and has also been observed in single stranded DNA (21).
Fig. 3.
Electron density at the site of the target G and the neighboring oxoG:C base pair. The oxoG:C base pair is colored in maroon and the extruded G is colored in blue. Shown are σA weighted (27) 2Fo − Fc maps for particular elements in the DNA. (a) Target G; map contoured at 1σ (blue) and 0.8σ (orange). (b) Neighboring oxoG:C base pair; map contoured at 1.5σ. In b, the oxoG appears to adopt a 2′-endo sugar pucker with a C2′-O8 distance of 3.1 Å. The 5′ and the 3′ directions of the oxoG-containing strand are indicated.
Fig. 4.
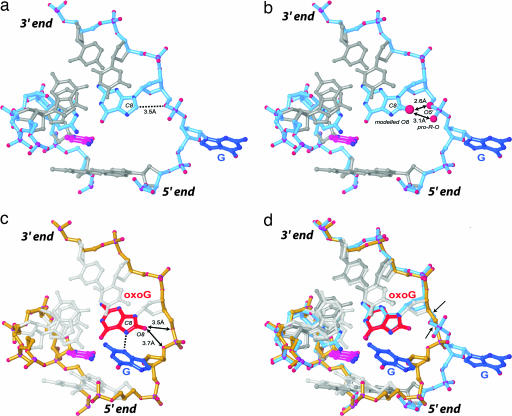
Close-up views of the DNA conformation in hOGG1-DNA complexes. Shown are framework models of the DNA, with the G complex having a blue backbone and the oxoG|G complex a yellow backbone. The target G in blue, its Watson–Crick pairing partner in magenta, and the neighboring oxoG in red. (a) The G complex. (b) Model constructed by addition of an 8-carbonyl onto the G residue 3′-neighboring the target G. Note the short distance between O8 and its own O5′ and pro-R-O, indicative of a steric clash between O8 and O5′, and a repulsive electrostatic interaction between the O8 and pro-R-O. (c) oxoG|G complex, with arrows denoting the distance between O8 and the nearest two backbone atoms. (d) Superposition of the G complex and the oxoG|G complex. Arrows in d denote the two bonds that undergo the largest rotation to convert from one DNA conformation to the other. The 5′ and the 3′ directions of the oxoG-containing strand are indicated.
Factors Driving Structural Remodeling by a Neighboring oxoG.
The G complex and oxoG|G complex differ only by whether they have G or oxoG at the nucleobase 3′-to the target G. How can a difference of two atoms, that being the difference between G and oxoG, in a complex made up of several thousand atoms have such a profound conformational effect? The structure provides a clear answer to this question. In the G complex, the phosphodiester between the target G and its 3′-neighbor G has two of its oxygen atoms (O5′ and the pro-R nonbridging phosphate oxygen) pointed inward toward the C8-position of the neighbor G, such that the two are in rather close contact (Fig. 4a). Modeling of a C8 carbonyl into this structure reveals that the change in substituent from a small electropositive H atom to a larger, electronegative O atom at C8 would introduce a severely repulsive steric and electronic interaction with the nearby phosphate (Fig. 4b). Consequently, the backbone conformation observed in the G complex is essentially precluded from existence in the oxoG|G complex, so the backbone adopts an alternative conformation that avoids the clash (Fig. 4c); the adjustment consists of large rotations about two bonds in the neighbor residue, C4′–C5′ and O5′–P (Fig. 4d). Apparently, this alternative backbone conformation disfavors presentation of the target base to the exo-site and favors the folded-in conformation observed in the oxoG|G complex. An additional driving force for the alternative conformation may be the stabilizing H-bond between N3 of the target and N7-H of oxoG, in which case both atoms of oxoG that differ from G would play some direct role in producing the extruded but non-extrahelical conformation. Of course, reannealing of the target G is precluded by the presence of the disulfide cross-link to the partner C; it has been established that the cross-link does not otherwise perturb the structure of the extrahelical state (20).
Interestingly, the nucleobase/phosphate interaction that underlies the conformational difference between the G complex and oxoG|G complex is absent in naked DNA, and only comes into play as a result of the coercive remodeling of DNA structure by hOGG1 in these complexes. We have recently established that MutM also manipulates DNA structure in a way that specifically accentuates the difference between a nonextruded, intrahelical G versus oxoG (A.B., S. Jiralerspong, and G.L.V., unpublished results). This imposition on DNA of an oxoG-specific conformational test is not unique to DNA glycosylases; Beese and coworkers have made similar observations for a DNA polymerase (22).
Protein–DNA Interactions.
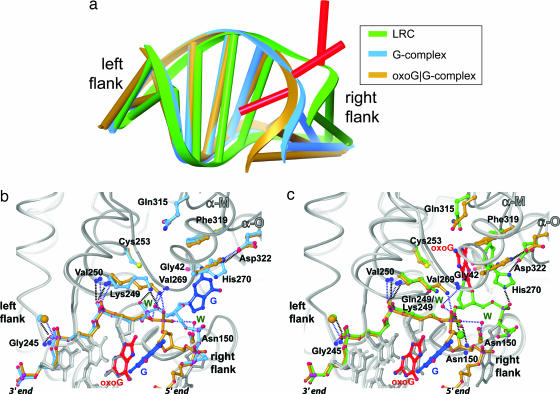
Our prior analysis of the extruded, extrahelical oxoG lesion recognition complex and G complex led to the interesting observation that the positioning of the DNA backbone with respect to hOGG1 is nearly identical on the 3′ side of the extruded nucleoside (Fig. 5a, “left flank”), but is markedly different on the right flank (20). Furthermore, all of the backbone contacts in these two complexes on the left flank are conserved, whereas the one phosphate contact on the right flank in the LRC (between His-270 and the phosphate attached to the 5′-O of the target nucleoside) is dislodged in the G complex. A similar comparison between the oxoG|G complex and the extrahelical complexes (Fig. 5) reveals that, once again, contacts between the protein and the DNA backbone on the left flank (Gly-245, Val-250, Lys-249 backbone amide) are virtually identical. However, on the right flank, the conformation of the DNA in the oxoG|G complex differs considerably from both the G complex and the LRC, with the former having an even more bent and overtwisted duplex than the other two. What is striking is that the protein components of the G complex and the oxoG|G complex are nearly identical, despite their differences in DNA conformation on the right flank (Fig. 5b). Of particular note, His-270 is also disengaged from the 5′ phosphate of the target G in the oxoG|G complex. The several points of difference in the protein–DNA interface of these two structures involve minor adjustments of contacts to backbone at the extruded target G: (i) in both, Lys-249 contacts the phosphate on the 3′-side of the target G, but the precise phosphate oxygen atoms being contacted differs; (ii) the backbone amide NH of Val-269 makes no DNA contact in the G complex, but makes a water-mediated contact to the 3′ phosphate of the target G in the oxoG|G complex. We also note with special interest that two ordered waters that contact the 3′ phosphate of the target G in the oxoG|G complex are shed in the G complex (Fig. 5b). The overall similarity of these two complexes suggests a straightforward pathway for conversion from one to the other.
Fig. 5.
Structural changes along the base-extrusion pathway of hOGG1. (a) Global changes in DNA structure. These figures were created by superposition of the protein component only of the LRC, G complex, and oxoG|G complex. The protein is not displayed, but the DNA bound to it is, with the color scheme as shown in the Inset. Note that the differences in conformation are limited to the target nucleoside (red) and right flank. (b and c) Protein-only superpositions of the protein–DNA interfaces, illustrating the similarities and differences in the interfaces. Contacts are denoted with hashed lines; blue for the oxoG|G complex and black for the LRC or the G complex; blue spheres, backbone amide NH atoms; W, ordered waters; oversized spheres, Ca2+ ions. (b) oxoG|G complex versus G complex. (c) oxoG|G complex versus LRC.
The side chain imidazole is engaged in a hydrogen-bonding interaction with the side chain carboxylate of Asp-322 (Figs. 5 b and c). Not previously noted is the fact that the His-270–Asp-322 interaction physically connects two α-helices, α-O and α-M, that directly contribute residues to the hOGG1 active site. These two helices undergo a substantial positional shift upon insertion of a lesion nucleobase into the active site, in particular drawing Phe-319 inward toward the lesion-recognition pocket, where it directly π-stacks with the aromatic face of the oxoG nucleobase (Fig. 5c). We speculate that the His-270–Asp-322 interaction serves the purpose of keeping the active site open to facilitate insertion of the lesion nucleobase; during or after this insertion, His-270 forms a hydrogen bond with the 5′ phosphate of the lesion and draws α-O inward, closing down the active site.
Discussion
Taking into consideration the drastic nature of the DNA structural remodeling performed by hOGG1 and other DNA glycosylases, we have suggested that the energy landscape of the base-extrusion pathway is likely to be complex and characterized by the formation of multiple quasistable intermediates (20), much like the folding pathway of a polypeptide chain or the progression of a complex allosteric transition in a protein. In this regard, it is reasonable to consider the hOGG1-bound complexes bearing an extruded G as analogous, but not necessarily identical, to intermediates along the extrusion pathway followed by an oxoG lesion targeted by hOGG1. The G complex would thus be analogous to a late intermediate in the base-extrusion pathway, in which the nucleobase has been extruded and rests on the periphery of the active site, but has not yet undergone the final step of insertion into the active site pocket. The oxoG|G complex would correspondingly be viewed as analogous to an early intermediate in the base-extrusion pathway, in which the target base has been extruded from the helical stack but not yet allowed to fully escape the major groove and extend toward the active site pocket. Consistent with this notion is the fact that the target nucleobase in the oxoG|G complex is extruded into the major groove space, much the same as has been proposed for oxoG extrusion (20). Furthermore, the backbone conformation at the site of the target nucleoside in the oxoG|G complex is considerably closer to that of B-form DNA than in either of the extrahelical structures. The particular structural features of the oxoG|G complex, namely hydrogen bonding between the extruded G and intrahelical oxoG, and the repulsive interaction between the oxoG carbonyl and its 3′ phosphate, confer thermodynamic stability on an intermediate conformational state that might ordinarily exist only fleetingly when hOGG1 is promoting extrusion of oxoG or even a normal base from DNA. Finally, we note that ordered waters are shed from the protein–DNA interface upon transitioning from the oxoG|G complex to the G complex (refer to Fig. 5b), and such desolvation during progression along the lesion-extrusion pathway has been observed in the case of MutM (23). It is worth noting that the incremental decrease in DNA bending and twisting in going from the oxoG|G complex to the G complex to the LRC (Fig. 5a) is consistent with a proposed model in which relief of strain can provide the driving force for drastic rearrangements in DNA structure that are required for catalysis (16).
Taken together, these considerations suggest that the overall DNA conformation and protein–DNA interface seen in the oxoG|G complex are probably representative of an early postextrusion intermediate in the base-extrusion pathway, in which base-pairing of the lesion nucleobase to its complementary C has been disrupted, but the extruded oxoG has not yet fully escaped the confines of the major groove space. As illustrated in Fig. 5b, the transition from an early to late intermediate to the final lesion-recognition complex occurs within a structural framework in which many conserved interactions are retained throughout, and only modest rearrangements of contacts at the protein–DNA interface are required to bring about a dramatic change in DNA conformation. On the other hand, the final step of inserting the nucleobase into the lesion-recognition pocket involves a slight change in DNA conformation but a more substantial local alteration of protein conformation, but importantly, again within the same conserved structural framework (20). The elegance and simplicity of this extrusion pathway attests to the powerful evolutionary driving force to avoid acquisition of mutations by performing efficient repair of damaged DNA.
Materials and Methods
hOGG1 Preparation.
A PCR fragment of hOGG1 containing amino acids 12–327 of the human Ogg1 gene was cloned into the pET30a vector (Novagen, Madison, WI) using the restriction sites EcoRI and HindIII. Mutagenesis was performed by using the megaprimer mutagenesis method, and all new constructs were sequenced throughout the hOGG1-coding sequence. Expression and purification of the wild-type and N149C hOGG1 were done as described (18).
DNA Preparation, Disulfide Cross-linking, and Crystallization.
DNA oligomers 5′-AGCGTCCAGXTCTACC-3′, where X denotes 8-oxoG, and 5′-AGCGTCCAGGTCTACC-3′ were synthesized on an ABI 392 DNA synthesizer using standard reagents. A DNA oligomer 5′-TGGTAGACCTGGACGC-3′, where the underlined position indicates the site of modification with a disulfide tether (see Fig. 1c for structure of modified nucleoside and cross-linking strategy), was synthesized and functionalized as described (24). Phosphoramidite derivatives of oxoG and O4-Triazolyl-U were purchased from Glen Research (Sterling, VA). DNA was purified by urea-PAGE, dissolved in 1× TE buffer, and annealed at 250 μM concentration. The protein–DNA complex was formed by mixing the duplex DNA with hOGG1 in a 2-fold molar excess of the protein. Preparation, purification, and crystallization of cross-linked complex were done as described (20). Crystals were transferred to a cryoprotectant containing 100 mM sodium cacodylate (pH 6.0), 150 mM CaCl2, 17% PEG 8000, and 25% glycerol and then frozen in liquid nitrogen for data collection.
Data Collection and Structure Solution.
Data were collected at National Synchrotron Light Source X29, and processed by using HKL2000 (25). Data collection statistics are summarized in Table 1. The coordinates of the protein from the structure of N149C hOGG1 bound to G-containing DNA (20) was used as the initial search model in refinement using CNS (26). The catalytic residues and residues involved in protein–DNA interaction were omitted from the initial search model. A rigid body fit followed by energy minimization and simulated annealing performed in CNS resulted in a partial model. Electron density for the DNA and the omitted residues became clearly visible in a σA-weighted (27) Fo-Fc map at this stage. The model was subsequently improved by iterative rounds of energy minimization, simulated annealing and grouped B factor refinement in CNS and model building in Quanta (Accelrys, San Diego, CA) while monitoring Rfree (28). Simulated-annealing omit maps were frequently used to reduce model bias. Once the model was nearly complete, individual B-factor refinement was included. Water molecules were added to the model by using both automated methods (in CNS) and manual inspection of difference maps. Amino acid side chains of some surface residues were truncated at the α-, β-, γ-, or δ-carbon position if electron density was not visible for the other atoms. The final model consists of amino acid residues 12–325 (residues 80–82 in a disordered loop were omitted from the model) plus three ordered N-terminal residues from the expression vector. The model contains 22 nucleotides of DNA, 1.5 calcium ions, 1 glycerol molecule, and 51 water molecules. The differences in electron density on the right flank for the oxoG complex versus G complex presumably results from their differences in the helical conformation of that region, which is packed end-to-end with a neighboring DNA duplex in the crystal. Refinement and model statistics are presented in Table 1. A total of 86.7% of the protein residues fall in the most favored region of the Ramachandran map, 12.2% in additionally allowed region, and 1.1.% in generously allowed region. Renderings of the x-ray structures were prepared by using Ribbons (29) and PyMOL (http://pymol.sourceforge.net).
Table 1.
Data collection and refinement statistics
| oxoG|G complex | |
|---|---|
| Data collection | |
| Space group | P6522 |
| Cell dimensions | |
| a, b, c, Å | 91.52, 91.52, 211.84 |
| α, β, γ, ° | 90, 90, 120 |
| Resolution, Å | 50-2.6 |
| Rsym or Rmerge | 0.128 (0.446) |
| I/σI | 19.2 (2.7) |
| Completeness, % | 98.6 (88.7) |
| Redundancy | 7.8 (4.8) |
| Refinement | |
| Resolution, Å | 50-2.6 |
| No. reflections | 15478 |
| Rwork/Rfree, % | 22.6/26.6 |
| No. atoms | |
| Protein | 2429 |
| Ligand/ion | 560 |
| Water | 51 |
| B-factors | |
| Protein | 48.1 |
| Ligand/ion | 66.4 |
| Water | 40 |
| rms deviations | |
| Bond lengths, Å | 0.005 |
| Bond angles, ° | 1.2 |
| Ramachandran plot, %† | |
| Most favored region | 86.7 |
| Additionally allowed region | 12.1 |
| Generously allowed region | 1.1 |
*Highest resolution shell is shown in parenthesis.
†Calculated by using PROCHECK (30).
Supplementary Material
Acknowledgments
We acknowledge the entire staff at the X29 beam line of National Synchrotron Light Source, especially Howard Robinson, for expert assistance in data collection and processing. This work was supported by National Institutes of Health Grant GM044853.
Abbreviations
- oxoG
8-oxoguanine
- LRC
lesion-recognition complex
- DXL
disulfide cross-linking
Footnotes
This paper was submitted directly (Track II) to the PNAS office.
Data deposition: The atomic coordinates have been deposited in the Protein Data Bank, www.pdb.org (PDB ID code 2I5W).
References
- 1.Lindahl T. Nature. 1993;362:709–715. doi: 10.1038/362709a0. [DOI] [PubMed] [Google Scholar]
- 2.Michaels ML, Miller JH. J Bacteriol. 1992;174:6321–6325. doi: 10.1128/jb.174.20.6321-6325.1992. [DOI] [PMC free article] [PubMed] [Google Scholar]
- 3.Grollman AP, Moriya M. Trends Genet. 1993;9:246–249. doi: 10.1016/0168-9525(93)90089-z. [DOI] [PubMed] [Google Scholar]
- 4.Shibutani S, Takeshita M, Grollman AP. Nature. 1991;349:431–434. doi: 10.1038/349431a0. [DOI] [PubMed] [Google Scholar]
- 5.Barnes DE, Lindahl T. Annu Rev Genet. 2004;38:445–476. doi: 10.1146/annurev.genet.38.072902.092448. [DOI] [PubMed] [Google Scholar]
- 6.Fromme JC, Verdine GL. Adv Protein Chem. 2004;69:1–41. doi: 10.1016/S0065-3233(04)69001-2. [DOI] [PubMed] [Google Scholar]
- 7.Verdine GL, Bruner SD. Chem Biol. 1997;4:329–334. doi: 10.1016/s1074-5521(97)90123-x. [DOI] [PubMed] [Google Scholar]
- 8.Zharkov DO, Grollman AP. Mutat Res. 2005;577:24–54. doi: 10.1016/j.mrfmmm.2005.03.011. [DOI] [PubMed] [Google Scholar]
- 9.Lipscomb LA, Peek ME, Morningstar ML, Verghis SM, Miller EM, Rich A, Essigmann JM, Williams LD. Proc Natl Acad Sci USA. 1995;92:719–723. doi: 10.1073/pnas.92.3.719. [DOI] [PMC free article] [PubMed] [Google Scholar]
- 10.Oda Y, Uesugi S, Ikehara M, Nishimura S, Kawase Y, Ishikawa H, Inoue H, Ohtsuka E. Nucleic Acids Res. 1991;19:1407–1412. doi: 10.1093/nar/19.7.1407. [DOI] [PMC free article] [PubMed] [Google Scholar]
- 11.Bruner SD, Norman DP, Verdine GL. Nature. 2000;403:859–866. doi: 10.1038/35002510. [DOI] [PubMed] [Google Scholar]
- 12.Coste F, Ober M, Carell T, Boiteux S, Zelwer C, Castaing B. J Biol Chem. 2004;279:44074–44083. doi: 10.1074/jbc.M405928200. [DOI] [PubMed] [Google Scholar]
- 13.Fromme JC, Verdine GL. J Biol Chem. 2003;278:51543–51548. doi: 10.1074/jbc.M307768200. [DOI] [PubMed] [Google Scholar]
- 14.Nash HM, Lu R, Lane WS, Verdine GL. Chem Biol. 1997;4:693–702. doi: 10.1016/s1074-5521(97)90225-8. [DOI] [PubMed] [Google Scholar]
- 15.Tchou J, Grollman AP. J Biol Chem. 1995;270:11671–11677. doi: 10.1074/jbc.270.19.11671. [DOI] [PubMed] [Google Scholar]
- 16.Chung SJ, Verdine GL. Chem Biol. 2004;11:1643–1649. doi: 10.1016/j.chembiol.2004.09.014. [DOI] [PubMed] [Google Scholar]
- 17.Fromme JC, Bruner SD, Yang W, Karplus M, Verdine GL. Nat Struct Biol. 2003;10:204–211. doi: 10.1038/nsb902. [DOI] [PubMed] [Google Scholar]
- 18.Norman DP, Chung SJ, Verdine GL. Biochemistry. 2003;42:1564–1572. doi: 10.1021/bi026823d. [DOI] [PubMed] [Google Scholar]
- 19.Norman DPG, Bruner SD, Verdine GL. J Am Chem Soc. 2001;123:359–360. doi: 10.1021/ja003144m. [DOI] [PubMed] [Google Scholar]
- 20.Banerjee A, Yang W, Karplus M, Verdine GL. Nature. 2005;434:612–618. doi: 10.1038/nature03458. [DOI] [PubMed] [Google Scholar]
- 21.Lei M, Podell ER, Baumann P, Cech TR. Nature. 2003;426:198–203. doi: 10.1038/nature02092. [DOI] [PubMed] [Google Scholar]
- 22.Hsu GW, Ober M, Carell T, Beese LS. Nature. 2004;431:217–221. doi: 10.1038/nature02908. [DOI] [PubMed] [Google Scholar]
- 23.Banerjee A, Santos WL, Verdine GL. Science. 2006;311:1153–1157. doi: 10.1126/science.1120288. [DOI] [PubMed] [Google Scholar]
- 24.MacMillan AM, Verdine GL. Tetrahedron. 1991;47:2603–2616. [Google Scholar]
- 25.Otwinowski Z, Minor W. Methods Enzymol. 1997;276:307–326. doi: 10.1016/S0076-6879(97)76066-X. [DOI] [PubMed] [Google Scholar]
- 26.Brunger AT, Adams PD, Clore GM, DeLano WL, Gros P, Grosse-Kunstleve RW, Jiang JS, Kuszewski J, Nilges M, Pannu NS, et al. Acta Crystallogr D. 1998;54:905–921. doi: 10.1107/s0907444998003254. [DOI] [PubMed] [Google Scholar]
- 27.Read RJ. Acta Crystallogr A. 1986;42:104–149. doi: 10.1107/s0108767391008024. [DOI] [PubMed] [Google Scholar]
- 28.Brunger A. Acta Crystallogr D. 1993;49:24–36. doi: 10.1107/S0907444992007352. [DOI] [PubMed] [Google Scholar]
- 29.Carson MJ. J Appl Crystallogr. 1991;24:379–384. [Google Scholar]
- 30.Laskowski RJ, Macarthur MW, Moss DS, Thorton JM. J Appl Crystallogr. 1993;26:283–290. [Google Scholar]
Associated Data
This section collects any data citations, data availability statements, or supplementary materials included in this article.


