Abstract
Macula densa (MD) cells express COX-2 and COX-2–derived PGs appear to signal the release of renin from the renal juxtaglomerular apparatus, especially during volume depletion. However, the synthetic machinery and identity of the specific prostanoid released from intact MD cells remains uncertain. In the present studies, a novel biosensor tool was engineered to directly determine whether MD cells release PGE2 in response to low luminal NaCl concentration ([NaCl]L). HEK293 cells were transfected with the Ca2+-coupled E-prostanoid receptor EP1 (HEK/EP1) and loaded with fura-2. HEK/EP1 cells produced a significant elevation in intracellular [Ca2+] ([Ca2+]i) by 29.6 ± 12.8 nM (n = 6) when positioned at the basolateral surface of isolated perfused MD cells and [NaCl]L was reduced from 150 mM to zero. HEK/EP1 [Ca2+]i responses were observed mainly in preparations from rabbits on a low-salt diet and were completely inhibited by either a selective COX-2 inhibitor or an EP1 antagonist, and also by 100 μM luminal furosemide. Also, 20-mM graduated reductions in [NaCl]L between 80 and 0 mM caused step-by-step increases in HEK/EP1 [Ca2+]i. Low-salt diet greatly increased the expression of both COX-2 and microsome-associated PGE synthase (mPGES) in the MD. These studies provide the first direct evidence that intact MD cells synthesize and release PGE2 during reduced luminal salt content and suggest that this response is important in the control of renin release and renal vascular resistance during salt deprivation.
Introduction
PGE2 is a major product of PGH2 derived from COX metabolism and is an important paracrine regulator of salt and water homeostasis in the kidney. In the renal cortex, COX-1 expression predominates in collecting duct, vascular tissue, and glomerular mesangial cells (1). In contrast, COX-2 is expressed and presumably mediates PG production in the macula densa (MD) and surrounding cortical thick ascending limb (cTAL) cells (2–5). MD cells are in direct contact with the vascular pole of the same glomerulus from which the filtrate originates. These cells sense changes in tubular [NaCl] and send signals that control preglomerular vascular resistance and glomerular filtration rate in a process known as tubuloglomerular feedback. MD cells also control the release of renin from juxtaglomerular granular cells (3–6). COX-2–derived PGs may participate in MD-mediated control of juxtaglomerular function, particularly in high renin states such as low salt intake, loop diuretic treatment, and renovascular hypertension (4, 7). In particular, PGE2 produced by MD cells has been suggested as the mediator of renin release induced by low luminal [NaCl] ([NaCl]L) (3–10). In addition, PGE2, as a potent vasodilator, may also modulate preglomerular vascular resistance (11–13) and tubuloglomerular feedback (14).
Although COX activity has been considered the key step in PG synthesis, metabolism of arachidonate by either COX-1 or COX-2 yields only the unstable intermediary PGH2 (1). The subsequent fate of PGH2 is dictated by coexpression of a PG synthase, which is the other key enzyme of PG synthesis. This enzyme is capable of converting PGH2 to one of the prostanoid end products including PGE2, PGF2a, PGD2, PGI2, and thromboxane A2 (11). Because of the limited number and inaccessibility of MD cells, as opposed to other nephron segments in the kidney (15), direct evidence for the expression of a PGE synthase in the MD and release of PGE2 from intact MD cells is lacking. Investigating PGE2 release from MD cells is important since a recent work actually questioned whether MD cells are equipped with PGE2 synthetic machinery in the normal kidney (16).
The present studies used a cloned PG receptor (E-prostanoid receptor-1, or EP1) to engineer a novel biosensor tool that could be used to detect local PGE2 production. PGE2 interacts with four different G protein–coupled E-prostanoid receptors designated EP1, EP2, EP3, and EP4 (11, 12). EP2, EP3, and EP4 couple to adenylyl cyclase–associated G proteins to increase or decrease cAMP generation. In contrast, EP1 is coupled to a Ca2+-signaling mechanism that is thought to involve inositol 1,4,5-triphosphate and diacylglycerol formation (11, 12). Therefore, EP1-mediated effects of PGE2 can be detected using fluorescence microscopy and a biosensor cell expressing EP1 and loaded with a calcium fluorophore. The present studies were undertaken to determine, for the first time, whether the enzymatic machinery necessary for PGE2 synthesis is expressed in MD cells from rabbits on a standard or low-salt diet, and to provide direct functional evidence for the control of MD PGE2 release in response to low [NaCl]L.
Methods
Materials.
All materials were purchased from Sigma-Aldrich (St. Louis, Missouri, USA) unless otherwise stated. The COX-2 inhibitor SC58236 was generously provided by Peter Isakson and Karen Siebert, and the EP1 blocker SC51322 was provided by Ed Drower (Pharmacia Research and Development, St. Louis, Missouri, USA). These compounds were dissolved in DMSO with a final DMSO concentration of below 0.1% (vol/vol).
Salt diet.
Separate groups of New Zealand white rabbits (0.5–1.0 kg) were fed standard chow (8630, 0.3% sodium) or low salt (TD 90188, 0.01% sodium; both from Harlan Teklad, Madison, Wisconsin, USA) rabbit chow for a minimum of 1 week.
Tubule perfusion.
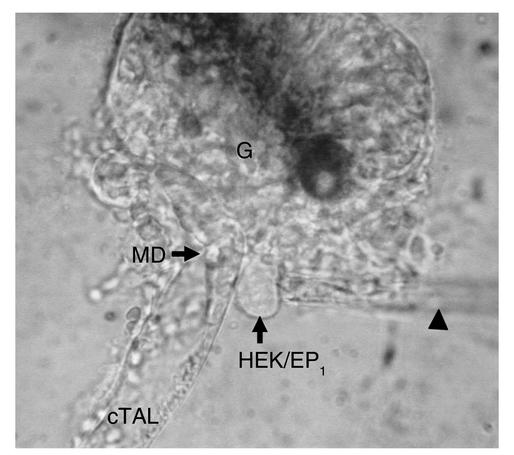
Individual cTAL’s containing the MD segment with attached glomeruli were dissected from rabbit kidneys and perfused in vitro using methods similar to those described previously (17). For these biosensor studies, the cTAL containing the MD plaque was dissected away from the glomerulus, so that the basolateral surface of MD cells was accessible from the bath (Figure 1). The dissection solution was an isosmotic, low NaCl–containing Ringer’s solution consisting of (in mM): 25 NaCl, 120 N-methyl-D-glucamine cyclamate (NMDG cyclamate), 5 KCl, 1 MgSO4, 1.6 Na2HPO4, 0.4 NaH2PO4, 1.5 CaCl2, 5 D-glucose, and 10 HEPES. Dissection was performed at 4°C. An individual cTAL was transferred to a chamber mounted on an inverted microscope. The tubule was kept in the low [NaCl] solution until it was cannulated and perfused with the same Ringer’s solution except containing approximately 150 mM NaCl and no NMDG cyclamate. The bathing solution was the same 150 mM NaCl Ringer’s solution and temperature was maintained at 37°C. When removing NaCl from the tubular perfusate, NaCl was isosmotically substituted with NMDG cyclamate, KCl with potassium gluconate, and CaCl2 with calcium gluconate to achieve an [NaCl] of 0 mM. Graduated changes in [NaCl]L between 80 and 0 mM were achieved by isosmotically substituting NaCl with NMDG cyclamate.
Figure 1.
Photomicrograph of the biosensor technique for assessing PGE2 release at the basolateral membrane of MD cells. The glomerulus (G) has been dissected away from the MD plaque. A single HEK/EP1 cell is loaded with fura-2 and held with a pipette (arrowhead) positioned at the MD basolateral membrane surface while perfusing the intact cTAL.
Engineering the PGE2 biosensor cells.
HEK293 cells were stably transfected with the full-length mouse E-prostanoid receptor EP1. EP1 is activated specifically by nanomolar concentrations of PGE2 and not by other prostanoids, and produces increases in intracellular calcium (18). HEK293 cells were transfected with a full-length mouse EP1 cDNA cloned into pcDNA3.1 using SuperFect reagent (QIAGEN Inc., Valencia, California, USA) according to the manufacturer’s instructions. Following transfection, cells were grown and maintained in media containing 400 μg/ml G418. Preliminary studies in monolayers of EP1-transfected HEK293 cells (HEK/EP1) exhibited increases in intracellular [Ca2+] ([Ca2+]i) in response to nanomolar concentrations of PGE2.
Following cannulation and perfusion of a microdissected cTAL/MD segment (Figure 1), a single fura-2–loaded HEK/EP1 cell was gently positioned at the basolateral membrane surface of the MD segment using a separate holding pipette. Based on preliminary experiments, HEK/EP1 [Ca2+]i also appears to be responsive to ATP released by MD cells via endogenous purinergic receptors (19). To exclude the effect of purinergic receptors on the biosensor cell calcium signaling, 100 μM gadolinium, which not only inhibits MD ATP release (19, 20) but also blocks P2X receptors (21), was always present in the bath.
Fluorescence microscopy.
The [Ca2+]i of HEK/EP1 biosensor cells was measured with dual excitation wavelength fluorescence microscopy (Photon Technology International, Lawrenceville, New Jersey, USA) using the fluorescent probe fura-2 (TEF LABS Inc., Austin, Texas, USA) as described previously (22). Fura-2 fluorescence was measured at an emission wavelength of 510 nm in response to excitation wavelengths of 340 and 380 nm alternated at a rate of 50 Hz by a computer-controlled chopper assembly. An adjustable photometer window was positioned over the single biosensor cell and emitted photons were detected by a Leitz photometer (Vashaw Scientific, Atlanta, Georgia, USA) that was modified for photon counting. Magnification was ×1,000 using an Olympus 100× UVFL lens. Autofluorescence-corrected ratios (340 nm/380 nm) were calculated at a rate of 5 points/s using Photon Technology International software. Biosensor cells were loaded with the dye by adding 10 μM fura-2 AM dissolved in dimethyl sulfoxide to the culture medium. Loading required approximately 60 minutes, after which fura-2 AM was removed. The 340/380 ratios were converted into [Ca2+]i values as described before (22) using the methods and equation of Grynkiewicz et al. (23).
In situ hybridization.
A 290-bp fragment of rabbit microsome-associated PGE synthase (mPGES) cDNA was obtained using RT-PCR with mPGES-selective primers based on mouse and human conserved sequences (5′-GCT GGT CAT CAA GAT GTA CG-3′ for sense; 5′-CCA GGT AGG CCA CGG TGT GT-3′ for antisense). This cDNA fragment was used to determine the expression of this isoform in MD. For in situ hybridization studies, tissues were fixed in 4% paraformaldehyde. Tissues were embedded in paraffin and 7-μm sections were cut. Prior to hybridization, sections were deparaffinized, refixed in paraformaldehyde, treated with proteinase K (20 μg/ml), washed with PBS, and treated with triethanolamine plus acetic anhydride (0.25% vol/vol). Finally sections were dehydrated in 100% ethanol. Antisense RNA was hybridized to the sections at 50–55°Cfor approximately 18 hours as described by Pelton et al. (24). Following hybridization, sections were washed at 50°C in 5× SSC plus 10 mM β-mercaptoethanol for 30 minutes. This was followed by a wash in 50% formamide, 2× SSC, and 100 mM β-mercaptoethanol for 60 minutes. Following additional washes in 10 mM Tris, 5 mM EDTA, and 500 mM NaCl, sections were treated with 10 μg/ml RNase at 37°C for 30 minutes, followed by another wash in 10 mM Tris, 5 mM EDTA, and 500 mM NaCl at 37°C. Sections were then washed twice in 2× SSC and twice in 0.1× SSC at 50°C. Slides were dehydrated with a series of graded ethanol containing 300 mM ammonium acetate. For detection of the hybridized probe, slides were dipped in photoemulsion (K5; Ilford Imaging UK Ltd., Knutsford, United Kingdom) diluted 1:1 with 2% glycerol/water and exposed for 7 days at 4°C. After development in Kodak D19 (Eastman Kodak Co. Scientific Imaging Systems, New Haven, Connecticut, USA), slides were counterstained with hematoxylin and eosin. Photomicrographs were taken using a Zeiss Axioskop (Carl Zeiss Inc., Thornwood, New York, USA) using both bright-field and dark-field optics.
Immunofluorescence.
Rabbit kidneys were perfusion-fixed with paraformaldehyde and tissue sections were processed as described earlier (17). Sections were subjected to microwave antigen retrieval before staining and were blocked for 40 minutes with PBS-Tween containing 2% BSA to lower background fluorescence. Subsequent blocking with goat anti-rabbit Fab IgG (1:100; Jackson ImmunoResearch Laboratories Inc., West Grove, Pennsylvania, USA) was carried out for 40 minutes to reduce nonspecific binding when a rabbit polyclonal antibody (anti-mPGES) was used on rabbit tissue. After subsequent washings in PBS, tissues were treated overnight with either a goat polyclonal COX-2 antibody (C-20, 1:100; Santa Cruz Biotechnology Inc., Santa Cruz, California, USA) that recognizes COX-2 in various species (25) or with the affinity-purified rabbit polyclonal mPGES antibody (1:50; Cayman Chemical Co., Ann Arbor, Michigan, USA). After washing, there was a 40-minute incubation with Alexa 594–conjugated donkey anti-goat IgG (1:500; Molecular Probes Inc., Eugene, Oregon, USA) for COX-2 sections or with Alexa 488–conjugated goat anti-rabbit IgG (1:500; Molecular Probes Inc.) for mPGES sections. Sections were mounted with VECTASHIELD medium containing DAPI for nuclear staining (Vector Laboratories Inc., Burlingame, California, USA). Tissue sections were examined with an Olympus IX70 inverted epifluorescence microscope using a 40× objective. Images were captured using a SenSys digital camera and IPLab Spectrum software equipped with a power microtome (Signal Analytics Corp., Vienna, Virginia, USA).
Statistical analysis.
Data are expressed as mean ± SE. Statistical significance was tested using ANOVA. Significance was accepted at P < 0.05.
Results
Effects of exogenous PGE2.
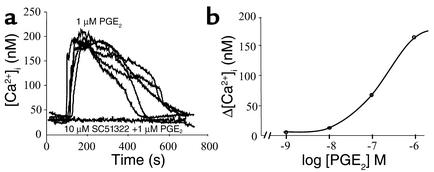
Initial studies were performed to assess the sensitivity of individual HEK/EP1 cells to exogenous PGE2. Representative recordings (Figure 2a) demonstrate that individual HEK/EP1 biosensor cells produced very similar, reversible, and dose-dependent (Figure 2b) elevations in [Ca2+]i in response to exogenous PGE2. Calcium signals were completely abolished (Figure 2a) when HEK/EP1 cells were preincubated with the EP1 blocker SC51322 (10 μM).
Figure 2.
Effects of exogenous PGE2 (added to the bath) on [Ca2+]i of an HEK/EP1 biosensor cell. (a) Recordings of five different HEK/EP1 cells demonstrate almost identical sensitivities of cells to 1 μM PGE2. HEK/EP1 [Ca2+]i responses were prevented by the coadministration of an EP1 blocker (SC51322). (b) Dose-response curve. Each data point represents the average of four cells studied.
Effects of luminal NaCl removal.
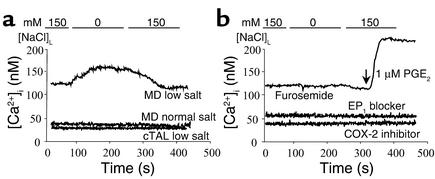
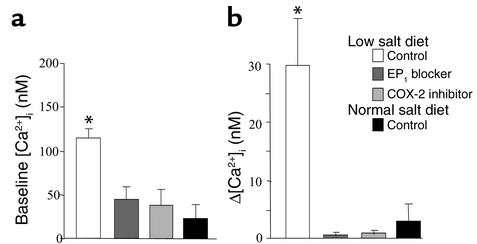
Since decreasing [NaCl]L produces MD signals that stimulate renin release, initial studies were performed in which [NaCl]L was decreased from 150 mM to 0 mM. Removing luminal NaCl resulted in a significant increase in [Ca2+]i of single HEK/EP1 cells positioned next to the MD basolateral membrane (Δ = 29.6 ± 12.8 nM, n = 6; Figure 3a and Figure 4b). This response was observed in preparations from animals kept on a low-salt diet for 1 week. In contrast, we were unable to detect significant elevations in HEK/EP1 cell [Ca2+]i (i.e., PGE2 release) from MD plaques obtained from rabbits kept on a standard salt diet (Δ = 2.8 ± 2.8 nM, n = 6) (Figure 3a and Figure 4b). Also, this response was MD cell–specific, since the same maneuver caused no detectable change in [Ca2+]i of HEK/EP1 cells placed next to distant cTAL cells (Figure 3a). Luminal NaCl removal–induced HEK/EP1 calcium responses in the low-salt group were completely inhibited by luminal addition of a selective COX-2 inhibitor (SC58236) or bath SC51322, a blocker of the receptor EP1 (Figure 3b and Figure 4b). It should also be noted that in low-salt diet studies there was a significant elevation in biosensor cell baseline [Ca2+]i (Figure 4a).
Figure 3.
Representative recordings of changes in HEK/EP1 [Ca2+]i/MD PGE2 release. (a) Luminal NaCl removal in the low-salt group (in contrast to normal diet) induced significant PGE2 release from MD, but not from distant cTAL cells, as evidenced by increases in HEK/EP1 [Ca2+]i. (b) HEK/EP1 calcium responses (low-salt group) were inhibited by either luminal addition of furosemide, an Na:2Cl:K cotransport blocker, or by a selective COX-2 inhibitor (SC58236, 100 nM) or bath SC51322 (10 μM), an EP1 blocker.
Figure 4.
Biosensor HEK/EP1 cell baseline [Ca2+]i (a) and tubular NaCl removal–induced increases in [Ca2+]i (Δ[Ca2+]i) (b). A low-salt diet significantly elevated biosensor cell baseline [Ca2+]i and Δ[Ca2+]i upon luminal NaCl removal, compared with a normal diet. Biosensor cell calcium responses were inhibited by luminal addition of a selective COX-2 inhibitor (SC58236, 100 nM) or bath SC51322 (10 μM), an EP1 blocker. (n = 6 in each group, *P < 0.01 compared with normal diet).
Effects of various [NaCl]L’s and furosemide.
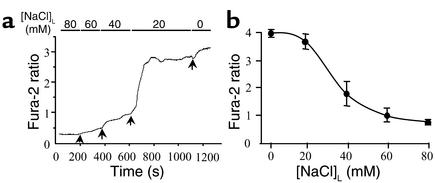
Next we tested whether our model is sensitive in the physiological range of [NaCl]L, and if more subtle changes in [NaCl]L can cause HEK/EP1 calcium responses. Figure 5 demonstrates that graduated changes in [NaCl]L between 80 mM and 0 mM caused step-by-step increases in HEK/EP1 cell fura-2 ratio. The most sensitive range of [NaCl]L where the most significant changes occurred was between 40 mM and 20 mM (Figure 5a). The [NaCl]L producing the half-maximal effect was around 30 mM (Figure 5b). Additional experiments examined whether HEK/EP1 cell calcium signals are related to changes in MD NaCl transport. Furosemide (100 μM), a Na:2Cl:K cotransport blocker and loop diuretic, added to the luminal perfusate significantly inhibited the magnitude of HEK/EP1 [Ca2+]i increases (by 81.0% ± 7.6% compared with control; n = 5, P < 0.01) in response to 150 mM [NaCl]L removal, as illustrated by the representative recording in Figure 3b. In the presence of furosemide, HEK/EP1 cells were still sensitive to exogenous PGE2 added to the bathing solution (Figure 3b). Similar confirmation of HEK/EP1 biosensor cell reactivity was always performed when detecting no calcium response (such as in the normal salt group and with COX-2 inhibitor, not shown).
Figure 5.
Luminal [NaCl] dependency of MD PGE2 release in cell preparations from rabbits fed a low-salt diet. (a) Representative recording shows step-by-step increases in HEK/EP1 cell fura-2 ratio in response to graduated reductions in luminal [NaCl] from 80 to 0 mM. (b) Relationship between biosensor cell responses and luminal [NaCl]. Data points represent mean ± SE, n = 4, all low-salt preparations.
Expression of COX-2 and mPGES in rabbit MD.
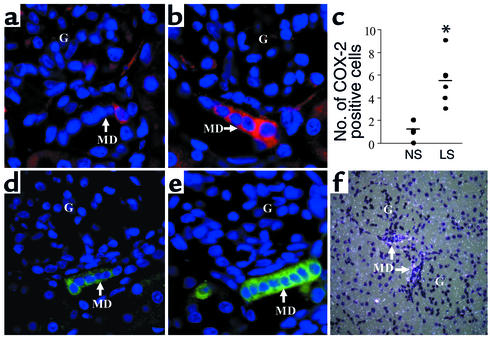
As illustrated in Figure 6a, there was very little staining of the rabbit MD with an antibody directed toward a C-terminal COX-2 peptide in animals on a normal salt diet. In contrast, the low-salt diet greatly increased the number of COX-2–immunoreactive cells in the MD (Figure 6, b and c). As with COX-2, there was a low level of mPGES expression in the MD in the normal kidney, but mPGES expression greatly increased in response to the low-salt diet (Figure 6e). In addition to localizing the mPGES protein, in situ hybridization clearly demonstrated the expression of mPGES mRNA in rabbit MD cells (Figure 6f). These findings indicate that the complete enzymatic machinery necessary for PGH2 synthesis and its conversion to PGE2 is indeed present in MD cells, and more importantly, both COX-2 and mPGES expression are upregulated by low salt intake.
Figure 6.
COX-2 (a–c) and mPGES (d and e) immunofluorescence of kidney cortex in control rabbits (a and d) and rabbits fed a low-salt diet (b and e). Number of COX-2–positive cells (c, n = 6 in each group, *P < 0.05 compared with normal salt diet) and mPGES expression in the MD significantly increased in response to the low-salt diet (LS) compared with the normal salt diet (NS). Nuclei are blue. In situ hybridization clearly demonstrated mPGES mRNA expression in MD cells (f).
Discussion
The present studies used a modification of a recently established biosensor technique (26) to provide direct functional evidence, for the first time, that PGE2 is released from the basolateral membrane of intact, perfused MD cells in a setting of reduced luminal salt delivery. This bioassay was originally used to measure cellular ATP release from the MD (19) using a rat pheochromocytoma clonal cell line (PC12) that endogenously expresses purinergic P2X receptors. Instead of using a native cell line, we engineered a novel biosensor tool, HEK293 cells transfected with the mouse receptor EP1, to selectively detect PGE2. The fura-2 fluorescence ratio, and consequently [Ca2+]i of individual HEK/EP1 cells, increased in response to exogenous PGE2 added to the bathing solution (Figure 2). The calcium responses of several individual HEK/EP1 cells were almost identical, indicating similar EP1 density and PGE2 sensitivity (Figure 2a). Also, calcium responses were dose-dependent and were completely abolished by preincubation with the EP1 blocker SC51322, which is consistent with EP1-mediated calcium signaling (11, 12). It is important to note that nontransfected HEK293 cells did not increase [Ca2+]i in response to PGE2 but did respond to exogenous ATP (data not shown), presumably through endogenously expressed purinergic receptors. This latter effect was completely blocked by gadolinium, which not only blocks P2X receptors (21) but also inhibits ATP release (19, 20). The experiments measuring PGE2 release were therefore carried out in the presence of gadolinium to exclude ATP purinergic signaling and its effects on cell [Ca2+]i. Gadolinium did not affect PGE2 detection by HEK/EP1 cells (similar responses in Figure 2a and Figure 3b).
Because of the limited number and inaccessibility of MD cells (only 15–20 cells per nephron), it has not been possible to directly test for the release of prostanoids by MD cells. The HEK/EP1 biosensor technique provides a unique tool allowing the detection of PGE2 release from single MD plaques. As shown in Figure 1, a fura-2–loaded HEK/EP1 cell can be positioned at the MD basolateral membrane surface, allowing real-time determination of basolateral PGE2 release from an intact microperfused cTAL-MD segment.
Removing NaCl from the luminal perfusate significantly elevated [Ca2+]i in HEK/EP1 biosensor cells, indicating PGE2 release from MD cells. Importantly, not only a single large change in luminal NaCl delivery (Figure 3a), but also more subtle reductions in [NaCl]L in the physiological range (Figure 5a), caused detectable PGE2 release from MD cells. The largest change in biosensor cell responses were observed between 40 mM and 20 mM [NaCl]L, and the half-maximal effect was around 30 mM [NaCl]L (Figure 5b). These findings are not only consistent with earlier work (27), but the data are essentially identical to the previously established [Cl]1/2, the luminal chloride concentration producing a half-maximal renin secretory effect (27).
Additional studies using furosemide provided further evidence that biosensor cell calcium responses (and therefore MD PGE2 release) were related to MD NaCl transport rather than a nonspecific effect of luminal NaCl. Inhibition of MD Na:2Cl:K cotransport with furosemide prevented [NaCl]L-dependent increases in HEK/EP1 [Ca2+]i (Figure 3b), consistent with earlier findings that furosemide blocks MD NaCl transport dependency of renin release (27). Low distal tubular [NaCl] is associated with states of volume depletion and is a stimulus for MD signaling that increases synthesis and release of renin from juxtaglomerular granular cells (3–6). Basolateral MD PGE2 release in response to decreased luminal salt delivery represents the physiological direction of signal transmission from MD cells into the juxtaglomerular apparatus area. Recent evidence has accumulated that this signaling mechanism involves MD-derived PGs produced by COX-2 in these cells (3–12). Consistent with this, we found that HEK/EP1 calcium responses were inhibited by luminal addition of a selective COX-2 inhibitor (SC58236) or bath SC51322, a blocker of the PGE2 receptor EP1. These findings provide direct evidence that intact MD cells release PGE2, consistent with PGE2 synthesis reported in a recently developed putative MD cell line (25). In our experiments, PGE2 release appeared to be MD cell–specific, since applying this biosensor approach upstream using HEK/EP1 cells placed next to distant cTAL cells produced no detectable signals (Figure 3a). However, it is possible that cTAL cells adjacent to the MD can also synthesize and release PGE2 and that this contributed to the detected biosensor signal.
Interestingly, we were unable to detect [NaCl]L-dependent PGE2 release from MD cells obtained from animals kept on a standard salt diet. Only the low-salt diet caused consistent and significant [NaCl]L-dependent increases in HEK/EP1 cell [Ca2+]i. A low-salt diet produces an experimental model characterized by a high renin state and is also known to increase the expression of COX-2 in MD cells (2). Upregulation of COX-2 in kidneys obtained from rabbits on a low-salt diet was indeed confirmed in the present studies by immunohistochemistry (Figure 6, a–c). Thus, similar to findings observed in other species (2, 28), the number of COX-2–immunoreactive cells in the MD plaque was substantially increased (by about sixfold) when animals were subjected to a low-salt diet for 1 week. This number actually nicely correlates to findings of biosensor studies in that only one of six normal salt preparations produced a biosensor calcium signal. We believe that the failure to show MD PGE2 release in the majority of normal salt preparations is mainly technical: the chance that the biosensor cell is positioned next to a COX-2– and mPGES-expressing (and consequently PGE2-producing) MD cell is much higher in the low-salt group. In other words, the sensitivity of this biosensor technique is probably limited to those MD cells in direct contact with the biosensor cell. Still, average MD PGE2 release was much higher on the low-salt diet. If we compare Figure 4b with Figure 2b, the estimated amount of PGE2 released from MD cells is around 50–60 nM on the low-salt diet and only 1–2 nM on normal salt intake.
In addition to COX-2, the present studies also demonstrated that mPGES, an enzyme capable of converting COX-2–derived PGH2 to PGE2 (29), was also present in the rabbit MD (Figure 6, d and f), and that mPGES expression was greatly upregulated in response to low salt intake (Figure 6e). Previous studies performed in rats failed to detect mPGES in microdissected MD (16), but whether this represents a species difference or a difference in the physiologic status of the animals studied remains unclear.
Not only did MD cells obtained from animals on a low-salt diet exhibit increased PGE2 production in response to reduced [NaCl]L, but baseline [Ca2+]i was also increased in HEK/EP1 cells placed adjacent to the MD (Figure 5a). Increased baseline HEK/EP1 cell [Ca2+]i is consistent with increased COX-2 and mPGES expression in MD cells and higher baseline PGE2 production in these MD. NaClL removal caused an almost immediate elevation in biosensor cell [Ca2+]i (Figure 3), suggesting a rapid activation of COX-2 and mPGES, with synthesis and release of PGE2 from MD cells. The rapidity of PGE2 synthesis in response to low luminal Cl– suggests rapid activation of an intracellular signaling cascade. At present the nature of this immediate signaling cascade, i.e., the link between reduced [NaCl]L and COX-2 activation, remains uncertain. Cl– transport–dependent activation of the MAPKs ERK and p38 has recently been suggested in cultured cells (25). However, tyrosine phosphorylation (30) could also stimulate MD COX-2 as well as activation of phospholipase A2, and increased substrate availability could be the cause of acute PGE2 generation (31). The biosensor technique should provide a novel tool that will help to clarify in detail the intracellular signaling mechanisms involved in MD NaCl transport and related PGE2 production in response to low [NaCl]L during salt deprivation.
In summary, these studies provided direct evidence for the synthesis and release of PGE2 from intact, perfused MD cells. Our findings are consistent with the recent view (9) that renin release and renal vascular resistance are critically dependent on MD COX-2– and mPGES-derived PGE2, particularly during volume depletion.
Acknowledgments
This work was supported by an NIH grant (5RO1 DK-32032) to P.D. Bell; an American Heart Association Scientist Development Grant (0230074N); an American Society of Nephrology Carl W. Gottschalk Research Scholar grant to J. Peti-Peterdi; a Hungarian Ministry of Welfare (ETT) grant and NATO Science Fellowships to J. Peti-Peterdi and L. Rosivall; and a Veterans Merit Award and NIH grant (RO1 DK-37097) to M.D. Breyer.
Footnotes
Conflict of interest: The authors have declared that no conflict of interest exists.
Nonstandard abbreviations used: macula densa (MD); cortical thick ascending limb (cTAL); luminal NaCl concentration ([NaCl]L); E-prostanoid receptor-1 (EP1); EP1-transfected HEK293 cells (HEK/EP1 cells); intracellular [Ca2+] ([Ca2+]i); microsome-associated PGE synthase (mPGES).
References
- 1.Smith WL, Bell TG. Immunohistochemical localization of the prostaglandin-forming cyclooxygenase in renal cortex. Am. J. Physiol. 1978;235:F451–F457. doi: 10.1152/ajprenal.1978.235.5.F451. [DOI] [PubMed] [Google Scholar]
- 2.Harris RC, et al. Cyclooxygenase-2 is associated with the macula densa of rat kidney and increases with salt restriction. J. Clin. Invest. 1994;94:2504–2510. doi: 10.1172/JCI117620. [DOI] [PMC free article] [PubMed] [Google Scholar]
- 3.Schnermann J. Cyclooxygenase-2 and macula densa control of renin secretion. Nephrol. Dial. Transplant. 2001;16:1735–1738. doi: 10.1093/ndt/16.9.1735. [DOI] [PubMed] [Google Scholar]
- 4.Harris RC, Wang JL, Cheng HF, Zhang MZ, McKanna JA. Prostaglandins in macula densa function. Kidney Int. 1998;67:S49–S52. doi: 10.1046/j.1523-1755.1998.06710.x. [DOI] [PubMed] [Google Scholar]
- 5.Harris RC. Macula densa signalling—a potential role of cyclooxygenase-2 (COX-2)? Nephrol. Dial. Transplant. 2000;15:1504–1506. doi: 10.1093/ndt/15.10.1504. [DOI] [PubMed] [Google Scholar]
- 6.Schnermann, J., and Briggs, J. 1985. Function of the juxtaglomerular apparatus: local control of glomerular hemodynamics. In The kidney. D.W. Seldin and G. Giebisch, editors. Raven Press. New York, New York, USA. 669–697.
- 7.Harris RC, Breyer MD. Physiological regulation of cyclooxygenase-2 in the kidney. Am. J. Physiol. Renal Physiol. 2001;281:F1–F11. doi: 10.1152/ajprenal.2001.281.1.F1. [DOI] [PubMed] [Google Scholar]
- 8.Yang T, et al. Renin expression in COX-2-knockout mice on normal or low-salt diets. Am. J. Physiol. Renal Physiol. 2000;279:F819–F825. doi: 10.1152/ajprenal.2000.279.5.F819. [DOI] [PubMed] [Google Scholar]
- 9.Castrop H, Schweda F, Schumacher K, Wolf K, Kurtz A. Role of renocortical cyclooxygenase-2 for renal vascular resistance and macula densa control of renin secretion. J. Am. Soc. Nephrol. 2001;12:867–874. doi: 10.1681/ASN.V125867. [DOI] [PubMed] [Google Scholar]
- 10.Traynor TR, Smart A, Briggs JP, Schnermann J. Inhibition of macula densa-stimulated renin secretion by pharmacological blockade of cyclooxygenase-2. Am. J. Physiol. 1999;277:F706–F710. doi: 10.1152/ajprenal.1999.277.5.F706. [DOI] [PubMed] [Google Scholar]
- 11.Breyer MD, Breyer RM. G protein-coupled prostanoid receptors and the kidney. Ann. Rev. Physiol. 2001;63:579–605. doi: 10.1146/annurev.physiol.63.1.579. [DOI] [PubMed] [Google Scholar]
- 12.Breyer MD, Breyer RM. Prostaglandin E receptors and the kidney. Am. J. Physiol. Renal Physiol. 2000;279:F12–F23. doi: 10.1152/ajprenal.2000.279.1.F12. [DOI] [PubMed] [Google Scholar]
- 13.Chaudhari A, Gupta S, Kirschenbaum MA. Biochemical evidence for PGI2 and PGE2 receptors in the rabbit renal preglomerular microvasculature. . Biochim. Biophys. Acta. 1990; 1053:156–161. doi: 10.1016/0167-4889(90)90008-2. [DOI] [PubMed] [Google Scholar]
- 14.Schnermann J, Weber PC. Reversal of indomethacin-induced inhibition of tubuloglomerular feedback by prostaglandin infusion. Prostaglandins. 1982;24:351–361. doi: 10.1016/0090-6980(82)90162-9. [DOI] [PubMed] [Google Scholar]
- 15.Farman N, Pradelles P, Bonvalet JP. PGE2, PGF2 alpha, 6-keto-PGF1 alpha, and TxB2 synthesis along the rabbit nephron. Am. J. Physiol. 1987;252:F53–F59. doi: 10.1152/ajprenal.1987.252.1.F53. [DOI] [PubMed] [Google Scholar]
- 16.Vitzthum H, Abt I, Einhellig S, Kurtz A. Gene expression of prostanoid forming enzymes along the rat nephron. Kidney Int. 2002;62:1570–1581. doi: 10.1046/j.1523-1755.2002.00615.x. [DOI] [PubMed] [Google Scholar]
- 17.Peti-Peterdi J, et al. Macula densa Na:H exchange activities mediated by apical NHE2 and basolateral NHE4 isoforms. Am. J. Physiol. 2000;278:F452–F463. doi: 10.1152/ajprenal.2000.278.3.F452. [DOI] [PubMed] [Google Scholar]
- 18.Narumiya S, Sugimoto Y, Ushikubi F. Prostanoid receptors: structures, properties, and functions. Physiol. Rev. 1999;79:1193–1226. doi: 10.1152/physrev.1999.79.4.1193. [DOI] [PubMed] [Google Scholar]
- 19.Bell PD, Lapointe JY, Sabirov R, Hayashi S, Okada Y. Maxi-chloride channel in macula densa cells: possible pathway for ATP release. FASEB J. 2000;14:A134. (Abstr.) [Google Scholar]
- 20.Sabirov RZ, Dutta AK, Okada Y. Volume-dependent ATP-conductive large-conductance anion channel as a pathway for swelling-induced ATP release. J. Gen. Physiol. 2001;118:251–266. doi: 10.1085/jgp.118.3.251. [DOI] [PMC free article] [PubMed] [Google Scholar]
- 21.Roman RM, Feranchak AP, Davison AK, Schwiebert EM, Fitz JG. Evidence for Gd(3+) inhibition of membrane ATP permeability and purinergic signaling. Am. J. Physiol. 1999;277:G1222–G1230. doi: 10.1152/ajpgi.1999.277.6.G1222. [DOI] [PubMed] [Google Scholar]
- 22.Peti-Peterdi J, Bell PD. Cytosolic [Ca2+] signaling pathway in macula densa cells. Am. J. Physiol. 1999;277:F472–F476. doi: 10.1152/ajprenal.1999.277.3.F472. [DOI] [PubMed] [Google Scholar]
- 23.Grynkiewicz G, Ponie M, Tsien RY. A new generation of Ca2+ indicators with greatly improved fluorescence properties. J. Biol. Chem. 1985;260:3440–3450. [PubMed] [Google Scholar]
- 24.Pelton RW, Johnson MD, Perkett EA, Gold LI, Moses HL. Expression of transforming growth factor-beta 1, -beta 2, and -beta 3 mRNA and protein in the murine lung. Am. J. Respir. Cell Mol. Biol. 1991;5:522–530. doi: 10.1165/ajrcmb/5.6.522. [DOI] [PubMed] [Google Scholar]
- 25.Yang T, et al. Low chloride stimulation of prostaglandin E2 release and cyclooxygenase-2 expression in a mouse macula densa cell line. J. Biol. Chem. 2000;275:37922–37929. doi: 10.1074/jbc.M006218200. [DOI] [PubMed] [Google Scholar]
- 26.Hazama A, Hayashi S, Okada Y. Cell surface measurements of ATP release from single pancreatic beta cells using a novel biosensor technique. Pflugers Arch. 1998;437:31–35. doi: 10.1007/s004240050742. [DOI] [PubMed] [Google Scholar]
- 27.He XR, Greenberg SG, Briggs JP, Schnermann J. Effects of furosemide and verapamil on the NaCl dependency of macula densa-mediated renin secretion. Hypertension. 1995;26:137–142. doi: 10.1161/01.hyp.26.1.137. [DOI] [PubMed] [Google Scholar]
- 28.Theilig F, et al. Epithelial COX-2 expression is not regulated by nitric oxide in rodent renal cortex. Hypertension. 2002;39:848–853. doi: 10.1161/01.hyp.0000013082.99285.35. [DOI] [PubMed] [Google Scholar]
- 29.Jakobsson PJ, Thoren S, Morgenstern R, Samuelsson B. Identification of human prostaglandin E synthase: a microsomal, glutathione-dependent, inducible enzyme, constituting a potential novel drug target. Proc. Natl. Acad. Sci. U. S. A. 1999;96:7220–7225. doi: 10.1073/pnas.96.13.7220. [DOI] [PMC free article] [PubMed] [Google Scholar]
- 30.Parfenova H, Balabanova L, Leffler CW. Posttranslational regulation of cyclooxygenase by tyrosine phosphorylation in cerebral endothelial cells. Am. J. Physiol. 1998;274:C72–C81. doi: 10.1152/ajpcell.1998.274.1.C72. [DOI] [PubMed] [Google Scholar]
- 31.Mangat H, Peterson LN, Burns KD. Hypercalcemia stimulates expression of intrarenal phospholipase A2 and prostaglandin H synthase-2 in rats. Role of angiotensin II AT1 receptors. J. Clin. Invest. 1997;100:1941–1950. doi: 10.1172/JCI119725. [DOI] [PMC free article] [PubMed] [Google Scholar]


