Abstract
Graphical representation of DNA sequence provides a simple way of viewing, sorting and comparing various gene structures. A new two-dimensional graphical representation method using a two- quadrant Cartesian coordinates system has been derived for mathematical denotation of DNA sequence. The two-dimensional graphic representation resolves sequences’ degeneracy and is mathematically proven to eliminate circuit formation. Given x-projection and y-projection of any point on the graphical representation, the number of A, G, C and T from the beginning of the sequence to that point could be found. Compared with previous methods, this graphical representation is more in-line with the conventional recognition of linear sequences by molecular biologists, and also provides a metaphor in two dimensions for local and global DNA sequence comparison.
Mathematical analysis of large volume genomic DNA sequence data is one of the challenges for bio-scientists. Graphical representation of DNA sequence provides a simple way of viewing, sorting and comparing various gene structures. About twenty years ago, Hamori first used a three-dimensional H curve to represent a DNA sequence (1,2). Sophisticated computer graphic tools are needed to generate the H curve (3). Gates proposed a two-dimensional graphical representation that is simpler than the H curve (4,5). However, Gates’s graphical representation has high degeneracy. For example, the sequences AGTC, AGTCA, AGTCAG, etc. have the same graphical representation. In mathematical terms, the sequence degeneracy forms repetitive closed loops or circuits in the DNA graph. Here, we present a new two-dimensional graphical representation of DNA sequences, which has no circuit or degeneracy, so that the correspondence between DNA sequences and DNA graphs is one-to-one.
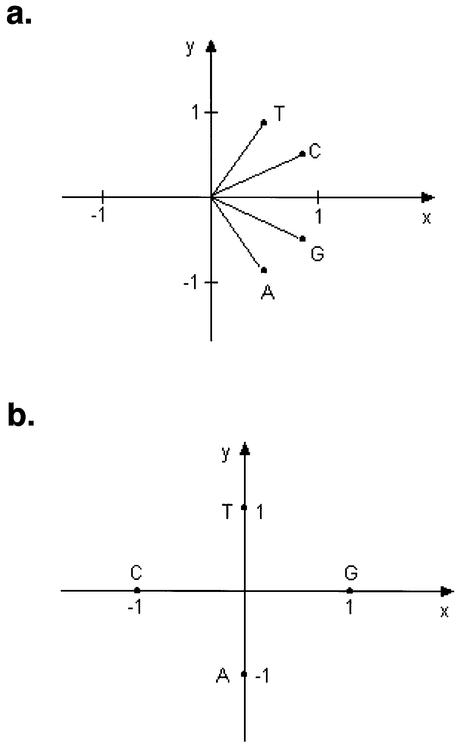
As shown in Figure 1a, we constructed a pyrimidine– purine graph on two quadrants of the Cartesian coordinate system, with pyrimidines (T and C) in the first quadrant and purines (A and G) in the fourth quadrant. The unit vectors representing four nucleotides A, G, C and T are as follows:
Figure 1.
The unit vectors designed by Yau (a) and Gates (b) in the Cartesian coordinate plane. (a) The vectors
were used to represent four nucleotides A, G, C and T, respectively. (b) The vectors representing A, G, C and T were (0,–1), (1,0), (–1,0) and (0,1), respectively.
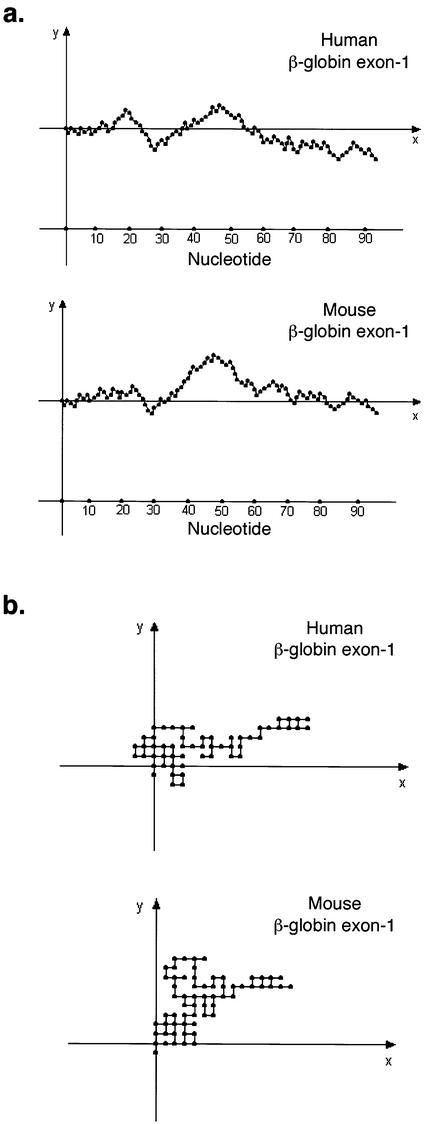
The unit vectors representing A, T, G and C are different from those of Gates’s method (Fig. 1b). Only two quadrants of the Cartesian coordinates are utilized. Figure 2a illustrates two DNA graphs representing human and mouse first exon of β-globin gene, respectively, based on the four vectors we designed. As a comparison, the same two sequences plotted using Gates’s approach are also shown in Figure 2b, which have many circuits.
Figure 2.
Two-dimensional graphs of both human and mouse β-globin exon-1 DNA sequences were generated by Yau’s (a) or Gates’s (b) method. Both sequences were obtained from NCBI GenBank (AF527577 or gi:22094826 for human β-globin, and J00413 or gi:193793 for mouse β-globin).
To prove there is no circuit or degeneracy in our two-dimensional graphical representation, we assume that (1) the number of nucleotide forming a circuit is n; (2) the number of A, G, C and T in a circuit is a, g, c and t, respectively. So, a + g + c + t = n. Because aA, gG, cC and tT form a circuit, the following equation holds:
i.e.
Clearly 1 and 2 hold if, and only if, a = g = c = t = 0. Therefore, n = 0, which means no circuit exists in this graphical representation.
Furthermore, given x-projection and y-projection of any point p = (x, y) on the sequence, we have
i.e.
where x is the x-projection and y is the y-projection of the point. 2x and 2y are irrational numbers of form  , where m and n are integers. After uniquely determining mx, nx, my and ny from 2x and 2y, the number ap, gp, cp and tp of A, G, C and T from the beginning of the sequence to the point p can be found by solving linear system:
ap + tp = mx
gp + cp = nx
–gp + cp = my
–ap + tp = ny
By successive x-projection and y-projection of points on the sequence, we can recover the original DNA sequence uniquely from the DNA graph.
The current scheme provides a direct plotting method to denote DNA sequences without degeneracy. Compared with previous methods, this graphical representation is more in-line with the conventional recognition of linear sequences from 5′ to 3′ end by molecular biologists (Fig. 2), and can easily be constructed without extensive computer graphic tools. The features of peaks and valleys generated from the DNA graph are distinct for specific DNA sequence. These long-range distinct patterns can be recognized visually. From the DNA graph, the A, T, G, C usage as well as the original DNA sequence can be recaptured mathematically without loss of textual information. Hamori’s H curve can be established with extensive annotations designating the sites of known biological functions, genes, exons, introns and so on. Our two-dimensional curves can also be annotated in a similar fashion. High complexity and degeneracy are major problems in previous DNA graphical representations (6–8), which limit the application of DNA graphs. The current two-dimensional graphical representation of DNA sequences introduced in this paper overcomes these problems and therefore will provide a different approach for both computational scientists and molecular biologists to analyse DNA sequences efficiently.
Acknowledgments
ACKNOWLEDGEMENTS
We thank the referees for their suggestions of improving the presentation of this paper.
REFERENCES
- 1.Hamori E. and Ruskin,J. (1983) H curves, a novel method of representation of nucleotide series especially suited for long DNA sequences. J. Biol. Chem., 258, 1318–1327. [PubMed] [Google Scholar]
- 2.Hamori E. (1985) Novel DNA sequence representations. Nature, 314, 585–586. [DOI] [PubMed] [Google Scholar]
- 3.Hamori E. (1994) Visualization of biological information encoded in DNA. In Pickover,C. and Tewksbury,S.K. (eds), Frontiers of Scientific Visualization, John Wiley & Sons, pp. 91–121.
- 4.Gates M.A. (1985) Simpler DNA sequence representations. Nature, 316, 219. [DOI] [PubMed] [Google Scholar]
- 5.Gates M.A. (1986) A simple way to look at DNA. J. Theor. Biol., 119, 319–328. [DOI] [PubMed] [Google Scholar]
- 6.Nandy A. (1996) Two-dimensional graphical representation of DNA sequences and intron–exon discrimination in intron-rich sequences. Comput. Appl. Biosci., 12, 55–62. [DOI] [PubMed] [Google Scholar]
- 7.Randic M., Vracko,M., Nandy,A. and Basak,S.C. (2000) On 3-D graphical representation of DNA primary sequences and their numerical characterization. J. Chem. Inf. Comput. Sci., 40, 1235–1244. [DOI] [PubMed] [Google Scholar]
- 8.Liu Y., Guo,X., Xu,J., Pan,L. and Wang,S. (2002) Some notes on 2-D graphical representation of DNA sequence. J. Chem. Inf. Comput. Sci., 42, 529–533. [DOI] [PubMed] [Google Scholar]


