


Abstract
The polymorphic –219T/G variant in the APOE promoter has been associated with variations in basal transcriptional activity as well as with the risk of developing Alzheimer’s disease, myocardial infarction and early-onset coronary heart disease. The molecular mechanisms underlying these effects are presently unknown. In this report, we show that nuclear extracts from Jurkat cells form a T-specific complex with a motif including the –219 site within the APOE promoter. By DNA-affinity chromatography and mass spectrometry, the human heterogeneous nuclear ribonucleoprotein hnRNPA1(A1) was identified as one component of the complex. In vitro binding analysis indicated that a fragment of A1 had a marked binding specificity for the T form. Interaction of A1 with this region is driven by an adjacent telomeric-like sequence; however, the presence of G, but not T, at –219 position inhibited this interaction. The differences in transcriptional activity between the –219T and –219G promoter allelic forms correlated with the expression levels of A1 in several cell lines; also, over-expression of A1 increased the activity of the T form relative to that of the G form. These results indicate that A1 transactivates APOE promoter activity by direct and specific interaction with the –219T site.
INTRODUCTION
Apolipoprotein E (ApoE, protein; APOE, gene) is a structural component of several lipoprotein species and plays a central role in lipid metabolism through cellular uptake of lipoprotein particles by lipoprotein receptors in liver and other tissues (1,2). In the central nervous system ApoE plays a remodeling role after a lesion and during aging (3). ApoE is a polymorphic protein, with three common isoforms (ApoE2, ApoE3 and ApoE4), encoded by three alleles (ε2, ε3 and ε4) of a single gene on chromosome 19q13.2 (4). This allelic variation contributes to susceptibility to atherosclerotic cardiovascular disease (5) and Alzheimer’s disease (AD) (6).
During the course of an epidemiological investigation, three polymorphic sites (–219T/G, –491A/T and –427C/T) were identified in the proximal APOE promoter region (nt –1017 to +406) (7–9). Several studies have found associations of the three polymorphic sites with the risk for developing AD [reviewed in Bullido and Valdivieso (10)]. The –219T/G polymorphism has also been associated with variations in myocardial infarction risk (11) and early-onset coronary heart disease risk (12).
The three polymorphic variants of the APOE promoter have different basal transcriptional activity (7–9). The individuals possessing the –491 or –219 allelic forms with highest transcriptional activity have significantly higher plasma ApoE levels (11) and increased APOE mRNA levels (13). It is therefore possible that the association between APOE promoter polymorphisms and AD and cardiovascular disease risk is related to variations in ApoE expression levels.
In spite of the association between polymorphic variants and disease risk, the molecular mechanisms underlying the variations in promoter activity associated to the single-base substitutions at the polymorphic sites remain unknown. In previous studies, it has been shown by electrophoretic mobility shift assays (EMSAs) that these single-base substitutions produced variations in the pattern of nuclear proteins that bind the polymorphic regions (7–9). These findings suggest that the differences in transcriptional activity and expression levels may be due to variations in the affinity of modulatory factors interacting with these regions. In this work, we identify a protein, human hnRNPA1, which specifically interacts with the allelic T form of the –219 promoter region, analyze the DNA sequence determinants driving the T-specific interaction, and present evidence that this protein modulates the transcriptional activity of the allelic T form of APOE promoter.
MATERIALS AND METHODS
Plasmid constructions
The 219T and 219G vectors encompassing the –620/+78 APOE promoter region were generated cloning the SmaI/SacI fragment of the two allelic forms of the –1017/+406 APOE promoter-pXP2-luciferase reporter plasmid (14) in the corresponding sites of the luciferase expression vector pXP2. The –219G mutation in the –1017/+406 APOE promoter construct was generated by a site-directed mutagenesis method described previously (14) using the oligonucleotide 5′-CGCCCAGTAATCCAGACACCCTCCTCC-3′ where the changed nucleotides are underlined.
For the expression of recombinant N-terminal poly-histidine-tagged hnRNPA1 protein, an EcoRI/HindIII pTrc99A-hnRNPA1 fragment spanning the coding sequence of the hnRNPA1 was subcloned into the pTrcHisC vector. The pTrc99A-A1 plasmid was constructed by inserting an EcoRI/XbaI fragment of the pcDNA3-HA-A1 (15) vector kindly provided by Dr Jorge Moscat in the corresponding sites of the pTrc99A plasmid (Pharmacia Biotech).
For the construction of the N-terminal poly-histidine-tagged UP1 vector an EcoRI/HindIII pTrc99A-UP1 fragment encompassing the UP-1 coding sequence was subcloned into the pTrcHisC vector. The pTrc99A-UP1 plasmid was generated from pTrc99A-A1 by creating a stop codon replacing the arginine 196 position of the A1 protein in the vector using the Quickchange™ site-mutagenesis system kit from Stratagene with the 5′-CCAAAGAGGTCGATGAGGTTCTGGAAACTT-3′ oligonucleotide and its complementary.
Cell cultures and analysis of APOE promoter activity
CB7, CB3 and CB3-A1 erytroleukemia cells (kindly provided by Dr B. Chabot) and Jurkat cells were cultured in RPMI 1640 medium (Gibco BRL) supplemented with 5% fetal calf serum and 2 mM l-glutamine. 106 cells were transfected in triplicate in 24-well cluster dishes with carefully adjusted, identical amounts (100 ng) of luciferase-reporter plasmids (219T and 219G) and 0.4 ng of DNA encoding Renilla luciferase (pRL-CMV; Promega), as a transfection control, and harvested after 24 h using the Lipofectamine Plus reactive (Invitrogen) according to the manufacturer’s instructions. Luciferase activity was determined using the Dual Luciferase Assay kit (Promega).
The human hepatome cell line HepG2 and the human astrocytoma U87 cell lines were grown and transfected as described previously (14).
Expression and protein purification
Recombinat proteins UP-1r and A1r were expressed and purified as described previously (16).
EMSA, UV crosslinking assays, immunodepletion and immunoprecipitation
EMSAs were carried out as reported previously (9) with the following oligonucleotides in which mutations are shown in brackets and the –219 position has been underlined. 219(T/G), 5′-GGAGGAGGGTGTCTG(T/G)ATTACTGGGCG-3′; 218A, 5′-GGAGGAGGGTGTCT(A)TATTACTGGGCG-3′; 220C, 5′-GGAGGAGGGTGTCTGT(C)TTACTGGGCG-3′.
UV crosslinking assays were performed by incubating 5 µg of nuclear extract, prepared as described previously (9), or 0.5 µl of a purified protein fraction, with 50 000 c.p.m. of 32P-labeled probes in 20 µl EMSA buffer (15 mM Tris–HCl pH 6.6, 15% glycerol, 50 mM NaCl, 3.75 mM MgCl2, 1.5 mM EDTA, 0.75 mM DTT) and 2 µg poly (dI-dC). The next steps were performed exactly as described previously (16).
To immunodeplete hnRNPA1 from Jurkat extracts the following procedure was carried out. An aliquot of 5 µg of Jurkat nuclear extract, prepared as described previously (9), was incubated with 0.5 µl of the anti-hnRNPA1 monoclonal antibody 4B10 (a gift from Dr G. Dreyfuss) (17) or 0.5 µl of control antibody HB57 (a mouse antibody of the same class), directed against amyloid precursor protein (APP) in 20 µl of EMSA buffer. Samples were rocked for 1 h at 4°C and then 15 µl of a 1:1 slurry of protein A–Sepharose (Pharmacia Biotech) in EMSA buffer were added and rocked for 1 h at 4°C. The resulting supernatant was incubated with 32P-labeled probes in the presence of 2 µg poly (dI-dC) and subjected to EMSA or UV crosslinking assays exactly as mentioned above.
Immunoprecipitation followed by UV crosslinking was carried out according to the procedure described previously (18) with minor modifications. Briefly, 25 µg of nuclear extract was incubated with 5 µg poly (dI-dC) in 20 µl EMSA buffer for 10 min on ice. 100 000 c.p.m. of double-stranded, 32P-labeled probe was added and incubated 20 min at room temperature. An aliquot of 80 µl of immunoprecipitation buffer was added, together with 3 µl of water, 3 µl of anti-A1 or 3 µl of control antibody HB57. Samples were rocked for 1.5 h at 4°C before addition of 15 µl of a 1:1 slurry of protein A–Sepharose (Pharmacia Biotech) in 50 mM Tris–HCl pH 7.7, 150 mM NaCl. Rocking was continued for 1.5 h at 4°C. Three washes were then performed with 50 mM Tris–HCl pH 7.7, 150 mM NaCl, 0.25 % Nonidet P-40. The radioactivity of samples was determined before and after each wash. After the third wash, beads were exposed to UV light as described previously (16), and the samples were subjected to SDS–PAGE analysis followed by autoradiography.
DNA affinity chromatography
Nuclear extracts from 109 Jurkat cells, prepared as described previously (19), were incubated with poly (dI-dC) at a 4:1 protein:poly (dI-dC) ratio at 4°C for 30 min. The resulting extract was loaded onto two consecutive control DNA-affinity columns and a 219T-affinity column, placed in series, previously equilibrated in buffer D (20 mM HEPES pH 7.9, 25% glycerol, 0.42 M KCl, 1.5 mM MgCl2, 0.2 mM EDTA, 0.5 mM phenyl methyl sulfonyl fluoride, 0.5 mM DTT and a protease inhibitor cocktail) containing 0.1 M KCl. The 219T-affinity column was constructed annealing 50 nmol of the 5′-biotinylated oligonucleotide 5′-AGGGTGTCTGTATTA CTGGGAGGGTGTCTGTATTACTGGGAGGGTGTCTGTATTACTGGG-3′, which contains three copies of the APOE promoter region –229 to –210, with 50 nmol of its non-biotinylated complementary and bound to 100 µl of streptavidin–agarose beads (Pierce). The approximate yield of the DNA coupling was 85%. DNA–agarose columns were constructed using 3 cm conventional FPLC tubing (1.2 mm i.d.), a nylon filter and a FPLC tubing connector (Amersham Pharmacia Biotech). After passing the nuclear extracts, the columns were disconnected and eluted separately using an exponential salt gradient of 0.1–1 M KCl in buffer D and collecting one drop fractions. Eluted fractions were analyzed by 10% SDS–PAGE gels followed by Coomassie Blue staining, and the specific 219T-binding proteins were determined by comparing the patterns of eluted proteins from each of the columns.
Protein identification by mass spectrometry
Protein bands from Coomassie-stained SDS–PAGE gels were digested as described previously (20), and individual peptides were identified using an ion-trap mass spectrometer model LCQ (Finnigan, ThermoQuest, San Jose, CA) equipped with a nanospray interface, as we have described previously (21).
RESULTS
The T-allelic form of APOE promoter forms a specific protein complex with nuclear extracts from Jurkat cells
In an initial attempt to characterize the nature of proteins responsible for the differential activity of forms –219T and –219G of APOE promoter, comparative EMSAs were performed in nuclear extracts from different cellular sources using two oligonucleotide probes spanning the –219 site and containing either T or G at this position. Using nuclear extracts from the T cell line Jurkat, 219T probe was found to form three main protein complexes (Fig. 1, bands a–c); band a was only detected by 219T probe, whereas bands b and c were also detected by 219G probe. Consistently, band a was completely displaced by an excess of cold 219T oligonucleotide while this band was only weakly displaced by the 219G oligonucleotide (Fig. 1B). To further investigate the relevance of –219 site in complex a formation, EMSAs were carried out using oligonucleotides where the immediately adjacent nucleotides were changed. As seen in Figure 1C (right panel) and, in contrast to 219G, the 218A and 220C probes (both containing T at –219 position) were able to form complex a, the latter binding even more efficiently than 219T probe. Consistently, an excess of either 218A or 220C cold probes completely displaced the formation of complex with 219T probe (Fig. 1C, left panel), while 219G did not. These results indicate that formation of complex a with the –219T allele of the APOE promoter is little influenced by nucleotides adjacent to this site and demonstrate that the complex is –219T-specific.
Figure 1.
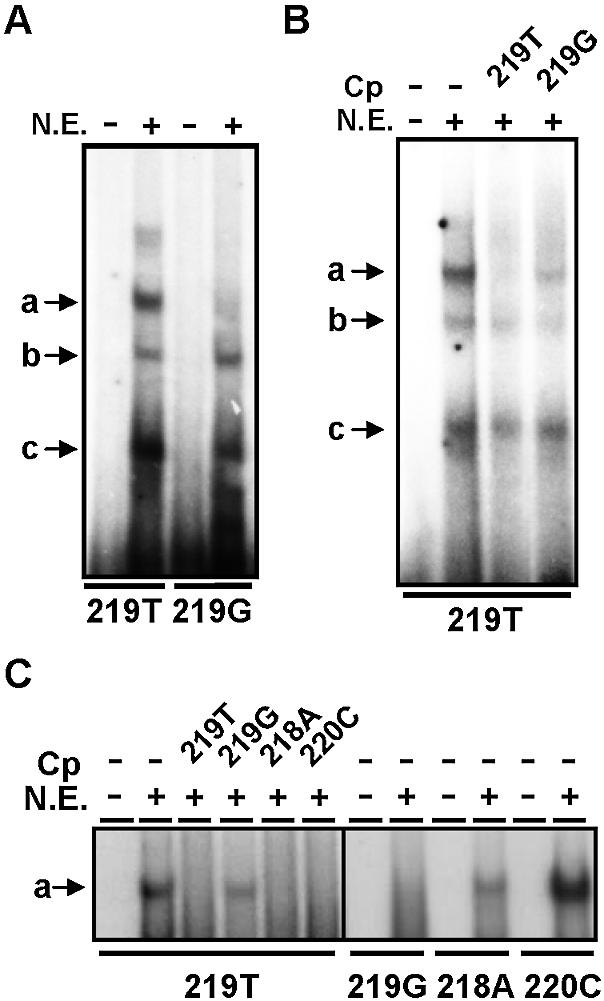
Analysis of the interaction of nuclear proteins from Jurkat cells with the –219 site of APOE promoter. Oligonucleotide probes spanning this site and having either T or G at –219 position (219T and 219G), or T at –219 and either A at –218 or C at –220 positions (218A and 220C) were analysed by EMSA using nuclear extracts from Jurkat cells. (A) Analysis of the interaction of 219T and 219G probes with proteins from nuclear extracts (N.E.). (B) Competition analysis of 219T binding by cold T- and G-containing probes. (C) Comparative analysis of the formation of the complex a with 219G, 218A and 220C probes (right panel) and competition analysis of –219T binding by cold 219T, 219G, 218A and 220C probes (left panel). In (B) and (C), cold probes (Cp) were pre-incubated at a 50-fold excess. The protein–DNA complexes are indicated at the left of each panel.
hnRNPA1 specifically interacts with the –219T site
To determine the nature of proteins forming part of complex a with 219T probe, nuclear extracts from Jurkat cells were passed through affinity chromatography columns containing multimerized copies of this region of APOE promoter, and bound proteins were eluted by a salt gradient. The specificity of proteins bound to this column was evaluated by previously passing the nuclear extracts through two affinity columns containing oligonucleotide constructs non-related to –219 APOE promoter region (NR1 and NR2), and comparing the profile of eluted proteins. The –219T-binding activity of the eluted fractions was monitored by EMSA (Fig. 2A); as shown, the last fractions eluted from the 219T column retained the a-complex-forming activity. Analysis of the eluted fractions by SDS–PAGE (Fig. 2B) indicated the presence of three specific proteins of 74, 36 and 34 kDa, which were not detectable in the eluates from the control affinity columns NR1 and NR2 (not shown). A non-specific 90–100 kDa range doublet was detectable in the eluates from the three columns. The proteins at 36 and 34 kDa were identified as the human hnRNPA2/B1 protein (A2/B1) (22) and the A isoform of the human hnRNPA1 (A1) protein (23) by MS/MS fragmentation analysis by nanospray-ion trap mass spectrometry (not shown), while the 74 kDa band could not be identified in databases. Since the elution profile of the 34 kDa band correlated with a-complex-forming activity (compare Fig. 2A and B), we focused our attention on that band (A1).
Figure 2.

Evidence that A1 is part of the nuclear protein complexes formed by 219T probe. (A) EMSA analysis of the formation of complex a by the fractions eluted from the 219T affinity column. The column fractions were numbered by E1 to E8. (B) Identification of A1 in the 219T column eluates. Fractions were analyzed by SDS–PAGE followed by Coomassie staining; the indicated band was in gel digested and the resulting peptides analyzed by mass spectrometry. Bands identified as hnRNPs A2/B1 and A1 are indicated. (C) Evidence that A1 is specifically retained by 219T column. Fractions eluted from the 219T column and the other two control columns (NR1 and NR2) were assayed by western blot analysis using an anti-A1 antibody. The arrow indicates the position of A1. (D, E and F) Evidence that A1 forms part of the main nuclear complex formed by 219T in the presence of nuclear cell extracts. In (D), fraction E8 eluted from the 219T affinity column was incubated with 219T and 219G probes, subjected to UV-induced crosslinking and analyzed by SDS–PAGE followed by autoradiography (left panel). Nuclear extracts from Jurkat cells were incubated with 219T probe and subjected to immunoprecipitation using an anti-A1 (α-A1) or a control antibody (α-APP); the precipitated material was then subjected to UV-induced crosslinking, followed by SDS–PAGE analysis and autoradiography. The positions of the A1-containing, specific 219T-protein complex (p50) and of the non-specific complex (p52) are indicated. In (E), Jurkat nuclear extracts inmunodepleted with α-A1 and α-APP antibodies were incubated with 219T and 219G probes, subjected to UV- induced crosslinking, and analyzed by SDS–PAGE and autoradiography. In (F), Jurkat nuclear extracts (N.E.) inmunodepleted with α-A1 and α-APP antibodies were incubated with 219T probe and subjected to EMSAs. The position of complex a is indicated with an arrow. Molecular weight markers are indicated on the left in (B), (C) and (D). A non-specific band is indicated by an asterisk in (D) and (E).
Fractions eluted from the control columns NR1 and NR2 did not form the a-complex detected with the 219T column eluates (not shown). In addition, a western blot analysis using the A1-specific monoclonal antibody 4B10 indicated conclusively that A1 was retained by 219T column but not by NR1 and NR2 columns (Fig. 2C), demonstrating the specificity of A1 binding to the 219T column.
Next, we analyzed by UV-induced crosslinking assays the direct binding activity to the –219 site of the higher salt fractions eluted from 219T column. As shown in Figure 2D, left, two prominent DNA–protein complexes of ∼50 and 52 kDa were detected using the 219T probe. These two complexes migrated closely, but only the upper complex (p52) was detected when the 219G probe was used (Fig. 2D, left), suggesting that the lower band (p50) was specific for the T isoform. In order to investigate whether A1 was present in these complexes, a nuclear extract from Jurkat cells was immunoprecipitated with the anti-A1 4B10 antibody, and the immunoprecipitated material was subjected to UV crosslinking assays using the 219T probe. As shown, only the p50 cross-linking band was detected in these assays, while no complexes were detected when a control antibody was used instead (Fig. 2D, right). In another set of experiments, nuclear extracts from Jurkat cells were inmunodepleted with the control antibody and cross-linked to 219T; in these conditions, the p50 band was clearly observed (Fig. 2E). However, after immunodepletion of the extracts using anti-A1 antibody the p52 band was detected instead (Fig. 2E). In clear contrast, the p52 band was always obtained when the extracts were cross-linked to 219G, no matter which antibody was used for immunodepletion (Fig. 2E). These results confirmed that the p50 band was 219T specific, and was sensitive to immunodepletion with anti-A1 antibody. Finally, formation of complex a with 219T probe was analyzed by EMSA using immunodepleted extracts. As shown in Figure 2F, immunodepletion with anti-A1 completely abolished formation of complex a, while only a partial inhibition of complex a formation was detected when immunodepleting with the control antibody. Taken together, these data strongly suggest that A1 is present in the 219T-specific complexes detected by either cross-linking (p50 band) or EMSAs (complex a).
Analysis of in vitro –219T binding activity of recombinant A1
We next investigated the interaction of a preparation of recombinant A1 (A1r) to –219T/G in vitro by UV-crosslinking assays. Incubation of increasing amounts of A1r with 219T probe resulted in the formation of a complex of increasing intensity that migrated with an apparent molecular weight of 50 kDa (Fig. 3B, arrow). The complex was detected with the same intensity when the 219G probe was used instead (Fig. 3C), in clear contrast with the results obtained when using material derived from cell cultures, where the crosslinked complex was only detected when using the T probe (Fig. 2D, left). These complexes seemed to be specific, since they could be displaced by a 50-fold excess of the corresponding cold oligonucleotides (Fig. 3C).
Figure 3.

Analysis of the interaction of A1 with –219T. (A) Sequence and denomination of the different DNA probes used for UV-crosslinking (B, C, D and E) and EMSA analysis (F). (B) Interaction of A1r with 219T and a non-related, double stranded DNA control probe. The A1r-219T complex was indicated by an arrow. (C) Interaction of A1r with 219T and 219G probes. In the indicated lanes, samples were previously incubated with an excess amount (50-fold) of the corresponding cold probes (Cp). The minor, –219T-specific protein complexes are indicated by arrows. (D) Interaction of UP-1r with 219T and 219G (upper panel). The 219T specific complex is indicated by an arrow. After autoradiography, the gel was reswollen and Coomassie Blue-stained (lower panel); the observed protein bands correspond to UP-1r. (E) Interaction of UP-1r with different, –219-related probes and competition binding analysis with an excess amount (100-fold) of cold oligonucleotides (Cp). (F) Formation of a complex in the presence of Jurkat nuclear cell extracts using different –219-related probes and competition analysis (50-fold) of 219T binding by 219T, 219G and Telmut cold probes (Cp). The complex a is indicated by an arrow.
Upon closer examination of the UV crosslinking results, we detected a set of minor complexes with a molecular weight lower than those expected for the full-length form of A1, which appeared consistently with the 219T probe, but not with the 219G probe (Fig. 3C, arrows). The size of these T-specific complexes suggested that they could derive from the interaction of 219T with proteolytic fragments of A1r, generated during the purification of this protein. We hypothesized that some of these truncated forms of A1r had an enhanced binding activity to the 219T probe. This assumption was based on the fact that an A1 proteolytic fragment known as unwinding protein-1 (UP-1) has been previously purified as a single-strand DNA binding protein, capable of stimulating DNA polymerase α activity and having a helix destabilizing activity (24–26). Interaction of UP-1 with DNA has been shown to have different physical properties to that of A1 (27), suggesting that certain regions of A1 not contained in UP-1 may act as modulators of the DNA binding activity (27). To explore this hypothesis, a preparation of recombinant UP-1 (UP-1r) was used to analyze binding to the –219 site. As shown in Figure 3D, two prominent complexes of ∼30 and 35 kDa were detected by crosslinking assays when UP-1r was incubated with 219T probe; these complexes were also detected when using the 219G probe, but the complex at 30 kDa (arrow) was hardly detected. Preincubation with excess cold 219T oligonucleotide inhibited the formation of the two 219T-UP-1 complexes, suggesting that the observed interactions were specific; in clear contrast, an excess of cold 219G oligonucleotide very weakly displaced the formation of the 30 kDa complex of UP-1 with 219T probe (Fig. 3E). These data indicate that UP-1r is able to bind 219T with much higher affinity than 219G, forming a complex of 30 kDa. These results are consistent with the T-allele binding specificity of A1 in its native state; probably, the structure of recombinant A1 is not sufficiently similar to that of native A1 to reproduce completely its binding specificity, but the elimination of some structural determinants, located outside UP-1 sequence, could make the conformation of this fragment more favorable to resemble the native binding properties.
Mapping of the UP-1r binding site
Both A1 and UP-1 have been implicated in the direct binding to continuous repeated TAGGGT motifs of the single strand telomeric sequences (28). Since the oligonucleotide probes used for affinity purification and DNA-binding assays contains the sequence AGGGT (Fig. 3A), we wondered whether this sequence could somewhat be involved in the formation of complexes with A1r and UP-1r. In order to explore this possibility, several oligonucleotide probes were constructed spanning different adjacent regions of the –219 site (Fig. 3A) and their UP-1r-binding activity was analyzed by UV-crosslinking assays. As shown in Figure 3E, deletion of the AGGGT-5′ sequence (3′ probe) resulted in the inhibition of complex formation. In contrast, the 5′ probe (excluding –219T/G site) formed complexes with UP-1r as efficiently as 219T probe. Consistently, excess cold 5′ oligonucleotide, but not 3′ oligonucleotide, completely displaced binding of UP-1r to 219T probe (Fig. 3E). These results indicate that the 5′ region of 219T probe, which spans the telomeric-like sequence, contains the structural determinants required for the interaction with UP-1r. Our results also indicate that although the nucleotides at position –219 are not needed for the interaction, the single T to G substitution at this position inhibits the formation of the complex, suggesting that 219G probe adopts a different conformation, which sterically impedes the interaction with UP-1r.
We also assayed the effect of eliminating the region with homology with telomere repeats in the formation of the a complex observed using nuclear protein extracts from Jurkat cells. As shown in Figure 3F, substitution of these bases (‘Telmut’ probe) impaired the formation of a complex with 219T probe, having the same effect that the single-base substitution of T to G. Consistently, neither excess cold 219G nor Telmut could displace the formation of the a complex (Fig. 3F). These results not only are in agreement with our previous data demonstrating that A1 is involved in the formation of the complex a, but also reflect the in vitro binding properties of UP-1r to this region, supporting the notion that the telomeric-like region is responsible for the formation of the complex, and that the complex is inhibited by the presence of G at –219 position.
Effect of A1 on the transcriptional activity of APOE promoter
We next analyzed whether binding of A1 to –219 site affects the transcriptional activity of APOE promoter. First, we studied the basal transcriptional activity of promoter constructs bearing T and G alleles and the nuclear concentrations of A1, in Jurkat, U87 and HepG2 cells. As shown in Figure 4A, the activity of the T form of the APOE promoter, in relation to that of the G form, was significantly lower in cells expressing lower levels of A1 (U87 and HepG2), while it was increased in cells expressing higher levels (Jurkat). This preliminary observation raises the possibility that the relative activity of the T form is influenced by changes in A1 concentration.
Figure 4.

Effect of A1 in the relative APOE promoter activity of the two –219 allelic forms. (A and C) Comparative analysis of the basal activity of the two –219 allelic forms of APOE promoter in different cell lines. CB3(A1) is the cell line CB3 stably transfected with A1. (B and D) Western blot analysis using an anti-A1 antibody of the expression of this protein in the different cell lines. Loading controls (LC) for equal protein amounts were performed by Ponceau S staining of the blot (B) and by immunostaining with anti-tubulin antibody (D). Data are representative of at least three independent experiments, performed in triplicate, and are expressed as mean ± SEM. Differences between the activity of –219T and G forms were analyzed by Student’s t-test. (* p < 0.04, ** p ≤ 0.01).
To explore this possibility, we assayed APOE promoter activity in the A1-deficient and A1-expressing erythroleukemia cell lines CB3 and CB7. These cells have sustained retroviral insertion events downstream of one of the two alleles encoding A1. In CB3 cells the second Hnrnpa1 allele has been lost (29) and as a result, CB3 cells produce 200–500-fold fewer Hnrnpa1 transcripts than CB7 and no detectable A1 protein (22,29). The expression level of A1 in CB7 cells was similar to that found in Jurkat cells (data not shown). As shown in Figure 4C, the basal transcriptional activities of the promoter allelic forms were not significantly different in CB7 cells, but the activity of the T form was significantly lower than that of the G form in CB3 cells. These results are in good agreement with those obtained in Jurkat, U87 and HepG2 cells, and suggest that the increases in A1 levels balance the differences in activity between the T and G promoter forms, most probably enhancing the transcriptional activity of the T-allele.
Besides A1, it is known that other genes, such as p45 NFE2, whose product is an erythroid-specific transcription factor, are also inactivated in CB3 cells in comparison with CB7 (30). In order to discard the possibility that the differences in T/G activities observed in these two cell lines were not directly related to A1, and to demonstrate the direct effect of A1 on the –219 site, we analyzed the basal transcriptional activity of the promoter in CB3 cells in which A1 levels have been restored (CB3A1) (28) at levels comparable to those of CB7 cells (Fig. 4D). Over-expression of A1 in CB3 cells produced a profound effect in the relative basal transcriptional activity of the T form, which becomes even higher than that of the G form (Fig. 4C). Therefore, variations in A1 levels produce, in the same cells, a clearly different effect on two identical promoters, which differs by just a single base substitution. While differences in basal transcriptional activity between the T and G alleles may be explained by a number of different reasons, and are not necessarily related to A1, these results, obtained under careful internally controlled conditions, give strong evidence that A1 modulates the activity of the APOE promoter through the –219 site influencing with different efficiencies the activities of the T and G allelic forms. These results are thus consistent with the in vitro binding data.
DISCUSSION
A1 is an abundantly expressed protein (23), which has been involved in a variety of cellular functions. It has a role in pre-mRNA processing (31), promotes the renaturation of complementary DNA strands (27) and participates in the telomeric length maintenance (28). Several reports also associate A1 with transcriptional control. By increasing IκB degradation, A1 augments NF-κB-dependent transcription (32) and the interaction of A1 with a vitamin D-resistant promoter binding region (33) has been described. A1 has also been described to bind human thymidine kinase gene promoter, suppressing its transcriptional activity (34) and very recently, it has been described that nuclear matrix attachment regions adjacent to the LMP/TAP gene cluster recruit and bind A1 upon transcriptional up-regulation (35). These results are consistent with the data obtained in this work, where A1 is shown to have a direct modulator effect on the transcriptional activity of the T-allele form of APOE promoter.
While A1 may play a direct regulatory role on APOE promoter activity, our data also indicate that in cells with low or null expression of A1, the basal activity of the G form of the promoter is higher than that of the T form. Therefore, A1 appears not to be directly responsible for the basal differential activity of the two allelic forms. Although we cannot discard the existence of an additional factor, which interacts differentially with the two allelic forms, producing a difference in basal activity, we have detected no evidence for the existence of such a factor by either EMSA or UV-crosslinking assay; the only allelic-specific complexes detected during the course of this work appeared to be associated with the protein A1. It is therefore possible that the allelic differences in activity are produced by the existence of different DNA conformations without the participation of allelic-specific protein factors. This notion is supported by the finding that the –219 site appears to be particularly critical for the formation of protein complexes, so that the presence of G at –219 position has an inhibitory effect; thus, the conformation adopted by the G form could not only sterically impede the interaction of A1 with the adjacent telomeric-like sequence, but also be more favorable for the transcription. Similarly, while A1 may play a direct role as transcription factor, selectively enhancing the activity of the allelic T form, it is also conceivable that the interaction of A1 with this form alters its conformation, enhancing its transcriptional activity.
The recovery of in vitro T-binding specificity observed when the C-terminal region of A1 is truncated suggests that the conformation adopted by A1 in vivo may be similar to that adopted by the A1 fragment UP-1. Indeed, some lines of evidence support the notion that the conformation of A1 is regulated by several factors. Thus, in vitro phosphorylation of A1 by protein kinase C induces a conformational change at its C-terminal region that inhibits its DNA annealing activity (36). In addition, DNA-binding properties of A1 and UP-1 show some differences, such as its susceptibility to increasing ionic strength; some authors have proposed that the C-terminal region of A1, which is not contained in UP-1, may act as a modulator of DNA-binding activity of A1 (36). The conformation of A1 may also be regulated by protein–protein interactions. Thus, A1 has been shown to interact both in vitro and in vivo with itself and with other heterogeneous nuclear ribonucleoproteins core proteins through its C-terminal domain (37). Therefore, it is possible that a heterogeneous ribonucleoprotein complex similar to core complexes detected in other tissues both in nucleus and cytoplasm (38) could be regulating the interaction of A1 with the –219 site.
A1 binds in vitro a broad range of RNA oligonucleotides with similar specificity (39), with the exception of the twice-repeated UAGGG(A/U) sequence, for which it has an unusually high affinity (40). The dideoxy form of this sequence is identical to the TAGGGT telomeric repeat and very similar to the AGGGT sequence localized 5′ of the –219 site at the APOE promoter. We have demonstrated that this region drives the in vitro formation of two complexes of different mobility between UP-1 and oligonucleotides spanning the –219 site. Formation of the high molecular weight complex is not affected by the allelic variant at this site. However, formation of the lower weight complex is strongly dependent on the nature of the nucleotide located at the –219 polymorphic position, being the complex inhibited by the presence of G at this site. In the crystalline structure of UP-1 complexed with single-stranded telomeric DNA, an UP-1 dimer was found to bind two strands of DNA, resulting in DNA bending, and suggesting that each UP-1 molecule contacts with two different DNA sites simultaneously (41). Although the DNA probes used in this work are double stranded, these data suggest that the two complexes observed here may derive from the formation of DNA structures which interact with UP-1 through different mechanisms.
Possession of the T-allele at the –219 site in the APOE promoter has been associated with increased AD, myocardial infarction and premature coronary heart disease risk (11,42) and with elevated deposition of the amyloid β peptide accumulated in AD patients’ brains (43). The T-allele has also been associated with a lower transcriptional activity (7) and decreased ApoE plasma concentrations (11), suggesting that the transcriptional modulation of APOE promoter through the –219 site plays a relevant physiological role in the control of ApoE levels. Our data support the notion that the basal activity of the T-allele form of APOE promoter is lower than that of the G-allele in model cell systems with low or null expression levels of A1, and that expression of A1 tends to compensate the allelic differences in promoter activity through the specific interaction of A1 with the T-allele, which promotes an increase in transcriptional activity. This interaction of A1 appears to be very sensitive to mutations at the –219 site, but not at adjacent sites, this finding being consistent with the differences in transcriptional activity of the –219T and –219G forms of the promoter. This scenario would explain why there are no significant allelic differences in basal activity in cells constitutively expressing high levels of A1, such as Jurkat or CB7 cells, while allelic differences are clearly detected in other cell systems, such as those of hepatic or astrocytic origin, which express A1 at lower levels. These arguments raise the intriguing question whether a hypothetical pharmacological intervention at the A1-mediated level of APOE promoter control would result in the attenuation of the risk of developing AD, or some cardiovascular diseases, in individuals bearing the –219T allelic form.
Acknowledgments
ACKNOWLEDGEMENTS
We thank Dr J. M. Redondo for critical reading of the manuscript and for his helpful suggestions, and I. Sastre for her excellent technical assistance. We are very grateful to Dr B. Chabot for the generous gifts of CB7, CB3 and CB3-A1 erytroleukemia cells; Dr G. Dreyfuss for supplying the 4B10 monoclonal antibody to hnRNPA1 and Dr J. Moscat for providing the pcDNA-HA-A1 plasmid. This work was supported by grants CICYT SAF 2000-0178 from Spain Ministry of Science and Technology and 08.5/0065.1/2001 from Autonomous Community of Madrid (CAM), and by an institutional grant by Fundación Ramón Areces to CBMSO. We are grateful for fellowship from the CAM (J.R.L.).
REFERENCES
- 1.Mahley R.W. (1988) Apolipoprotein E: cholesterol transport protein with expanding role in cell biology. Science, 240, 622–630. [DOI] [PubMed] [Google Scholar]
- 2.Weisgraber K.H. (1994) Apolipoprotein E: structure–function relationships. Adv. Protein Chem., 45, 249–302. [DOI] [PubMed] [Google Scholar]
- 3.Masliah E., Mallory,M., Aford,M., Veinbergs,I. and Roses,A.D. (1996) In Roses,A.D., Weisgraber,K.H. and Christen,Y. (eds), Apolipoprotein E and Alzheimer’s Disease. Springer Verlag, Berlin, Germany, pp. 59–73.
- 4.Das H.K., McPherson,J., Bruns,G.A., Karathanasis,S.K. and Breslow,J.L. (1985) Isolation, characterization and mapping to chromosome 19 of the human apolipoprotein E gene. J. Biol. Chem., 260, 6240–6247. [PubMed] [Google Scholar]
- 5.Davignon J., Gregg,R.E. and Sing,C.F. (1988) Apolipoprotein E polymorphism and atherosclerosis. Arteriosclerosis, 8, 1–21. [DOI] [PubMed] [Google Scholar]
- 6.Corder E.H., Saunders,A.M., Strittmatter,W.J., Schmechel,D.E., Gaskell,P.C., Small,G.W., Roses,A.D., Haines,J.L. and Pericak-Vance,M.A. (1993) Gene dose of apolipoprotein E type 4 allele and the risk of Alzheimer’s disease in late onset families. Science, 261, 921–923. [DOI] [PubMed] [Google Scholar]
- 7.Artiga M.J., Bullido,M.J., Sastre,I., Recuero,M., García,M.A., Aldudo,J., Vázquez,J. and Valdivieso,F. (1998) Allelic polymorphisms in the transcriptional regulatory region of apolipoprotein E gene. FEBS Lett., 421, 105–108. [DOI] [PubMed] [Google Scholar]
- 8.Artiga M.J., Bullido,M.J., Frank,A., Sastre,I., Recuero,M., García,M.A., Lendon,C.L., Han,S.W., Morris,J.C., Vázquez,J., Goate,A. and Valdivieso,F. (1998) Risk for Alzheimer’s disease correlates with transcriptional activity of the APOE gene. Hum. Mol. Genet., 7, 1887–1892. [DOI] [PubMed] [Google Scholar]
- 9.Bullido M.J., Artiga,M.J., Recuero,M., Sastre,I., García,M.A., Aldudo,J., Lendon,C., Han,S.W., Morris,J.C., Frank,A., Vázquez,J., Goate,A. and Valdivieso,F. (1998) A polymorphism in the regulatory region of APOE associated with risk for Alzheimer’s dementia. Nature Genet., 18, 69–71. [DOI] [PubMed] [Google Scholar]
- 10.Bullido M.J. and Valdivieso,F. (2000) Apolipoprotein E gene promoter polymorphisms in Alzheimer’s disease. Microsc. Res. Tech., 50, 261–267. [DOI] [PubMed] [Google Scholar]
- 11.Lambert J.C., Brousseau,T., Defosse,V., Evans,A., Arveiler,D., Ruidavets,J.B., Haas,B., Cambou,J.P., Luc,G., Ducimetiere,P., Cambien,F., Chartier-Harlin,M.C. and Amouyel,P. (2000) Independent association of an APOE gene promoter polymorphism with increased risk of myocardial infarction and decreased APOE plasma concentrations—the ECTIM study. Hum. Mol. Genet., 9, 57–61. [DOI] [PubMed] [Google Scholar]
- 12.Viitanen L., Pihlajamaki,J., Miettinen,R., Karkkainen,P., Vauhkonen,I., Halonen,P., Kareinen,A., Lehto,S. and Laakso,M. (2001) Apolipoprotein E gene promoter (–219G/T) polymorphism is associated with premature coronary heart disease. J. Mol. Med., 79, 732–737. [DOI] [PubMed] [Google Scholar]
- 13.Laws S.M., Taddei,K., Martins,G., Paton,A., Fisher,C., Clarnette,R., Hallmayer,J., Brooks,W.S., Gandy,S.E. and Martins,R.N. (1999) The –491A/T polymorphism in the APOE gene is associated with increased plasma apoE levels in Alzheimer’s disease. Neuroreport, 10, 879–882. [DOI] [PubMed] [Google Scholar]
- 14.García M.A., Vázquez,J., Giménez,C., Valdivieso,F. and Zafra,F. (1996) Transcription factor AP-2 regulates human apolipoprotein E gene expression in astrocytoma cells. J. Neurosci., 16, 7550–7556. [DOI] [PMC free article] [PubMed] [Google Scholar]
- 15.Municio M.M., Lozano,J., Sánchez,P., Moscat,J. and Díaz-Meco,M.T. (1995) Identification of heterogeneous ribonucleoprotein A1 as a novel substrate for protein kinase C ζ. J. Biol. Chem., 270, 15884–15891. [DOI] [PubMed] [Google Scholar]
- 16.García M.A., Campillos,M., Marina,A., Valdivieso,F. and Vázquez,J. (1999) Transcription factor AP-2 activity is modulated by protein kinase A-mediated phosphorylation. FEBS Lett., 444, 27–31. [DOI] [PubMed] [Google Scholar]
- 17.Piñol-Roma S., Choi,Y.D., Matunis,M.J. and Dreyfuss,G. (1988) Immunopurification of heterogeneous nuclear ribonucleoprotein particles reveals an assortment of RNA-binding proteins. Genes Dev., 2, 215–227. [DOI] [PubMed] [Google Scholar]
- 18.Del Gatto-Konczak F., Olive,M., Gesnel,M.C. and Breathnach,R. (1999) hnRNP A1 recruited to an exon in vivo can function as an exon splicing silencer. Mol. Cell. Biol., 19, 251–260. [DOI] [PMC free article] [PubMed] [Google Scholar]
- 19.Dignam J.D., Lebovitz,R.M. and Roeder,R.G. (1983) Accurate transcription initiation by RNA polymerase II in a soluble extract from isolated mammalian nuclei. Nucleic Acids Res., 11, 1475–1489. [DOI] [PMC free article] [PubMed] [Google Scholar]
- 20.Shevchenko A., Wilm,M., Vorm,O. and Mann,M. (1996) Mass spectrometric sequencing of proteins silver-stained polyacrylamide gels. Anal. Chem., 68, 850–858. [DOI] [PubMed] [Google Scholar]
- 21.Marina A., García,M.A., Albar,J.P., Yague,J., López De Castro,J.A. and Vázquez,J. (1999) High-sensitivity analysis and sequencing of peptides and proteins by quadrupole ion trap mass spectrometry. J. Mass Spectrom., 34, 17–27. [DOI] [PubMed] [Google Scholar]
- 22.Yang X., Bani,M.R., Lu,S.J., Rowan,S., Ben-David,Y. and Chabot,B. (1994) The A1 and A1B proteins of heterogeneous nuclear ribonucleoparticles modulate 5′ splice site selection in vivo. Proc. Natl Acad. Sci. USA, 91, 6924–6928. [DOI] [PMC free article] [PubMed] [Google Scholar]
- 23.Riva S., Morandi,C., Tsoulfas,P., Pandolfo,M., Biamonti,G., Merrill,B., Williams,K.R., Multhaup,G., Beyreuther,K., Werr,H. et al. (1986) Mammalian single-stranded DNA binding protein UP I is derived from the hnRNP core protein A1. EMBO J., 5, 2267–2273. [DOI] [PMC free article] [PubMed] [Google Scholar]
- 24.Herrick G. and Alberts,B. (1976) Purification and physical characterization of nucleic acid helix-unwinding proteins from calf thymus. J. Biol. Chem., 251, 2124–2132. [PubMed] [Google Scholar]
- 25.Herrick G., Delius,H. and Alberts,B. (1976) Single-stranded DNA structure and DNA polymerase activity in the presence of nucleic acid helix-unwinding proteins from calf thymus. J. Biol. Chem., 251, 2142–2146. [PubMed] [Google Scholar]
- 26.Detera S.O., Becerra,S.P., Swack,J.A. and Wilson,S.H. (1981) Studies on the mechanism of DNA polymerase α. Nascent chain elongation, steady state kinetics, and the initiation phase of DNA synthesis. J. Biol. Chem., 256, 6933–6943. [PubMed] [Google Scholar]
- 27.Pontius B.W. and Berg,P. (1990) Renaturation of complementary DNA strands mediated by purified mammalian heterogeneous nuclear ribonucleoprotein A1 protein: implications for a mechanism for rapid molecular assembly. Proc. Natl Acad. Sci. USA, 87, 8403–8407. [DOI] [PMC free article] [PubMed] [Google Scholar]
- 28.Labranche H., Dupuis,S., Ben-David,Y., Bani,M.R., Wellinger,R.J. and Chabot,B. (1998) Telomere elongation by hnRNP A1 and a derivative that interacts with telomeric repeats and telomerase. Nature Genet., 19, 199–202. [DOI] [PubMed] [Google Scholar]
- 29.Ben-David Y., Bani,M.R., Chabot,B., De Koven,A. and Bernstein,A. (1992) Retroviral insertions downstream of the heterogeneous nuclear ribonucleoprotein A1 gene in erythroleukemia cells: evidence that A1 is not essential for cell growth. Mol. Cell. Biol., 12, 4449–4455. [DOI] [PMC free article] [PubMed] [Google Scholar]
- 30.Li Y.J., Pak,B.J., Higgins,R.R., Lu,S.J. and Ben-David,Y. (2001) Contiguous arrangement of p45 NFE2, HnRNP A1 and HP1 alpha on mouse chromosome 15 and human chromosome 12: evidence for suppression of these genes due to retroviral integration within the Fli-2 locus. Genes Chromosom. Cancer, 30, 91–95. [PubMed] [Google Scholar]
- 31.Bai Y., Lee,D., Yu,T. and Chasin,L.A. (1999) Control of 3′ splice site choice in vivo by ASF/SF2 and hnRNP A1. Nucleic Acids Res., 27, 1126–1134. [DOI] [PMC free article] [PubMed] [Google Scholar]
- 32.Hay D.C., Kemp,G.D., Dargemont,C. and Hay,R.T. (2001) Interaction between hnRNPA1 and IκBα is required for maximal activation of NF-κB-dependent transcription. Mol. Cell. Biol., 21, 3482–3490.11313474 [Google Scholar]
- 33.Chen H., Hu,B., Allegretto,E.A. and Adams,J.S. (2000) The vitamin D response element-binding protein. A novel dominant-negative regulator of vitamin D-directed transactivation. J. Biol. Chem., 275, 35557–35564. [DOI] [PubMed] [Google Scholar]
- 34.Lau J.S., Baumeister,P., Kim,E., Roy,B., Hsieh,T.Y., Lai,M. and Lee,A.S. (2000) Heterogeneous nuclear ribonucleoproteins as regulators of gene expression through interactions with the human thymidine kinase promoter. J. Cell. Biochem., 79, 395–406. [DOI] [PubMed] [Google Scholar]
- 35.Donev R., Horton,R., Beck,S., Doneva,T., Vatcheva,R., Bowen,W.R. and Sheer,D. (2003) Recruitment of heterogeneous nuclear ribonucleoprotein A1 in vivo to the LMP/TAP region of the major histocompatibility complex. J. Biol. Chem., 278, 5214–5226. [DOI] [PubMed] [Google Scholar]
- 36.Idriss H., Kumar,A., Casas-Finet,J.R., Guo,H., Damuni,Z. and Wilson,S.H. (1994) Regulation of in vitro nucleic acid strand annealing activity of heterogeneous nuclear ribonucleoprotein protein A1 by reversible phosphorylation. Biochemistry, 33, 11382–11390. [DOI] [PubMed] [Google Scholar]
- 37.Cartegni L., Maconi,M., Morandi,E., Cobianchi,F., Riva,S. and Biamonti,G. (1996) hnRNP A1 selectively interacts through its Gly-rich domain with different RNA-binding proteins. J. Mol. Biol., 259, 337–348. [DOI] [PubMed] [Google Scholar]
- 38.Kamma H., Portman,D.S. and Dreyfuss,G. (1995) Cell type-specific expression of hnRNP proteins. Exp. Cell Res., 221, 187–196. [DOI] [PubMed] [Google Scholar]
- 39.Abdul-Manan N. and Williams,K.R. (1996) hnRNP A1 binds promiscuously to oligoribonucleotides: utilization of random and homo-oligonucleotides to discriminate sequence from base-specific binding. Nucleic Acids Res., 24, 4063–4070. [DOI] [PMC free article] [PubMed] [Google Scholar]
- 40.Burd C.G., Swanson,M.S., Gorlach,M. and Dreyfuss,G. (1989) Primary structures of the heterogeneous nuclear ribonucleoprotein A2, B1 and C2 proteins: a diversity of RNA binding proteins is generated by small peptide inserts. Proc. Natl Acad. Sci. USA, 86, 9788–9792. [DOI] [PMC free article] [PubMed] [Google Scholar]
- 41.Ding J., Hayashi,M.K., Zhang,Y., Manche,L., Krainer,A.R. and Xu,R.M. (1999) Crystal structure of the two-RRM domain of hnRNP A1 (UP1) complexed with single-stranded telomeric DNA. Genes Dev., 13, 1102–1115. [DOI] [PMC free article] [PubMed] [Google Scholar]
- 42.Lambert J.C., Pasquier,F., Cottel,D., Frigard,B., Amouyel,P. and Chartier-Harlin,M.C. (1998) A new polymorphism in the APOE promoter associated with risk of developing Alzheimer’s disease. Hum. Mol. Genet., 7, 533–540. [DOI] [PubMed] [Google Scholar]
- 43.Lambert J.C., Mann,M., Goumidi,J., Harris,J., Amouyel,P., Iwatsubo,T., Lendon,C. and Chartier-Harlin,M.C. (2001) Effect of the APOE promoter polymorphisms on cerebral amyloid peptide deposition in Alzheimer’s disease. Lancet, 357, 608–609. [DOI] [PubMed] [Google Scholar]