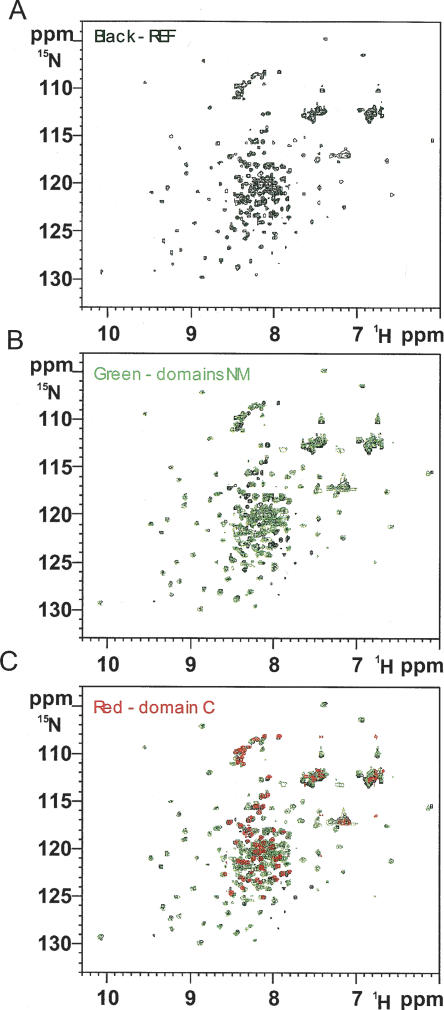
FIGURE 2.
The REF2-I, NM, and C domain HSQC spectra overlay. (A) The HSQC spectrum for full length REF2-I is shown in black. (B) An overlay of the HSQC spectra for NM (amino acids 1–155; green) with the spectra for full-length REF2-I (black). (C) An overlay of the HSQC spectra for full-length REF2-I (black), NM (green), and the C domain (red).

