

Abstract
Co-stimulatory ligand CD80 interaction with CD28 or CTLA-4 plays an important role in the regulation of the T cell response. We have examined the role of the cytoplasmic domain of CD80 in murine T cell co-stimulation and its organization in the immunological synapse (IS). When compared to the wild type, full-length CD80, removal of CD80 cytoplasmic tail decreased its activity in co-stimulating T cell proliferative response and early IL-2 production in response to agonist MHC-peptide complexes. This correlates with decreased CD80 tailless accumulation in the IS of naïve T cells. Furthermore, the two forms of CD80 accumulated differently at the IS, the tailless CD80 was co-localized with the TCR while the full-length CD80 was segregated from the TCR. In addition, we show that CD80 and CD28 co-localized with PKCθ such that CD80 cytoplasmic domain also regulates PKCθ spatial localization.
Keywords: T cells, Costimulation
Introduction
CD80 and CD86 on antigen presenting cells (APCs) have the ability to augment T cell responses through interactions with CD28 (1) or inhibit T cell responses through interaction with CTLA-4 (2). The expression of CD80 and CD86 is largely restricted to professional APCs. While steady state DCs have low CD80 and CD86 expression and induce tolerance, these molecules are up-regulated on activated mature DC, which contribute to their potent capacity to prime naïve T cells (3), though they can also be inhibitory for cells expressing CTLA-4 (4). CD80 and CD86 are type I transmembrane proteins with two immunoglobulin-like domains each and short cytoplasmic domains. The cytoplasmic domain of CD80 has been implicated in effective signaling to T cells suggesting that active processes in the APC may contribute to the delivery of co-stimulatory signals (5). This is consistent with other evidence for an important role of the dendritic cell cytoskeleton in T cell stimulation (6–8).
CD28/CTLA-4 interaction with CD80/86 take place in the contact area between T cells and APC in parallel with T cell antigen receptor interaction with MHC-peptide complexes and LFA-1 interaction with ICAM-1 (9–11). In many situations a specialized pattern called the immunological synapse (IS) forms consisting of a central supermolecular activation cluster (cSMAC) containing TCR interacting with MHC-peptide complexes surrounded by a peripheral supermolecular activation cluster (pSMAC) containing LFA-1 and ICAM-1 interacting pairs (12, 13). PKCθ localizes in the cSMAC of the IS and has been used as a marker for the cSMAC (10, 13). PKCθ is required for normal activation of NF-κB and AP-1 transcription factors during T cell activation (14) and full activation of PKCθ depends upon CD28 engagement (15, 16). It is not known, however, if the cytoplasmic domain of CD80 controls the pattern of CD28, CTLA-4 or PKCθ in the IS.
CD28 is expressed on naïve and activated T cells (17). Upon ligation with CD80 or CD86, CD28 delivers a positive co-stimulatory signal (1, 18), enhancing the production of certain lymphokines such as IL-2 via transcriptional (19) and posttranscriptional mechanisms (20). It has also been shown to augment T cell activation by reducing the number of TCRs that must be triggered for T cell activation (21, 22). It has been demonstrated on planar bilayers that CD28 and CD80 engagement is localized to the cSMAC, and in the presence of peptide-MHC class II, CD80-CD28 engagement is increased suggesting that the establishment of the IS provides a microenvironment in which functional CD28-CD80 interactions are enhanced (9, 23). CD28 co-stimulation also stimulates cytoskeletal transport of molecular complexes toward the IS (24), enhances accumulation of lipid rafts in the vicinity of the IS (25), promotes formation of the IS (26) and increases the duration of Lck signaling in the IS (11). CD28 can accumulate in the IS without ligand, but only appears to signal when engaged by CD80 or CD86 (27).
CTLA-4 is an important inhibitory molecule, as exhibited by the lethal lymphoproliferative disease in CTLA4−/− mice (28, 29). CTLA-4 is not detected on the cell surface until 24 hour after T cell activation, peaking at 48–72 hours (2, 4, 17). CTLA-4 ligation by CD80 or CD86 antagonizes CD28 signals by blocking IL-2 gene transcription and prevents the entry of T cells into the cell cycle beyond G1/G0 leading to inhibition of T cell proliferation (4, 30). In addition, CTLA-4 inhibits proximal signaling through the TCR (31). CTLA-4 is localized in an intracellular pool in activated T cells and its recruitment to the IS is dependent on the strength of the TCR signal (10). CD28 and CTLA-4 each have low monovalent affinity for CD80 and CD86, but CTLA-4 may bind with higher avidity in the interface due to the ability of each CD28 dimer to bind one CD80/86, whereas each CTLA-4 homodimer can bind two CD80/86 (32, 33). This difference in binding avidity/stoichiometry may contribute to the ability of CTLA-4 to limit immune responses. CTLA-4 accumulation in the IS is completely dependent upon ligation by CD80 or CD86 (27).
To assess the importance of CD80 cytoplasmic tail in orchestrating a co-stimulatory response, we generated full-length CD80 (CD80FL) and cytoplasmic tail deleted CD80 (CD80TL) each tagged with yellow fluorescent protein (YFP) and expressed these in Chinese hamster ovary (CHO) cells with I-Ek and ICAM-1. We examined the functional responses of TCR transgenic naïve T cells to antigenic peptide pulsed CHO cells expressing CD80FL-YFP or CD80TL-YFP and found that the T cell proliferated more and made IL-2 earlier when the CD80 cytoplasmic tail was intact. To test the hypothesis whether this functional difference was due to changes in the organization of CD80 and its receptors in the IS we performed confocal imaging of T cell-APC interactions. We found that in naïve T cells CD80TL-YFP is recruited in a different pattern than CD80FL-YFP. CD80FL-YFP and its receptors accumulated in a pattern where they were segregated from the TCR in the cSMAC, while CD80TL-YFP and its receptors accumulated in a pattern co-localized with the TCR in the cSMAC. In addition, we found that PKCθ co-localized with CD80FL-YFP and CD28 in the cSMAC, not with the TCR. Thus, a previously unappreciated feature of CD80 is that it may function to segregate CD28 and CTLA-4 away from the TCR to create a distinct co-stimulation zone in the IS near the boundary between the cSMAC and the pSMAC.
Materials and Methods
Cells and Constructs
CHO cells transfected with I-Ek were kindly provided by Anton van der Merwe (Oxford University, UK) and Mark Davis (Standford University, Palo Alto, CA) (34). This CHO line expressed endogenous hamster ICAM-1 and I-Ek is selected with 400 μg /ml G418. CD80 was fused into eYFP N-1 vector (Clonetech, Palo Alto, CA) at sac II restriction enzyme site to generate in frame carboxy terminal YFP fusion constructs. The stop codon of CD80 molecule was removed by PCR and fused to the YFP cDNA sequence and subcloned into the pBudCE4.1 vector (Invitrogen, Carlsbad, CA). The primers used for this PCR were: 5′-CCCGCTATGGCTTGCAATTGTCAG-3′ and 5′-CCCGCGGAAGGAAGACGGTCTGTTCAG-3′. The CD80TL, the tail was removed where the transmembrane region ends at amino acid 275 via PCR with primers 5′-GCTAGAATTCGCTATGGCTTGCAATTGT-3′ and 5′-GCTACCTCGGGTGCTTACAGAAGCATTTG-3′, and fused in frame with 10 amino acid spacer to the eYFP. Following confirmation of DNA sequence, constructs were transfected into CHO cells using Lipofectamine 2000 (Invitrogen) CHO cells were cultured in RPMI1640 (Invitrogen) medium supplemented with 10% fetal bovine serum (FBS) (Hyclone, Logan, UT), Nonessential amino acids, L-Glutamate, Sodium Pyruvate (Cellgro, Herndon, VA). CD80FL is selected with 4 μg /ml zeocin and CD80TL is selected with 4 μg /ml of blasticitin. After stable CHO cell lines were established, they were sorted for various expression levels by the sorting facility at NYU.
Mice and T cell Activation
B10.A 5C.C7 TCR (Valpha11Vbeta3) transgenic mice were purchased from Taconic and bred and maintained in the NYU mouse facility. Mice were housed under specific pathogen-free conditions at the Skirball Institute animal care facility in accordance with IACUC guidelines. 5C.C7 T cells are activated by a peptide of moth cytochrome C (MCC 88-103) in the context of I-Ek. MCC 88-103 (ANERADLIAYLKQTK) was synthesized from Dana Farber peptide synthesis facility (Boston, MA). T cells were cultured in the medium described for CHO cells plus 2 μM of 2-mercaptoethanol (Sigma, St. Louis, MO).
Proliferation and Cytokine Assays
CHO cells were treated with mitomycin C (Sigma) at 0.1mg /1 × 106 CHO cells for 20 min at 37ºC and plated at 2 X 10⁴ cells / well (96 well flat bottom plates). MCC88-103 peptide was then added. Lymph nodes were obtained from 6–10 weeks old 5C.C7 TCR transgenic mice. RBCs were lysed using ACK buffer and CD4 T cells were negatively purified with anti-CD8 alpha (Ly2), anti-NK1.1 (DC5) and anti-MHC class II MAC beads (Miltenyi Biotech, Auburn, CA). Typical purities were greater than 90% CD4 positive T cells. T cells were plated at 1.5 X 10⁵ cells / well. After 48h of incubation, 10 μl of 3H thymidine 1μCi / well (General Electic-Amersham Biosciences, Piscataway, NJ) was added to each well and incubated for an additional 18 h before harvest with a 96 well Cell Harvester (Tomtec, Hamden, CT) and filter paper was analyzed by liquid scintillation for determination of the amount of incorporated radioactive counts.
For CFSE proliferation, purified T cells were washed twice in Hepes buffered saline and labeled with CFSE at 0.1μM / 107 T cells / ml (Invitrogen-Molecular Probes, Eugene, OR) for 10 min at room temperature. Labeling was quenched immediately by adding culture medium with 10% FBS. The cells were counted and used for proliferation assay as described above. The percentage of cells in each division was determined using a proliferation-fitting model from FlowJo. For restimulation assay, 5C.C7 purified naïve T cells were stimulated with CHO transfected with CD80FL with 100nM of MCC peptide in 96 well plate as described above. After 48 hrs, the T cells were ficolled and washed three times with media and plated in 24 well plate. After 4–5 days of resting, these T cells, termed primed T cells, were washed twice and used.
IL-2 and IFN-gamma cytokine capture kits (Miltenyi) were used to determine cytokine production by T cells, followed manufacturer’s instruction.
FACS Analysis, Antibodies and DC purification
Antibodies used: 14-4-4s, anti-CD28 and anti-CTLA-4 (BD Pharmingen, Mountain View, CA), 1610A (eBioscience, San Diego, CA), anti-PKCθ polyclonal antibody (Santa Cruz, Santa Cruz, CA), and anti-hamster ICAM-1 antibody (clone J5-3F9) kindly provided by V Kuchroo (35). Alexa 546 conjugated secondary goat anti-syrium hamster and goat anti-rabbit (Molecular Probes, Eugene OR); Cy5 conjugated goat anti-armenium hamster and anti-mouse (Jackson Immunoresearch Labs, West Grove, PA). D4 mAb was generously provided by Mark Davis (36). CD11c+ spleenic DCs were purified using CD11c beads (Miltenyi) and cultured overnight in the presence of 10 ng / ml LPS (Sigma) and 1 μg / ml of anti-CD40 (BD Pharmingen).
Fluorescence photobleaching recovery
CHO cells expression CD80FL or CD80FL-YFP were plated on a delta T dish and were labeled with Cy5 conjugated anti-CD80 antibody at 4ºC to limit internalization. Photobleaching was performed at 24ºC, and the fluorescence recovery monitored over a 200 second time interval to determine the percentage of lateral mobility of CD80FL versus CD80FL-YFP. CHO cells expressing CD80FL-YFP or CD80TL-YFP were plated on Delta-T dishes (Bioptechs, Butler, PA) and photobleaching of YFP was done at 37ºC. For photobleaching, areas on the cells were drawn for 50 ms of 633 nm or 25 ms of 514 nm laser power to bleach the fluorophores Cy5 and YFP, respectively. Within 1 second of bleaching, an image was acquired that could be used to determine the initial post-bleach intensity. A series of images was then acquired till the spot reached a steady state. The percentage of lateral mobility was calculated at [(prebleach intensity−final postbleach intensity)/(prebleach intensity−initial post-bleach intensity)]×100. The diffusion coefficients (D) were calculated using D = r2/ (4*τ), where τ is the half-time for recovery.
Fluorescence Microscopy and Image Analysis
For live cell images, purified naïve 5C.C7 T cells specific for I-Ek, H57-F(ab)-Alexa568 and H155-F(ab)-Cy5 (H57 and H155 are non-blocking antibodies to the TCR and LFA-1 respectively) were added to a monolayer of CHO plus I-Ek transfectants pulsed overnight with agonist MCC peptide 88-103. These interactions were imaged at 37ºC with in a 1:1 mixture of, Leibovitz’s L-15 medium (Invitrogen) and Ex-vivo 15 medium (Cambrex Bioscience, Frederick County, MD), and supplemented with non-essential amino acids, L-glutamine, and sodium pyruvate. Imaging experiments were performed with an objective heater (Bioptechs, Butler, PA).
For fixed cell images, cells were prepared as follow: after T cells-CHO cells interacted for 30 and 60 min at 37ºC and 5% CO2 in a Lab-Tek II Chamber #1.5 German Cover glass system, 8 well glass bottom slide (Nalge-Nunc, Rochester, NY), they were briefly washed with phosphate buffered saline (PBS) to wash away excessive T cells that did not form conjugate with the CHO cells. These cells were fixed with 4% methanol-free formaldehyde/PBS for 10 min (for permeabilized membrane) or 2% methanol-free formaldehyde/PBS for 2 min (for non-permeabilized membrane) at room temperature. The cells were washed three times with 1× HBSS and incubated with primary antibodies for 1 hr at room temperature, washed and followed by 2nd antibodies incubation for 1 hr at room temperature.
Images were taken with LSM 510 Laser Scanning Confocal Microscope (Carl Zeiss, Thornwood, NY) and 100X PLAN Apochromat objective having a numerical aperture of 1.4. Image stacks consisted of 8–15 planes space 0.48 um. The images were analyzed using the LSM and Volocity (Improvision, Lexington, MA) softwares. For 3D visualization of intercellular contacts only those complexes were taken into consideration whose contact areas were flat enough to be contained in a rectangular volume for an en face projection. Accumulated CD80 was considered a cluster when the ratio of fluorescence intensity at the area of interest was 1.5 times greater than the surrounding area. The threshold for the images was set where no CD80 accumulation was considered as background and was subtracted from the analysis.
Statistical method for analysis of contingency table
The observations from the experiments consisted of counts in the cells of a contingency table formed by the cross-classification of stimulus factors (experiment number, cell type and time point) and response factors (accumulation patterns). Stimulus factors had their marginal totals fixed in advance and the main interest was in the conditional probabilities of the response factor given the stimulus factors. The Poisson log-linear model allowed the modeling of multinomial data with multiplicative probability specification to be fitted and tested. The log-linear model consisted of main effects from each factor, first-order interactions from two factors and second-order interaction from three factors with sum-to-zero constraints to account for the many parameters. The models were focused on the evaluation of the effects of the stimulus factors on the response factors. All the stimulus factors and their interaction must be included for the analysis to respect the fixed totals over response factors and the main effect of response factors and interactions between the response and stimulus factors were selected into the model to see if the effects of factors and their interactions were enough to explain the observed data. The final model was reached when the Chi-square test showed the consistency between the observed data and the expected number from the model. Standard errors were calculated as: sqrt(p*(1−p)/n). Hypothesis testing was based on likelihood ratio tests following the central Chi-squared distribution with degrees of freedom determined by the model. All results reported in this paper were obtained using S-PLUS V,6.2 (general linear model command) (37, 38).
Results
Deletion of CD80 cytoplasmic tail decreased T cell proliferative response
The contribution of the cytoplasmic domain of CD80 in co-stimulation and formation of IS was studied using CHO cells as engineered APCs. CHO cells were chosen because they expressed endogenous hamster ICAM-1 to provide adhesion and no endogenous CD80. In naïve T cell proliferation assay, the addition of anti-hamster ICAM-1 antibody inhibited T cell proliferation stimulated by CHO cells transfected with I-Ek (data not shown). This is consistent with previous study where hamster ICAM-1 is able to induce costimulatory activity (35). We have generated CHO cells stably expressing I-Ek together with full-length CD80 (CD80FL), full-length CD80 with C-terminal YFP (CD80FL-YFP) or tailless CD80 with C-terminal YFP (CD80TL-YFP). These CHO cell lines were sorted by flow cytometry for equivalent expression levels of ICAM-1, I-Ek, and CD80 (Fig. 1A). The CD80 expression levels were similar to that of CD11c+, LPS activated spleen DCs (Fig. 1B). At 100 nM antigen dose, the loading efficiency of MCC88-103 peptide into CHO cell I-Ek was 1% based on staining with the MHC-peptide complex specific monoclonal antibody (mAb) D4 (data not shown).
FIGURE 1. Fusion of YFP to CD80 does not alter its function or membrane mobility.
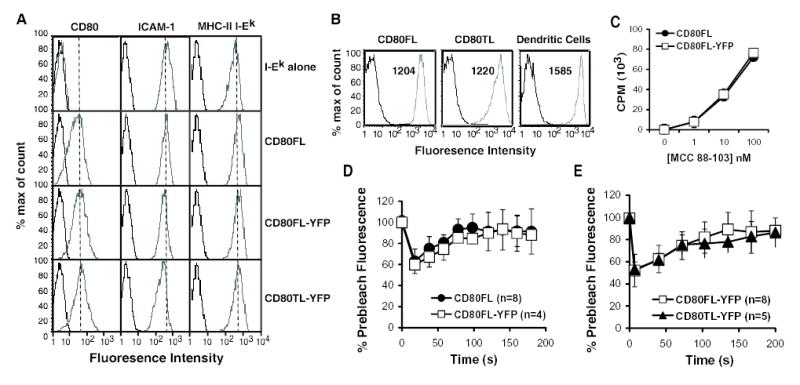
(A) FACS analysis of surface expression of CHO APCs. CHO cells lines: I-Ek-CHO, CD80FL-CHO, CD80FL-YFP-CHO and CD80TL-YFP-CHO were sorted to equivalent levels of expression for I-Ek, hamster ICAM-1 and variants of CD80. Anti-CD80, antihamster ICAM-1 and anti-I-Ek (grey line), control (black line). (B) CD80 expression level on CHO transfected cell lines and LPS activated CD11c+ DCs are equivalent. The number in the top of the FACS plot indicates the mean fluorescence intensity of CD80 staining. Spleenic DCs were purified using CD11c beads and stimulated overnight with 10 μg / ml of LPS and 1 μg / ml of anti-CD40 antibody. The DC populations displayed were gated on CD11c high cells. (C) The fusion of YFP to CD80 did not alter the ability of CD80 to co-stimulate T cell proliferative response. CHO transfectants of CD80FLCHO (solid circle) and CD80FL-YFP-CHO (open square). [3H] thymidine was added at 48 hr for 16 hr before harvesting. Error bars represent standard deviations from triplicate data sets. Data are representative of two independent experiments. (D) Fluorescence recovery after photobleaching at 24°C of CD80 versus CD80FL-YFP membrane mobility. CD80FL (solid circle) and CD80FL-YFP (open square). (E) Fluorescence recovery after photobleaching at 37°C of CD80FL-YFP (open circle) versus CD80TLYFP (solid triangle) membrane mobility. Number of cells = n. Data are representative of two independent experiments.
A comparison of CD80FL and CD80FL-YFP showed that CD80FL-YFP costimulated 5C.C7 T cell proliferation in a manner indistinguishable from wild type CD80FL (Fig. 1C). To directly test the effect of chimeric fusion of YFP to CD80 on lateral mobility of CD80 on CHO cells photobleaching recovery experiments were performed. The apparent half-time and fractional mobility were similar for CD80FL and CD80FL-YFP (Fig. 1D). Therefore, the attachment of YFP did not alter the function or mobility of full-length CD80.
We also characterized whether the removal of CD80 cytoplasmic tail, CD80TL-YFP, affected CD80 lateral mobility by fluorescence recovery after photobleaching. The removal of CD80 cytoplasmic tail did not alter the apparent half-time or fractional mobility (Fig. 1E). CD80FL-YFP and CD80TL-YFP had similar calculated coefficients, D = 0.027+/−0.0019 μm2/s and D = 0.021 +/−0.0013 μm2/s, respectively. Therefore, the cytoplasmic tail of CD80 does not appear to regulate its lateral mobility.
We compared the function of CD80FL-YFP and CD80TL-YFP using proliferation and cytokine production assays. CD80FL-YFP increased the amplitude of naïve 5C.C7 T cell proliferation at every peptide dose tested when compared CHO cells lacking any CD80. CD80TL-YFP was intermediate between CD80FL-YFP and no CD80 across the entire dose range. This hierarchy was observed in five independent experiments. CFSE dye dilution also showed a decreased number of naïve 5C.C7 T cells with 3 divisions in response to CD80TL-YFP CHO compared to CD80FL-YFP CHO cells when each were pulsed with 100 nM MCC88-103 (Fig. 2B). More naïve 5C.C7 T cells produced IL-2 when stimulated by I-Ek CHO cells expressing CD80FL-YFP than identically antigen pulsed cells expressing CD80TL-YFP at 8 hrs (Fig. 2C). CD80FL-YFP or CD80TL-YFP expressing I-Ek CHO stimulated similar levels of IL-2 by naïve T cells at 48 hours (data not shown). Thus, the cytoplasmic domain of CD80 regulates proliferation and early IL-2 production by naïve T cells.
FIGURE 2. CD80 cytoplasmic domain deletion decreased T cell proliferative response.
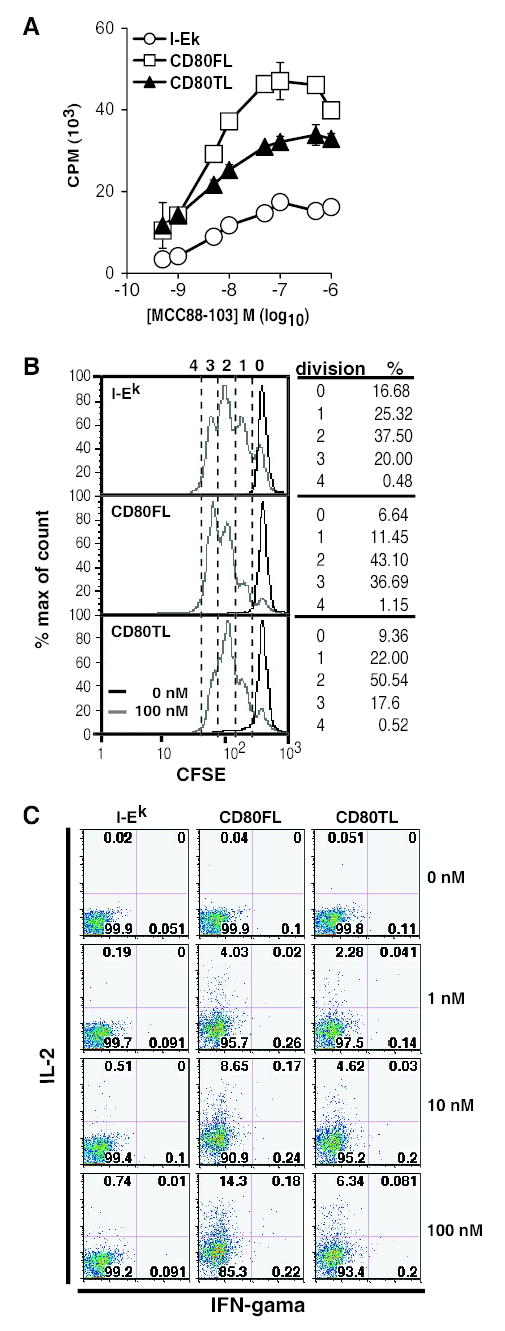
(A) CD80 cytoplasmic tail deletion affected naïve T cell proliferation. 1.5 × 10⁵ purified 5C.C7 TCR transgenic T cells in Rag−/− background were added to 2 × 10⁴ CHO transfectants. [3H] thymidine was added at 48 hr for 16 hr before harvesting. I-Ek-CHO (open circle), CD80FL-YFP-CHO (open square) and CD80TL-YFP-CHO (solid triangle). Data are representative of five independent experiments. Error bars represent standard deviations from triplicate data sets. (B) CFSE labeled 5C.C7 T cells were added to CHO transfectants pulsed with 100 nM of MCC peptide (grey line) or no peptide (black line) and analyzed by flow cytometry at 72 hr. Data are representative of two independent experiments. (C) IL-2 and IFN-gamma production by T cells costimulated with CHO transfectants. T cells were stained for cytokine production 8 hours after CHOT cell interactions. Data are representative of two independent experiments.
Recruitment of CD80 to the IS of Naïve T cells
The differences in activity of CD80FL-YFP and CD80TL-YFP in proliferation and IL-2 production by naïve T cells led us to examine their distribution in the IS. We used live cell confocal microscopy at 37ºC to examine the location of CD80, TCR and LFA-1 within stable interfaces formed between naïve 5C.C7 T cells and antigen pulsed I-Ek-CHO cells, CD80FL-YFP CHO cells or CD80TL-YFP CHO cells. We imaged stable IS defined as T cell-CHO cell interfaces present at 30–60 minutes after introduction of T cells where the T cell remained in place during the time required to obtain a complete confocal data set (~2 min) and had LFA-1 accumulation. TCRβ subunit was visualized with monovalent Alexa568 conjugated H57 Fab and LFA-1 with monovalent Cy5 conjugated H155 Fab, while CD80 was visualized using YFP fluorescence. We have previously shown that H57 and H155 Fab do not impair CD4+ T cell functional responses (39). Optical sections acquired at 0.48 μm intervals were reconstructed into 3D objects and rotated to obtain an en face view of the interface between T cell and CHO-APC. IS were further subdivided based on TCR accumulation in the cSMAC and LFA-1 accumulation in the pSMAC. In the absence of CD80, two patterns of TCR accumulation were observed: “multifocal”, with small TCR clusters throughout the interface (Fig. 3A), and “central”, with central TCR accumulation in the cSMAC (Fig. 3B). At 30 min, 74% of IS observed displayed multifocal TCR accumulation while only 26% displayed central TCR accumulation (Fig. 3C). In contrast, TCR was localized in a well-defined cSMAC in 100% of stable interactions in the presence of CD80FL-YFP or CD80TL-YFP. This result is consistent with earlier studies demonstrating a role for CD80 in establishing a central TCR cluster (24, 26, 40).
FIGURE 3. CD80-CD28 engagement facilitated TCR accumulation in the cSMAC.
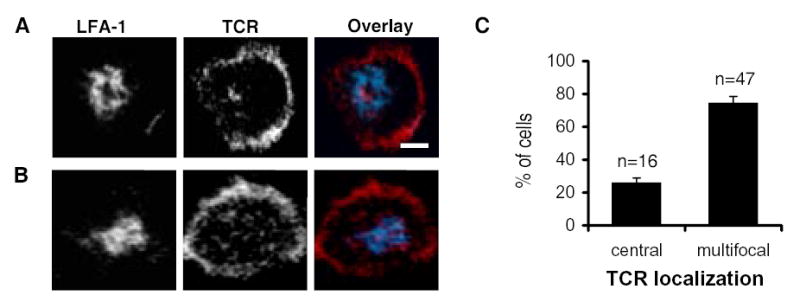
IS of I-Ek-CHO and naïve 5C.C7 T cells. The stable synapses exhibited both a central (A) and multifocal (B) TCR accumulation patterns in the IS. The color overlay images showed LFA-1 in blue and TCR in red. Images are 3-D reconstruction rotated in an en face view with T cell on top of the CHO cell. The white bar indicates a distance of 2 μm. (C) Quantitation of TCR localization in the absence of CD80. Counts were taken during a 30 min time frame of I-Ek-CHO and T cell interactions. The percentages of the cells observed with each pattern were the calculated mean of 3 independent experiments with a total of 63 cells. The error bar indicates the standard error mean.
To address the spatial localization of CD80FL-YFP and CD80TL-YFP, three accumulation patterns were scored on more than 50 live cell contacts in 3 independent experiments. En face views of LFA-1 and TCR fluorescence were used to identify the pSMAC and cSMAC of the stable IS. CD80 clusters segregated from the TCR cluster was scored as “segregated”; a single CD80 cluster co-localized with the TCR cluster was scored as “co-localized”; no CD80 clusters in the interface was scored as “none”. None may reflect no CD80 redistribution, or redistribution at a level that cannot be distinguished from stochastic fluctuations in CD80 density at the plasma membrane.
We observed that CD80FL-YFP localization was segregated from the TCR in 87% (standard error (se) = 4%) of stable IS (61–120 min) where individual clusters could be close to the TCR cluster, but did not overlap (Fig. 4A, C). In contrast, only 4% (se = 2%) of IS displayed a central cluster of CD80FL-YFP that co-localizing with the TCR. The CD80 accumulation was most visible after TCR clustered in the center of the IS. The percent of cells that have CD80FL-YFP clusters segregated from the TCR increased with time. CD80 accumulation in the interface was antigen driven because no CD80 accumulation was observed in the absence of MCC88-103 peptide in rare stable interfaces formed over a 4 hr observation period (data not shown).
FIGURE 4. CD80 cytoplasmic domain deletion resulted in decreased and differently localized CD80 recruitment to the IS with naïve T cells.
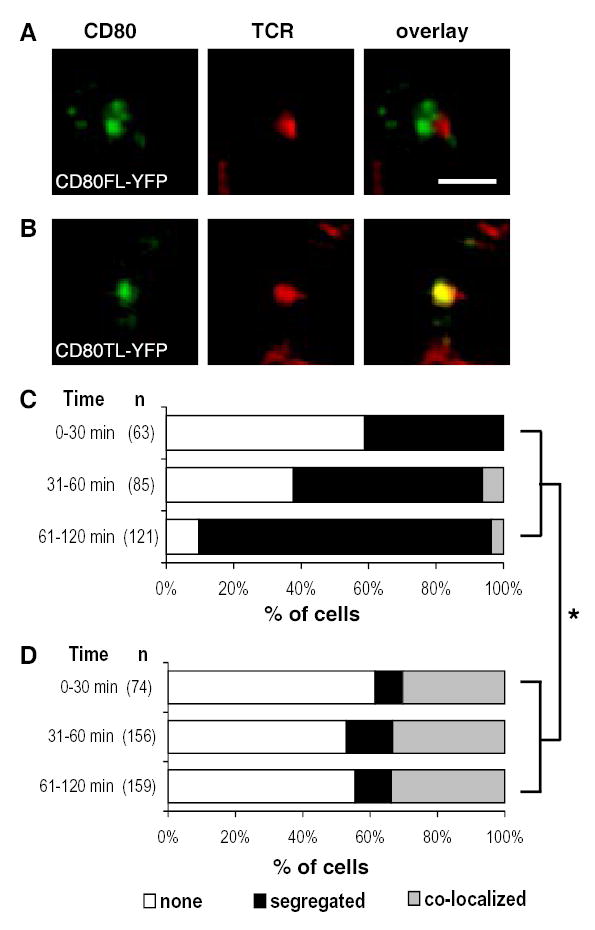
In the presence of 100 nM of MCC peptide, naïve 5C.C7 T cells and CHO cell interactions resulted in CD80FL-YFP and CD80TL-YFP molecules differentially accumulated in the IS. (A) CD80FL-YFP accumulation was segregated from the TCR at the interface of the IS while (B) CD80TL-YFP accumulation co-localized with the TCR in a central cluster in the IS. The color overlay images show TCR in red and CD80 in green. Areas of TCR and CD80 overlap are yellow. Images are cross-section of a 3-D plane rotated in an en face view with T cell on top of the CHO-APC. Scale bar = 2 μm. Quantitation of the accumulation patterns of CD80FL-YFP (C) versus CD80TL-YFP (D) in the IS over a 2 hour time course. No CD80 accumulation in the cSMAC (white), CD80 segregated from the TCR, segregation (black), and CD80 co-localized with the TCR in a central cluster, co-localized (grey). Only cells with an LFA-1 ring (pSMAC) were scored. The percentage of cells in each accumulation pattern represents the mean percentage of 3 independent experiments. The hypothesis that there was no association between cell type and pattern of accumulation was rejected with P-value less than 0.0001 (*) from the three experiments combined or each experiment individually and they each suggested significant association between cell types and patterns. The conditional independence between the “segregated” and “co-localized” and two cell types was also tested and rejected with P-value less than 0.0001 (whether or not the P-value was corrected for multiple testing).
In contrast, CD80TL-YFP tends to be co-clustered with the TCR in the cSMAC (Fig. 4B, D). At 30 minutes, no IS had yet accumulated CD80FL-YFP in a central cluster, but 30% (se=5%) of IS already had CD80TL-YFP accumulated in a central cluster. This trend continued for 2 hours. IS with CD80TL-YFP clusters segregated from the TCR were 3–4 fold less frequent than CD80FL-YFP clusters segregated from the TCR at all times. Thus, CD80TL-YFP appeared to cluster in a different pattern than CD80FL-YFP in the IS.
A striking difference between CD80FL-YFP and CD80TL-YFP was in the degree of detectable clusters. By 120 minutes 90% of IS has CD80FL-YFP clustered, while only 50% of IS had CD80TL-YFP clustered. This apparent decrease in CD80TL-YFP accumulation in the IS and differential accumulation patterns compared to CD80FL-YFP are correlated with the lower T cell proliferation and IL-2 production in response to CD80TL-YFP compared to CD80FL-YFP.
Statistical testing on the differences in the CD80 patterns of naïve T cell IS was performed to determine if these differences were significant. We considered the hypothesis that there was no association between CHO cell type and pattern of accumulation; this hypothesis was rejected with P-value less than 0.0001 from the three experiments combined (Fig. 4C vs. D are different with p < 0.0001). We also performed this test for each of the three experiments individually and they each yielded significant association between cell types and patterns. The distinction between “segregated” and “co-localized” patterns between CD80FL-YFP and CD80TL-YFP, independent of the “none” category, was also of interest to us, so the null hypothesis of conditional independence between the two patterns and two cell types was also tested. The null hypothesis was rejected with un-corrected P-value less than 0.0001 (corrected P-value is also less than 0.0001, where the correction is done for the multiple testing), so the patterns of “segregated” and “co-localized” differed significantly between CD80FL-YFP and CD80TL-YFP at all times.
Segregation of CD80 and TCR in the IS of previously activated primary T cell
We next examined patterns of TCR and CD80 accumulation during re-stimulation of 5C.C7 T cells after primary stimulation with CHO cells expressing I-Ek and CD80FL-YFP. Here we also observed different patterns of accumulation between CD80FL-YFP (Fig. 5A, C) and CD80TL-YFP (Fig. 5B, C). The more prominent CD80 clusters with primed T cells were likely due to the higher levels of CD28 and CTLA-4 expression on activated T cells (4, 41, 42). In addition, the accumulation pattern of CD80FL-YFP appeared to form a partial ring around the central TCR accumulation.
Figure 5. CD80 cytoplasmic domain regulated CD80 segregation from the TCR in previously activated primary CD4 T cell.
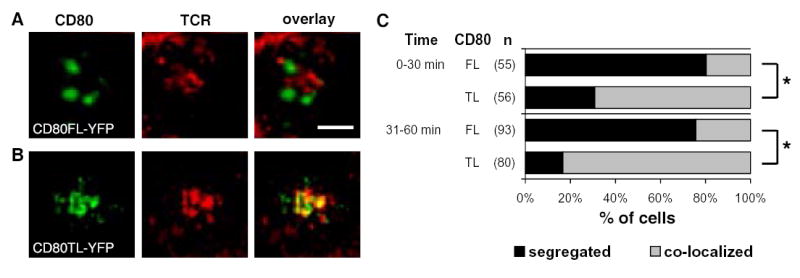
IS of CHO pulsed with 100 nM MCC peptide and previously activated primary 5C.C7 T cells. (A) CD80FL-YFP. (B) CD80TL-YFP. Images were acquired at 37°C. The color overlay images showed TCR in red and CD80 in green. Areas of TCR and CD80 overlap are yellow. Images are cross-section of a 3-D plane rotated in an en face view with T cell on top of the CHO-APC. Scale bar = 2 μm. (C) Quantification of the accumulation patterns of CD80FL-YFP (FL) versus CD80TL-YFP (TL). CD80 segregated from the TCR, segregation (black bar), and CD80 co-localized with the TCR in a central cluster, co-localized (grey bar). The percentage of cells in each accumulation pattern represents the mean percentage of 2 independent experiments. The p value for the statistical analysis is less then 0.0001 (*).
In contrast to naïve T cells, previously activated primary T cells have similar pattern of distribution for the different time points studied, suggesting that the accumulation of CD80 takes place faster with previously activated T cells. We summarize the 0–30 minute time point here. CD80FL-YFP clusters segregated from the TCR in 76% (se=10%) of IS and co-localized with the TCR in 24% (se=10%) of IS. In contrast, CD80TL-YFP clusters segregated from the central TCR in 28% (se=7%) and co-localized with the TCR in 72% (se=7%) of IS (Fig. 5C). For this dataset, the test for independence between accumulation patterns and the cell types also suggested that there was a significant increased association of “segregated” and “co-localized” patterns with CD80FL-YFP and CD80TL-YFP CHO cells, respectively with a P-value less than 0.0001 (Fig. 5C). These data suggested that the cytoplasmic tail of CD80 played a role in orchestrating the spatial localization of CD80 on the APC side of the IS.
CD28 and CTLA-4 spatial accumulation in the IS are regulated by CD80
To delineate the relationship of CD80 accumulation pattern to potential receptor interactions, we examined the accumulation of CD28 and CTLA-4 in the naïve T cell IS by fixed-cell immunofluorescence staining and 3D confocal microscopy. At 30 minutes CD28 clusters co-localized with CD80FL-YFP (Fig. 6A) and CD80TL-YFP (Fig. 6B) based on examination of red/green pseudo-colored images that showed extensive yellow areas on merging. At the 30 minutes time point, CTLA-4 staining was not detected with naïve 5C.C7 T cells (data not shown).
FIGURE 6. CD80 cytoplasmic domain regulated both CD28 and CTLA-4 segregation from the TCR.

Both naïve and previously activated primary 5C.C7 T cells were stimulated CD80FLYFP or CD80TL-YFP CHO pulsed with 100 nM MCC88-103 peptide. Cells were fixed after T-CHO cells had been interacting for 30 min at 37°C. At this time point, CTLA-4 was not detected on naïve T cells. The color overlay images show CTLA-4 in red, CD28 in red and CD80 in green. The white dashed line represents the outer boundary of the T cell. Images are cross-section of a 3-D plane rotated to en face view. Scale bar = 2 μm. The localization of CD80FL (A) and CD80TL (B) modulated the localization of CD28 respect to CD80 in the IS of naive T cells. The localization of CD80FL-YFP (C) and CD80TL-YFP (D) modulated the localization of CD28 and CTLA-4 respect to CD80 in the IS of previously activated primary T cells. d6-d8 5C.C7 T cells were used.
Localization of CD28, CTLA-4, CD80FL-YFP and CD80TL-YFP was examined in previously activated T cell. In fixed-cell imaging, CD80FL-YFP, CD28 and CTLA-4 accumulated in a ring-like pattern in previously activated T cell IS. However, CD28 and CTLA-4 accumulation patterns were only partly co-localized in the IS. CTLA-4 was consistently localized toward the center of the CD80FL-YFP ring, while CD28 was localized toward the periphery of this ring. CD80TL-YFP localized in a single central cluster in which components of CD28 and CTLA-4 in the IS were highly co-localized. Overall, the accumulation of CD28 and CTLA-4 followed the accumulation pattern of CD80 whether CD80 is in a ring-like structure or in a central cluster. When the cells were fixed using a permeabilized condition, previously activated T cells contained CTLA-4 in intracellular membranes that was polarized to the interface in response to IS formation in addition to CTLA-4 that was in the IS itself. These two locations of CTLA-4 were distinguished by generating 3D volumes and rotating between en face and side views (Supplemental movie 1).
PKCθ co-localized with CD28 and CD80 in the cSMAC
We next determined the location of PKCθ. PKCθ was detected by immunofluorescence staining of activated 5C.C7 T cells forming IS with MCC pulsed I-Ek CHO cells expressing CD80FL-YFP or CD80TL-YFP. PKCθ was co-localized with CD28 and CD80FL-YFP (Fig. 7A) or CD80TL-YFP (Fig. 7B) at 30 minutes. As shown in Fig. 7C, greater than 80% of PKCθ co-localized with CD80 and CD28, and less than 10% of the cells analyzed did not have detectable PKCθ clusters. Thus, by definition, the ring of CD80FL-YFP, CD28 and CTLA-4 is part of the cSMAC even through it is segregated from TCR.
Figure 7. PKCθ co-localized with CD28 in the IS.
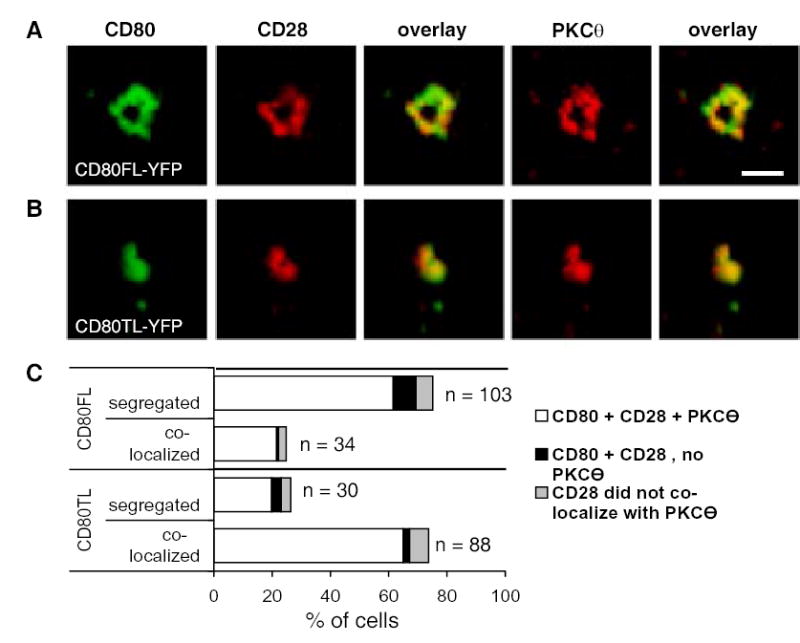
Recruitment of PKCθ to the cSMAC appears to be spatially regulated by CD80. Cells were fixed after T-CHO cells had been interacting for 30 min at 37°C. The color overlay images show CD80 in green, CD28 and PKCθ in red. (A) PKCθ localization in the presence of CD80FL-YFP. (B) PKCθ localization in the presence of CD80TL-YFP. (C) quantitation of PKCθ localization in the cSMAC with respect to CD80FL-YFP versus CD80TL-YFP. Segregated and co-localized at the graph legend are categories representing the spatial localization of CD80. White bar represents colocalization of CD80, CD28 and PKCθ. Black bar represents absence of PKCθ. Grey bar represents cells that did not have CD28 and PKCθ colocalized. Data represent 2 independent experiments.
Discussion
We demonstrate here that the cytoplasmic domain of CD80 regulates both its potency as a co-stimulator and the localization of co-stimulatory receptors in the IS when cellular APCs were utilized. Bromley et al. had demonstrated that CD80-CD28 interactions are located in the cSMAC of naïve T cell IS when supported planar bilayers were used to present agonist MHC-peptide complexes, ICAM-1 and CD80, all of which were freely mobile (9). In contrast, the use of CHO cells expressing agonist MHC-peptide complexes, endogenous ICAM-1 and fluorescent protein tagged CD80 with and without an intact cytoplasmic domain, revealed that the APC has an active role in determining the pattern of co-stimulatory receptors in the IS through CD80. The intact cytoplasmic domain of CD80 promoted segregation of itself, CD28 and CTLA-4 from the TCR in the cSMAC.
An earlier study on cytoplasmic domain-deficient human CD80 demonstrated that CHO cells expressing tailless CD80 were inactive in providing co-stimulation for anti-CD3 induced proliferation of peripheral blood T cells whereas CHO cells expressing full-length CD80 provided effective co-stimulation (5). Using CHO cells presenting agonist MHC-peptide complexes to antigen specific T cells we found quantitative differences between CHO cells expressing CD80 with and without the cytoplasmic domain. Although we did not see a null function for CD80TL-YFP, the differences between results of Doty and Clark and our study likely arise from differences between the anti-CD3 and agonist MHC-peptide driven responses or CD80 expression level. Doty and Clark did note that the tailless CD80 gained co-stimulatory activity when expressed at higher levels. The relative levels of CD80 expression on APC are determined by the activation status of the APC, which is influenced by components of innate and acquired immune systems. We chose a CD80 expression level similar to in vitro LPS and anti-CD40 activated dendritic cells (Fig. 1B). Therefore, it is unlikely that the effects we observed are related to over-expression of CD80.
CD28 is the receptor that transduces positive signals after ligation with CD80 or CD86. With naïve 5C.C7 T cells, CD80 with or without the cytoplasmic domain contributed to IS formation, but CD80TL-YFP was co-localized with TCR and CD28 in the cSMAC, whereas CD80FL-YFP and CD28 were segregated from the central TCR cluster in the cSMAC. PKCθ staining revealed that this segregated CD28 and CD80FL-YFP are part of the cSMAC. This demonstrates that the organization of TCR and CD28-CTLA-4-CD80 complexes in the IS can be actively regulated by the APC through the cytoplasmic domain of CD80.
It has been shown that T cells can integrate antigen receptor and co-stimulatory signals when the agonist MHC-peptide complex and CD80 are presented on different cells (trans-costimulation) (43, 44). This is consistent with our findings that CD28-CD80 interactions do not need to be co-localized with TCR-MHC-peptide interactions in the IS. Not only can CD28-CD80 interactions facilitate the extracellular TCR-MHC-peptide interaction, CD28 can enhance signaling through interactions of the cytoplasmic domain polyproline motif with the SH3 domain of Lck (11). CD28 also may directly activate PKCθ (16, 45). Huang et al previously showed that recruitment of PKCθ to the cSMAC was dependent upon CD28 engagement (16, 45), but CD28 and TCR were co-localized with the APC used in this study. We have taken advantage of the observation that CD28 is segregated from the TCR by CD80FL-YFP to demonstrate that PKCθ is recruited to the cSMAC by CD28, not the TCR. Both CD80FL-YFP and CD80TL-YFP facilitated PKCθ recruitment to the cSMAC. Some IS lacked PKCθ, which may have already been degraded by 30 minutes (46). Perhaps it is important for CD28-CD80FL-YFP complexes to segregate from the TCR in the cSMAC, a site which has been associated with downregulation of signaling (47, 48). Positioning active CD28 in a ring outside the center of the cSMAC may allow CD28 to sustain signaling, where as this ability may be compromised when CD28-CD80TL-YFP is co-localized with inactive TCR in the cSMAC.
Our imaging results suggest a possible explanation of how CD80FL-YFP and CD80TL-YFP may function differently. Both live and fixed cell images showed CD80FL-YFP segregation from the TCR. Although CD28 and CTLA-4 did not appear to be completely co-localized with CD80FL-YFP in the IS at the time points studied, it is possible that ligand binding is not absolutely required for CD80 recruitment to the synapse, but it facilitated its concentration there. In contrast, CD80TL-YFP was localized in the cSMAC with both CD28 and CTLA-4, and the TCR-MHC-peptide interactions. The juxtaposition of the engaged TCR and CTLA-4 by CD80TL-YFP may enhance the negative impact of CTLA-4 by allowing CTLA-4 associated phosphatases access to both the CD28 and TCR signaling process (31, 49). Full-length CD80 may limit the formation of molecular complexes between CTLA-4 and the TCR (50) by physically segregating CTLA-4 from the TCR. Together these data suggests that the regulation of CTLA-4 spatial localization by CD80 may have a functional effect.
Previous work has shown that the active role of APC in the formation of the immunological synapse varies with the cell type. B cell lines used in many studies can be treated with cytochalasin D and other cytoskeletal inhibitors without altering efficiency of antigen presentation (51). This contrasts with results for dendritic cells where cytochalasin D reduces the efficiency of antigen presentation (6) and the inability of Rac1/2−/− DCs to activate T cells due to cytoskeletal defect (8). While CHO cells have been used widely as model APC, there are no studies that have addressed the role of the CHO cell cytoskeleton in antigen presentation. Egan et al. demonstrated that CTLA-4 is recruited to the cSMAC in response to agonist MHC-peptide complexes on the surface of a B cell line (10). We concur with Egan et al that CTLA-4 is recruited to the IS in response to agonist MHC-peptide stimulation of previously activated T cells, but only observed CTLA-4 predominantly in the central cluster co-localizing with the TCR with CD80TL-YFP, not with CD80FL-YFP. This may suggest a difference between CHO cells and B cell lines used by Egen et al. Our results indicate that the CD80 cytoplasmic domain is utilized by APC to segregate most of the engaged CD28 and CTLA-4 from the TCR in the cSMAC, which implies a specific cytoskeletal contribution in CHO cells. The wide application of CHO cells as effective surrogate APC suggests that they have the ability to effectively present a spectrum of adhesion and co-stimulatory ligands (24, 52–55). We believe it is likely that the CD80 cytoplasmic domain-dependent mechanism revealed in our experiments is relevant to other professional APC where the cytoskeleton has been shown to play a role in antigen presentation, including DCs. It is possible that APCs may be able to selectively alter this CD80 tail-dependent segregation process depending on parameters such as the maturation state and the local inflammatory milieu.
Supplementary Material
Acknowledgments
We thank Rajat Varma and Guy Shakhar for advice on image analysis. We acknowledge the NYU Cancer Institute Biostatistics shared Core facility. We thank M. Davis and V. Kuchroo for valuable reagents.
Footnotes
This work was supported by NIH grant AI43542 and GM64900 to M.L.D. Irene Diamond Foundation supports MLD.
Abbreviations used in this paper: IS, immunological synapse; YFP, yellow fluorescent protein.
References
- 1.Linsley PS, Brady W, Grosmaire L, Aruffo A, Damle NK, Ledbetter JA. Binding of the B cell activation antigen B7 to CD28 costimulates T cell proliferation and interleukin 2 mRNA accumulation. J Exp Med. 1991;173:721. doi: 10.1084/jem.173.3.721. [DOI] [PMC free article] [PubMed] [Google Scholar]
- 2.Thompson CB, Allison JP. The emerging role of CTLA-4 as an immune attenuator. Immunity. 1997;7:445. doi: 10.1016/s1074-7613(00)80366-0. [DOI] [PubMed] [Google Scholar]
- 3.Banchereau J, Steinman RM. Dendritic cells and the control of immunity. Nature. 1998;392:245. doi: 10.1038/32588. [DOI] [PubMed] [Google Scholar]
- 4.Walunas TL, Lenschow DJ, Bakker CY, Linsley PS, Freeman GJ, Green JM, Thompson CB, Bluestone JA. CTLA-4 can function as a negative regulator of T cell activation. Immunity. 1994;1:405. doi: 10.1016/1074-7613(94)90071-x. [DOI] [PubMed] [Google Scholar]
- 5.Doty RT, Clark EA. Subcellular localization of CD80 receptors is dependent on an intact cytoplasmic tail and is required for CD28-dependent T cell costimulation. J Immunol. 1996;157:3270. [PubMed] [Google Scholar]
- 6.Al-Alwan MM, Rowden G, Lee TD, West KA. The dendritic cell cytoskeleton is critical for the formation of the immunological synapse. J Immunol. 2001;166:1452. doi: 10.4049/jimmunol.166.3.1452. [DOI] [PubMed] [Google Scholar]
- 7.Al-Alwan MM, Liwski RS, Haeryfar SM, Baldridge WH, Hoskin DW, Rowden G, West KA. Cutting edge: dendritic cell actin cytoskeletal polarization during immunological synapse formation is highly antigendependent. J Immunol. 2003;171:4479. doi: 10.4049/jimmunol.171.9.4479. [DOI] [PubMed] [Google Scholar]
- 8.Benvenuti F, Hugues S, Walmsley M, Ruf S, Fetler L, Popoff M, Tybulewicz VL, Amigorena S. Requirement of Rac1 and Rac2 expression by mature dendritic cells for T cell priming. Science. 2004;305:1150. doi: 10.1126/science.1099159. [DOI] [PubMed] [Google Scholar]
- 9.Bromley SK, Iaboni A, Davis SJ, Whitty A, Green JM, Shaw AS, Weiss A, Dustin ML. The immunological synapse and CD28-CD80 interactions. Nat Immunol. 2001;2:1159. doi: 10.1038/ni737. [DOI] [PubMed] [Google Scholar]
- 10.Egen JG, Allison JP. Cytotoxic T lymphocyte antigen-4 accumulation in the immunological synapse is regulated by TCR signal strength. Immunity. 2002;16:23. doi: 10.1016/s1074-7613(01)00259-x. [DOI] [PubMed] [Google Scholar]
- 11.Holdorf AD, Lee KH, Burack WR, Allen PM, Shaw AS. Regulation of Lck activity by CD4 and CD28 in the immunological synapse. Nat Immunol. 2002;3:259. doi: 10.1038/ni761. [DOI] [PubMed] [Google Scholar]
- 12.Dustin ML, Olszowy MW, Holdorf AD, Li J, Bromley S, Desai N, Widder P, Rosenberger F, van der Merwe PA, Allen PM, Shaw AS. A novel adaptor protein orchestrates receptor patterning and cytoskeletal polarity in T-cell contacts. Cell. 1998;94:667. doi: 10.1016/s0092-8674(00)81608-6. [DOI] [PubMed] [Google Scholar]
- 13.Monks CR, Freiberg BA, Kupfer H, Sciaky N, Kupfer A. Threedimensional segregation of supramolecular activation clusters in T cells. Nature. 1998;395:82. doi: 10.1038/25764. [DOI] [PubMed] [Google Scholar]
- 14.Sun Z, Arendt CW, Ellmeier W, Schaeffer EM, Sunshine MJ, Gandhi L, Annes J, Petrzilka D, Kupfer A, Schwartzberg PL, Littman DR. PKC-theta is required for TCR-induced NF-kappaB activation in mature but not immature T lymphocytes. Nature. 2000;404:402. doi: 10.1038/35006090. [DOI] [PubMed] [Google Scholar]
- 15.Coudronniere N, Villalba M, Englund N, Altman A. NF-kappa B activation induced by T cell receptor/CD28 costimulation is mediated by protein kinase C-theta. Proceedings of the National Academy of Sciences of the United States of America. 2000;97:3394. doi: 10.1073/pnas.060028097. [DOI] [PMC free article] [PubMed] [Google Scholar]
- 16.Huang J, Lo PF, Zal T, Gascoigne NR, Smith BA, Levin SD, Grey HM. CD28 plays a critical role in the segregation of PKC theta within the immunologic synapse. Proceedings of the National Academy of Sciences of the United States of America. 2002;99:9369. doi: 10.1073/pnas.142298399. [DOI] [PMC free article] [PubMed] [Google Scholar]
- 17.Linsley PS, Greene JL, Tan P, Bradshaw J, Ledbetter JA, Anasetti C, Damle NK. Coexpression and functional cooperation of CTLA-4 and CD28 on activated T lymphocytes. J Exp Med. 1992;176:1595. doi: 10.1084/jem.176.6.1595. [DOI] [PMC free article] [PubMed] [Google Scholar]
- 18.Harding FA, McArthur JG, Gross JA, Raulet DH, Allison JP. CD28-mediated signalling co-stimulates murine T cells and prevents induction of anergy in T-cell clones. Nature. 1992;356:607. doi: 10.1038/356607a0. [DOI] [PubMed] [Google Scholar]
- 19.Fraser JD, Irving BA, Crabtree GR, Weiss A. Regulation of interleukin-2 gene enhancer activity by the T cell accessory molecule CD28. Science. 1991;251:313. doi: 10.1126/science.1846244. [DOI] [PubMed] [Google Scholar]
- 20.Lindstein T, June CH, Ledbetter JA, Stella G, Thompson CB. Regulation of lymphokine messenger RNA stability by a surface-mediated T cell activation pathway. Science. 1989;244:339. doi: 10.1126/science.2540528. [DOI] [PubMed] [Google Scholar]
- 21.Viola A, Lanzavecchia A. T cell activation determined by T cell receptor number and tunable thresholds.[see comment] Science. 1996;273:104. doi: 10.1126/science.273.5271.104. [DOI] [PubMed] [Google Scholar]
- 22.Bachmann MF, McKall-Faienza K, Schmits R, Bouchard D, Beach J, Speiser DE, Mak TW, Ohashi PS. Distinct roles for LFA-1 and CD28 during activation of naive T cells: adhesion versus costimulation. Immunity. 1997;7:549. doi: 10.1016/s1074-7613(00)80376-3. [DOI] [PubMed] [Google Scholar]
- 23.Andres PG, Howland KC, Dresnek D, Edmondson S, Abbas AK, Krummel MF. CD28 signals in the immature immunological synapse. J Immunol. 2004;172:5880. doi: 10.4049/jimmunol.172.10.5880. [DOI] [PubMed] [Google Scholar]
- 24.Wulfing C, Davis MM. A receptor/cytoskeletal movement triggered by costimulation during T cell activation. Science. 1998;282:2266. doi: 10.1126/science.282.5397.2266. [DOI] [PubMed] [Google Scholar]
- 25.Viola A, Schroeder S, Sakakibara Y, Lanzavecchia A. T lymphocyte costimulation mediated by reorganization of membrane microdomains. Science. 1999;283:680. doi: 10.1126/science.283.5402.680. [DOI] [PubMed] [Google Scholar]
- 26.Wulfing C, Sumen C, Sjaastad MD, Wu LC, Dustin ML, Davis MM. Costimulation and endogenous MHC ligands contribute to T cell recognition. Nat Immunol. 2002;3:42. doi: 10.1038/ni741. [DOI] [PubMed] [Google Scholar]
- 27.Pentcheva-Hoang T, Egen JG, Wojnoonski K, Allison JP. B7-1 and B7-2 selectively recruit CTLA-4 and CD28 to the immunological synapse. Immunity. 2004;21:401. doi: 10.1016/j.immuni.2004.06.017. [DOI] [PubMed] [Google Scholar]
- 28.Waterhouse P, Penninger JM, Timms E, Wakeham A, Shahinian A, Lee KP, Thompson CB, Griesser H, Mak TW. Lymphoproliferative disorders with early lethality in mice deficient in Ctla-4. Science. 1995;270:985. doi: 10.1126/science.270.5238.985. [DOI] [PubMed] [Google Scholar]
- 29.Tivol EA, Borriello F, Schweitzer AN, Lynch WP, Bluestone JA, Sharpe AH. Loss of CTLA-4 leads to massive lymphoproliferation and fatal multiorgan tissue destruction, revealing a critical negative regulatory role of CTLA-4. Immunity. 1995;3:541. doi: 10.1016/1074-7613(95)90125-6. [DOI] [PubMed] [Google Scholar]
- 30.Krummel MF, Allison JP. CTLA-4 engagement inhibits IL-2 accumulation and cell cycle progression upon activation of resting T cells. J Exp Med. 1996;183:2533. doi: 10.1084/jem.183.6.2533. [DOI] [PMC free article] [PubMed] [Google Scholar]
- 31.Marengere LE, Waterhouse P, Duncan GS, Mittrucker HW, Feng GS, Mak TW. Regulation of T cell receptor signaling by tyrosine phosphatase SYP association with CTLA-4. Science. 1996;272:1170. doi: 10.1126/science.272.5265.1170. [DOI] [PubMed] [Google Scholar]
- 32.van der Merwe PA, Bodian DL, Daenke S, Linsley P, Davis SJ. CD80 (B7-1) binds both CD28 and CTLA-4 with a low affinity and very fast kinetics. J Exp Med. 1997;185:393. doi: 10.1084/jem.185.3.393. [DOI] [PMC free article] [PubMed] [Google Scholar]
- 33.Evans EJ, Esnouf RM, Manso-Sancho R, Gilbert RJ, James JR, Yu C, Fennelly JA, Vowles C, Hanke T, Walse B, Hunig T, Sorensen P, Stuart DI, Davis SJ. Crystal structure of a soluble CD28-Fab complex.[see comment] Nature Immunology. 2005;6:271. doi: 10.1038/ni1170. [DOI] [PubMed] [Google Scholar]
- 34.Wettstein DA, Boniface JJ, Reay PA, Schild H, Davis MM. Expression of a class II major histocompatibility complex (MHC) heterodimer in a lipid-linked form with enhanced peptide/soluble MHC complex formation at low pH. Journal of Experimental Medicine. 1991;174:219. doi: 10.1084/jem.174.1.219. [DOI] [PMC free article] [PubMed] [Google Scholar]
- 35.Gaglia JL, Mattoo A, Greenfield EA, Freeman GJ, Kuchroo VK. Characterization of endogenous Chinese hamster ovary cell surface molecules that mediate T cell costimulation. Cellular Immunology. 2001;213:83. doi: 10.1006/cimm.2001.1867. [DOI] [PubMed] [Google Scholar]
- 36.Baldwin KK, Reay PA, Wu L, Farr A, Davis MM. A T cell receptor-specific blockade of positive selection. Journal of Experimental Medicine. 1999;189:13. doi: 10.1084/jem.189.1.13. [DOI] [PMC free article] [PubMed] [Google Scholar]
- 37.Venables WN a R B D. Modern applied statistics with S-PLUS. Springer; 1999. [Google Scholar]
- 38.Dobson AJ. An introduction to generalized linear models. Chapman and Hall; 1990. [Google Scholar]
- 39.Johnson KG, Bromley SK, Dustin ML, Thomas ML. A supramolecular basis for CD45 tyrosine phosphatase regulation in sustained T cell activation. Proceedings of the National Academy of Sciences of the United States of America. 2000;97:10138. doi: 10.1073/pnas.97.18.10138. [DOI] [PMC free article] [PubMed] [Google Scholar]
- 40.Wetzel SA, McKeithan TW, Parker DC. Live-cell dynamics and the role of costimulation in immunological synapse formation. J Immunol. 2002;169:6092. doi: 10.4049/jimmunol.169.11.6092. [DOI] [PubMed] [Google Scholar]
- 41.Turka LA, Ledbetter JA, Lee K, June CH, Thompson CB. CD28 is an inducible T cell surface antigen that transduces a proliferative signal in CD3+ mature thymocytes. J Immunol. 1990;144:1646. [PubMed] [Google Scholar]
- 42.Yokoyama WM, Koning F, Kehn PJ, Pereira GM, Stingl G, Coligan JE, Shevach EM. Characterization of a cell surface-expressed disulfidelinked dimer involved in murine T cell activation. J Immunol. 1988;141:369. [PubMed] [Google Scholar]
- 43.Ding L, Shevach EM. Activation of CD4+ T cells by delivery of the B7 costimulatory signal on bystander antigen-presenting cells (transcostimulation) Eur J Immunol. 1994;24:859. doi: 10.1002/eji.1830240413. [DOI] [PubMed] [Google Scholar]
- 44.Mandelbrot DA, Kishimoto K, Auchincloss H, Jr, Sharpe AH, Sayegh MH. Rejection of mouse cardiac allografts by costimulation in trans. J Immunol. 2001;167:1174. doi: 10.4049/jimmunol.167.3.1174. [DOI] [PubMed] [Google Scholar]
- 45.Bi K, Tanaka Y, Coudronniere N, Sugie K, Hong S, van Stipdonk MJ, Altman A. Antigen-induced translocation of PKC-theta to membrane rafts is required for T cell activation. Nature Immunology. 2001;2:556. doi: 10.1038/88765. [DOI] [PubMed] [Google Scholar]
- 46.Heissmeyer V, Macian F, Im SH, Varma R, Feske S, Venuprasad K, Gu H, Liu YC, Dustin ML, Rao A. Calcineurin imposes T cell unresponsiveness through targeted proteolysis of signaling proteins.[see comment] Nature Immunology. 2004;5:255. doi: 10.1038/ni1047. [DOI] [PubMed] [Google Scholar]
- 47.Lee KH, Holdorf AD, Dustin ML, Chan AC, Allen PM, Shaw AS. T cell receptor signaling precedes immunological synapse formation. Science. 2002;295:1539. doi: 10.1126/science.1067710. [DOI] [PubMed] [Google Scholar]
- 48.Lee KH, Dinner AR, Tu C, Campi G, Raychaudhuri S, Varma R, Sims TN, Burack WR, Wu H, Wang J, Kanagawa O, Markiewicz M, Allen PM, Dustin ML, Chakraborty AK, Shaw AS. The immunological synapse balances T cell receptor signaling and degradation.[see comment] Science. 2003;302:1218. doi: 10.1126/science.1086507. [DOI] [PubMed] [Google Scholar]
- 49.Chikuma S, Imboden JB, Bluestone JA. Negative regulation of T cell receptor-lipid raft interaction by cytotoxic T lymphocyte-associated antigen 4. J Exp Med. 2003;197:129. doi: 10.1084/jem.20021646. [DOI] [PMC free article] [PubMed] [Google Scholar]
- 50.Lee KM, Chuang E, Griffin M, Khattri R, Hong DK, Zhang W, Straus D, Samelson LE, Thompson CB, Bluestone JA. Molecular basis of T cell inactivation by CTLA-4. Science. 1998;282:2263. doi: 10.1126/science.282.5397.2263. [DOI] [PubMed] [Google Scholar]
- 51.Wulfing C, Sjaastad MD, Davis MM. Visualizing the dynamics of T cell activation: intracellular adhesion molecule 1 migrates rapidly to the T cell/B cell interface and acts to sustain calcium levels. Proceedings of the National Academy of Sciences of the United States of America. 1998;95:6302. doi: 10.1073/pnas.95.11.6302. [DOI] [PMC free article] [PubMed] [Google Scholar]
- 52.Latchman Y, Wood CR, Chernova T, Chaudhary D, Borde M, Chernova I, Iwai Y, Long AJ, Brown JA, Nunes R, Greenfield EA, Bourque K, Boussiotis VA, Carter LL, Carreno BM, Malenkovich N, Nishimura H, Okazaki T, Honjo T, Sharpe AH, Freeman GJ. PD-L2 is a second ligand for PD-1 and inhibits T cell activation. Nature Immunology. 2001;2:261. doi: 10.1038/85330. [DOI] [PubMed] [Google Scholar]
- 53.Raab M, Pfister S, Rudd CE. CD28 signaling via VAV/SLP-76 adaptors: regulation of cytokine transcription independent of TCR ligation. Immunity. 2001;15:921. doi: 10.1016/s1074-7613(01)00248-5. [DOI] [PubMed] [Google Scholar]
- 54.Anderson DE, Bieganowska KD, Bar-Or A, Oliveira EM, Carreno B, Collins M, Hafler DA. Paradoxical inhibition of T-cell function in response to CTLA-4 blockade; heterogeneity within the human T-cell population. Nature Medicine. 2000;6:211. doi: 10.1038/72323. [DOI] [PubMed] [Google Scholar]
- 55.Swallow MM, Wallin JJ, Sha WC. B7h, a novel costimulatory homolog of B7.1 and B7.2, is induced by TNFalpha. Immunity. 1999;11:423. doi: 10.1016/s1074-7613(00)80117-x. [DOI] [PubMed] [Google Scholar]
Associated Data
This section collects any data citations, data availability statements, or supplementary materials included in this article.