

Abstract
Précis
Despite providing adequate amounts of energy delivered via parenteral nutrition in a mouse model, mice still developed intestinal villus atrophy, epithelial cell apoptosis and bacterial translocation. Mice, however, are intolerant of very high infusions of PN, as technical complications were the major cause of death and complications in this group.
Background
Parenteral nutrition (PN) is known to induce villus atrophy, epithelial cell (EC) apoptosis, and increase mucosal permeability. The study hypothesized that increasing amounts of energy delivery to mice to would result in the best outcome, with the least effects on the mucosa.
Methods
Mice were randomized to Enteral Controls (saline infusion with ad lib enteral food) or to one of three PN groups (with no enteral nutrition): Full (100% of daily average energy intake for the mouse), Reduced (75% of energy intake) or Very Low (50% of energy intake). Mice received PN for 7 days. Mucosal morphology, EC apoptosis, and bacterial translocation were assessed. Results are expressed as mean ± SD.
Results
Villus height decreased significantly with decreasing levels of caloric intake, and was significantly lower in all PN groups compared to Controls. Body weight loss was significantly greater in PN groups versus Controls, and was greatest in mice with the lowest caloric delivery. A consistent trend towards a higher EC apoptotic index with decreasing caloric intake was observed and apoptosis in all PN groups exceeded Controls (2-fold). All PN groups demonstrated greater bacterial translocation than Controls.
Conclusions
PN induces intestinal EC apoptosis, and villus and crypt atrophy even at 100% of predicted energy needs; and such changes increased with greater reduction of energy intake. This study supports a concept that lack of enteral nutrition, rather than absolute caloric levels are responsible for many of the adverse effects of PN. The study also allows the investigators to better optimize a mouse model of PN delivery in mice.
Keywords: intestinal epithelial cell, apoptosis, villus, bacterial translocation, parenteral nutrition, mucosa, mouse
INTRODUCTION
Parenteral nutrition (PN) is known to induce significant changes in mucosal structure and function. These changes include villus atrophy, epithelial cell (EC) apoptosis, and altered mucosal permeability. PN administration is associated not only with morphologic changes in the intestine, but also with bacterial translocation and a loss of mucosal barrier function (1–3). The mechanisms of PN-associated loss of epithelial integrity and morphologic changes have been extensively studied using a mouse model (1–6). The use of a mouse model can offer great insights into these PN-associated effects on the gastrointestinal tract. Recent work by our group has helped to identify mechanisms which contribute to the occurrence of bacterial translocation and villus atrophy (1–3,6). Unlike other animal models, the use of mice is relatively inexpensive, allows for a very extensive study of the alterations in their immune system, and can be managed in a small laboratory setting. Delivery of PN to mice, however, is a challenge, and has been associated with a moderate mortality (7). To address this problem, this study was designed to determine the amount of energy delivery via PN using a mouse model; whereby the closest approximation to energy needs is met and with the fewest number of complications. We also sought to determine whether different levels of energy delivery, administered as PN, correlated with PN-associated intestinal changes. We further attempted to determine the most optimal amount of energy delivery while optimizing mouse survival and morbidity. We hypothesized that higher energy delivery via PN would result in fewer aberrations in intestinal morphology and improved survival.
MATERIALS AND METHODS
Animals
C57BL/6J male specific-pathogen-free mice (8 weeks old) were obtained from Jackson Laboratory (Bar Harbor, ME), and were maintained under temperature-, humidity-, and light-controlled conditions. Mice were initially fed ad libitum with standard mouse chow and water and allowed to acclimate. During the administration of intravenous solutions, mice were housed in metabolic cages to prevent coprophagia. The studies reported here conformed to the guidelines for the care and use of laboratory animals established by the University Committee on Use and Care of Animals at the University of Michigan and protocols were approved by that committee (No:7703).
Operative Procedures and Study Groups
Mice were anesthetized with sodium pentobarbital (50 mg/kg/body weight, intraperitoneal). All surgical procedures were performed under magnification in a sterile fashion. The left jugular vein was exposed and cannulated with a silicone rubber catheter (0.012 inch i.d., 0.025 inch o.d; Dow Corning, Midland, MI). The distal end of the catheter was tunneled subcutaneously and exited between the scapulae. The catheter was attached to a swivel spring which allowed the mice freedom of movement in their individual cages (Metamount System, Instech Corp., Plymouth Meeting, MA). Catheterized mice were immediately connected to an infusion pump (AIM pain provider pump, generously donated by Abbott Laboratories, Abbott Park, IL) and saline (dextrose 5% in 0.45NS with 20 mEq KCl/liter) was infused at an initial rate of 4.8 ml/day. After 24 hours, the animals were randomized to Control or PN groups. Of note, the AIM pain provider pump is one of the most accurate available to date. Nevertheless, the delivery is cyclical, and not continuous. Thus, as infusion rates increased, we found that some mice developed extravasation of intravenous PN. These mice were not included in the study results.
Average daily caloric intake was measured for mice provided enteral chow ad libitum (assessed via daily measurements of feed consumption with mice in metabolic chambers, data not shown), and was found to be 470 kcal/kg/day for 8-week-old mice of 25 gm body weight, which closely agrees with known estimates of normal caloric consumption for mice (6,7), as well as estimates provided by the Purina Mills Veterinary Service(8) (Table 1).
Table 1.
Description of Parenteral Nutrition Infusion
| Groups | Caloric Delivery (kcal/kg/day)* | Protein Delivery (g/kg/d) | Fat Delivery (g/kg/d) | % of normal enteral caloric intake | PN Infused Rate (ml/hr) |
|---|---|---|---|---|---|
| Full PN, n=5 | 471 | 19.2 | 7.7 | 100% | 0.4 |
| Reduced PN, n=6 | 353 | 14.4 | 5.8 | 75% | 0.3 |
| Very Low PN, n=7 | 236 | 9.6 | 3.9 | 50% | 0.2 |
| Control ** (enteral), n=6 | 486 | 30 | 6.6 | 100% | 0.2 (saline) |
Mean caloric delivery was based on the initial average body weight (22 grams). There was no difference between groups in initial body weight. PN groups did not receive any enteral intake. Abbreviation: PN, parenteral nutrition.
Estimate from Purina Mills Chow Inc., assuming 4 grams consumption of food per day, a net metabolizable amount of nutrients (excludes non-digestible fibers), and a mouse weighing 22 grams.
Study Groups
Mice were then provided PN at 100%, 75%, or 50% of normal mouse energy intake (470 kcal/kg/day, “Full” group, n=5; versus 350 kcal/kg/day, “Reduced” group, n=6; and 235 kcal/kg/day, “Very low” group, n=7; respectively, Table 1), and were not permitted any enteral nutrition, but were allowed ad libitum water. PN was formulated by a clinical PN supplier (HomeMed of the University of Michigan Health System) and contained a balanced mixture of amino acids, lipids, and dextrose, in addition to electrolytes and vitamins (Table 2). All mice receiving PN were provided drinking water ad libitum, but no enteral feeds during the 7 days on PN. The Control group (n=6) received intravenous physiologic saline at 0.2 ml/h, in addition to standard mouse chow and water ad libitum. All animals were euthanized with CO2 at 7 days. Body weight was recorded both before the initiation of the study and after the mice were euthanized.
Table 2.
Parenteral Nutrition Formulation
| Amount per 50 ml formulated PN | Volume (ml) of component in 50 ml | Kcal/ml of individual component | |
|---|---|---|---|
| Aminosyn II 10% | 2 gm protein equivalent | 20 | 0.40 |
| Dextrose 70% | 12.5 gm dextrose | 18 | 2.38 |
| Liposyn II 20% | 1 gm fat | 5 | 2.0 |
| Electrolytes | 6.07 | 0 | |
| Water | 0.93 | 0 | |
| Total volume of final PN (ml)* | 50 | 1.227 kcal/ml |
All TPN solutions were supplemented with multi-vitamins and a complete trace elements package, as previously described (22).
Bacteriological Cultures
Methods used were similar to those previously described (9,10). After euthanasia, and using sterile technique, samples of tissue from mesenteric lymph nodes, liver, and spleen were excised. Each tissue sample was incubated in thioglycolate broth for 24 h at 37°C and then subcultured onto both MacConkey media for isolation of gram-negative bacteria, and colistine nalidixic acid media (Becton Dickinson, Cockeysville, MD) for isolation of gram-positive bacteria in an aerobic environment. Following an additional 24 hour incubation period, growth on each plate was recorded as either positive or negative. Positive cultures were considered indicative of bacterial translocation (9,10).
Intestinal morphology
Intestinal specimens were immediately fixed in 10% neutral buffered formalin after euthanasia. Specimens were paraffin-embedded and cut into 5-μm-thick tissue slices parallel with the longitudinal axis of the bowel. Tissue slices were mounted and stained with hematoxylin and eosin for assessment of villus length and crypt depth. Five different fields of each specimen were observed and digital images were recorded with computer-aided video microscopy (Eclipse TS100, Nikon Inc., NY). Villus length and crypt depth for each specimen were measured and analyzed using commercially available quantitative digital image analysis software (Media Cybernetics Inc., MD). Each measurement consisted of the mean of five different fields. At least 20 villi were counted and averaged for each sample, and only villi with an intact central lymphatic channel were considered.
Assessment of apoptosis
Tissue sections were stained with terminal-deoxynucleotidyl transferase nick-end labeling (TUNEL) for quantification of apoptosis in situ. The ApopTag InSitu Apoptosis Detection Kit (Serological Corporation, Norcross, GA) was used according to the manufacturer’s instructions. Apoptosis was defined by both the finding of apoptotic bodies with positive TUNEL staining, as well as by morphologic criteria (pyknotic nuclei, condensed chromatin, and nuclear fragmentation) (11–13). Apoptosis was assessed by counting the number of apoptotic bodies identified within the crypts and villi. The apoptotic index was defined as the ratio of apoptotic cells to the total number of within the crypt-villus axis per section. The mean value of four sections was calculated per sample.
Nutritional and biochemical parameters
Serum biochemical parameters including total protein, albumin, gamma-glutamyl transferase (GGT) and total bilirubin were measured. Serum was drawn via inferior vena caval puncture immediately after euthanasia. Tests were performed by the clinical laboratory in our hospital using standardized methods.
Data Analysis
Statistical analysis was carried out using the t test for comparison of two means and a one-way ANOVA for comparison of multiple groups (with a Bonferoni post-hoc analysis to assess statistical differences between groups). The Chi-square test was used for categorical data. Linear regression analysis was used to correlate the amount of energy delivered via PN to the several observed outcome changes including survival and intestinal morphology. Prism software was used (GraphPad Software, Inc., San Diego, CA, U.S.A). Statistical significance was defined as P <.05. All data are expressed as mean ± standard deviation (SD).
RESULTS
General Outcome
Survival progressively worsened in the PN mice as the rate of infusion increased (36%, 40% and 58% for the Low, Medium and Full PN groups) compared to 100% survival in the enteral control group. No correlation could be made, however, between the amount of energy delivery and survival (P>0.05). The cause of death consistently due to accumulation of a leakage of PN fluid in the neck of mice at Full energy delivery group; and due to a number of factors for mice in the lower rates, including PN extravasation, apparent sepsis, or line occlusion.
Initial body weight of mice did not differ between PN and Control groups (P >.05). After 7 days of PN, body weight in all three PN groups was significantly lower compared with Controls (P<.01) (Figure 1). Weight loss (% of initial weight) was greatest in the Very Low PN group, reaching 25.3 ± 7.2%, and was progressively less for the Reduced (10.35 ± 5.2%) and Full PN (12.63 ± 6.4%) groups, compared with them only 0.24±4.26% for control group. Weight losses between PN groups, however, were not significantly different (P>0.05).
Figure 1.
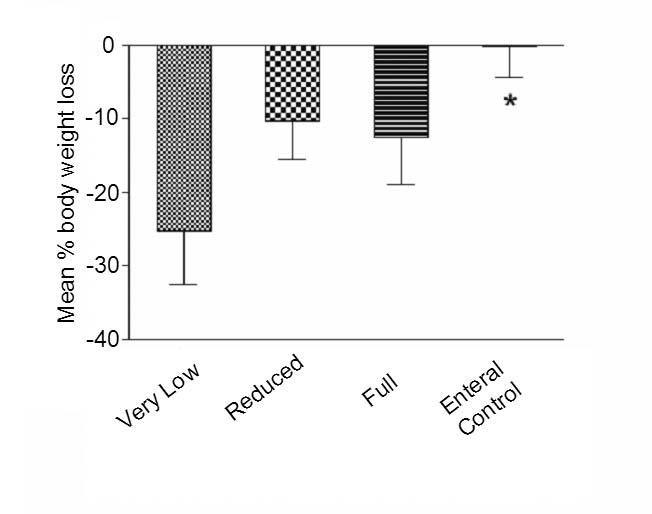
Body weight in all PN groups was significantly less compared with Control after 7 days of infusion (*p<0.01). Body weight loss was greatest in the Very Low group. (Percentage weight loss calculated as: [Initial weight − Final weight]/[Initial weight] × 100).
Intestinal Morphology
Villus lengths and crypt depths in the three PN groups were significantly lower as compared to the Control group (P <.01). In addition, villus length and crypt depth showed the greatest degree of atrophy in the Very Low PN group vs Reduced and Full groups (P <.05, Table 3). Thus, progressively lower amounts of caloric delivery resulted in progressively greater degrees of mucosal atrophy (Figure 2), however linear regression analysis was did not demonstrate a statistically significant relation between the level of energy deliver and the degree of intestinal atrophy (P>0.05).
Table 3.
Morphologic Change Correlates with Caloric Intake
| Groups | Villus length (Micron) | Crypt depth (Micron) |
|---|---|---|
| Full PN | 320.9 ± 63.6* # | 82.6 ± 14.9* # |
| Reduced PN | 308.4 ± 65.2* | 76.1 ± 7.4* # |
| Very Low PN | 259.5 ± 58.3* | 56.6 ± 8.9* |
| Control | 397.4 ± 49.5 | 121.4 ± 27.2 |
Compared with control group: P<.01.
Compared with the Very Low PN group: P<.05.
Figure 2.
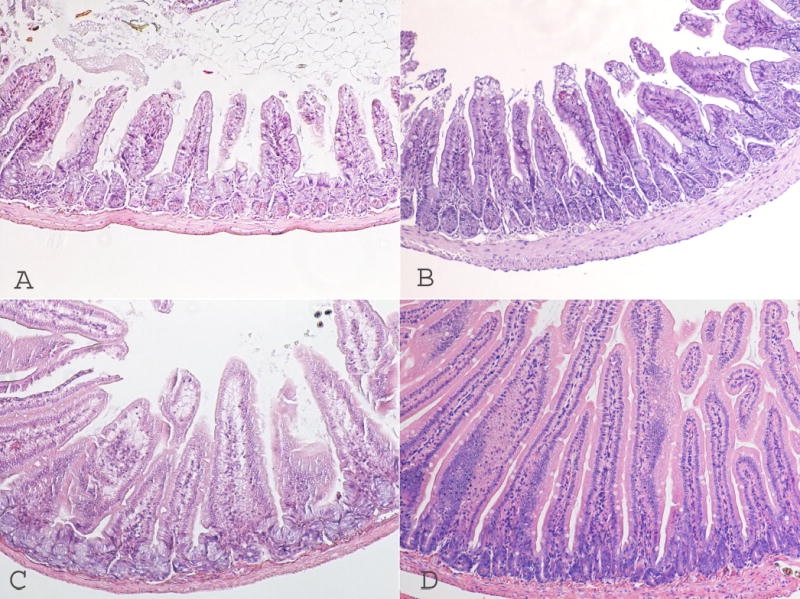
Progressively lower amounts of caloric delivery resulted in progressively greater degrees of mucosal atrophy. A: Very Low PN intestine villus; B: Reduced PN; C: Full PN and D: Enteral control. Photomicrographs are taken at 40 × magnification.
Intestinal Epithelial Cell Apoptosis
The apoptotic index was significantly higher in all PN groups by more than 2-fold, in comparison to Controls, both in the villi and in the crypts (P< .01). A consistent trend towards increasing apoptotic index was found with decreasing caloric intake; although the difference in apoptotic index between PN groups did not reach significance by ANOVA (P>.05, Table 4).
Table 4.
Intestinal Epithelial Cell Apoptosis.
| Very Low | Reduced | Full | Control | |
|---|---|---|---|---|
| Apoptotic index/Villus | 0.16±0.03* | 0.17±0.04* | 0.14±0.03* | 0.06±0.01 |
| Apoptotic index/crypts | 0.114±0.03* | 0.111±0.02* | 0.089±0.03* | 0.041±0.01 |
Compared with Control group: P <.01.
Biochemistry
After 7 days of PN, serum biochemical and nutritional parameters were similar to baseline (Control) values (Table 5), with the notable exception of alanine aminotransferase, which was markedly elevated in the Very Low group. Total bilirubin and gamma-glutamyl transferase were elevated in the Full PN group, possibly suggestive of a cholestatic process. Other values (serum albumin and total protein) were not markedly affected by 7 days of PN either at Full, Reduced, or Very Low rates of caloric delivery. Blood glucose levels were somewhat elevated in all groups at the onset of the experimental week, including the control population, potentially due to the stress of the operative procedure (185, 224, 146, and 221 mg/Dl for Enteral control, Very Low, Reduced and Full PN groups, respectively, mean value from 3 mice). Levels decreased toward the latter half of the experiment, and none of the PN groups were felt to be excessively elevated (190, 140, 89, and 156 mg/Dl for Enteral control, Very Low, Reduced and Full PN groups, respectively, mean value from 3 mice).
Table 5.
Changes of biochemical parameters in each study group (Mean value).
| Groups | Total Protein (g/dL) | Albumin (g/dL) | ALT (IU/L) | GGT (IU/L) | Total bilirubin (mg/dL) |
|---|---|---|---|---|---|
| Very Low, n=7 | 5.6 | 2.7 | 177 | 17 | 1.7 |
| Reduced, n=6 | 5.6 | 2.5 | 62 | 7 | 1.5 |
| Full, n=5 | 6.3 | 4.3 | 56 | 51 | 2.7 |
| Control, n=6 | 5.6 | 2.7 | 44 | 10.3 | 1.6 |
Bacterial Translocation
Bacterial translocation results are shown in Table 6. In the PN groups, the percentage of bacterial translocation to mesenteric lymph nodes, liver, and spleen in Very Low, Reduced, and Full groups were 38.1%, 55.6% and 33.3% for Gram-negative cultures; and 52.4%, 55.6% and 53.3% for Gram-positive cultures, respectively. In contrast, the Control group demonstrated bacterial translocation in only 11.1% of Gram-positive and 0% of Gram-negative cultures (P <.01 vs. all PN groups). No significance in bacterial translocation rates was found between PN groups.
Table 6.
Bacterial Translocation
|
MacConkey Agar (Gram negative) |
CAN (Gram positive) |
|||||
|---|---|---|---|---|---|---|
| Groups | Positive | Negative | % positive | Positive | Negative | % positive |
| Very Low, n=7 | 8* | 13 | 38.1 | 11* | 10 | 52.4 |
| Reduced, n=6 | 10* | 8 | 55.6 | 10* | 8 | 55.6 |
| Full, n=5 | 5* | 10 | 33.3 | 8* | 7 | 53.3 |
| Control, n=6 | 0 | 18 | 0 | 2 | 16 | 11.1 |
Compared with Control group: P <.01. No significance in bacterial translocation rates was found between PN groups.
DISCUSSION
This study has compared the effect of different levels of nutritional delivery on known PN-associated pathologic changes. Although PN is known to induce villus and crypt atrophy, epithelial apoptosis, and bacterial translocation in the mouse PN model, the effect of reducing nutritional delivery on these changes has not previously been well-characterized. Our data indicate that although PN-associated epithelial derangements are significantly worsened by reducing the caloric PN delivery, yet even with full caloric delivery (100% of normal for the mouse), mucosal morphology and function is still significantly compromised in comparison to the control state (enteral nutrition). It is possible that the differences in these morphology may also be due to some differences in protein and fat delivery to PN mice compared to the enteral group. Even in the PN group receiving equivalent calories to the Control group, fat delivery was slightly higher and protein delivery was lower (See Table 1). These differences may account for some of these changes, although it was felt that the greatest difference was predominately in the caloric delivery between the groups. Thus, PN-associated changes may be worsened by a reduction in caloric delivery, but are not completely reversed by full caloric delivery, in the absence of enteral nutrition. These findings are consistent with another study indicating that the absence of enteral nutrition, and not PN per se, is the most important reason for PN-associated intestinal pathology (6). The current study, however, demonstrates a significant correlation between the degree of these adaptive changes and the amount of calories delivered via PN.
The significance of PN-associated villus atrophy has been debated. Villus atrophy may contribute to greater epithelial permeability and loss of barrier function, which may lead to bacterial translocation and subsequent sepsis (14,15). The etiology of TPN-associated villus atrophy is unknown, although numerous mechanisms responsible for this loss of villus length have been proposed (16,17). Intestinal epithelial cell apoptosis is clearly elevated with PN (2). It was also verified in this study that the apoptotic index was significantly higher in all PN groups by more than 2-fold, in comparison to Controls, both in the villi and in the crypts. A consistent trend towards increasing apoptotic index was found with decreasing caloric intake. In addition, a loss of hormonal stimulation and of nutritional substrates may contribute to villus atrophy (17–19). Several components of enteral nutrition, including dietary fiber and protein, have protective effects on the intestinal mucosa (17–20). Furthermore, even when animals undergo minimal stress and gain sufficient body weight with PN, the absence of enteral nutrients results in decreased in intestinal function and integrity (20).
Biochemical aberrations included an increase in GGT and total bilirubin in the Full PN group, and an increased ALT in the Low PN group. Although the etiology of PN-related cholestasis is unknown, these laboratory changes suggest that PN may adversely affect the liver in different fashions depending on the amount of delivered nutrients. Interestingly, the incidence of bacterial translocation was unaffected by the level of caloric PN delivery. In all PN groups, bacterial translocation was dramatically higher than in mice receiving enteral nutrition. The explanation for PN-associated bacterial translocation is incompletely understood, although it is clear that intraepithelial lymphocytes (IEL) (closely associated with the intestinal epithelium) undergo phenotypic and function changes with PN administration, with a loss of thymic-derived CD8αβ+ lymphocytes (7), an upregulation of IEL-derived IFN-gamma expression[2], a decreased mucosal IgA levels, and diminished T-cell and B-cell counts in Peyer’s patches (21). Thus, either epithelial apoptosis and increased permeability, or associated mucosal immune changes, may account for the observed elevation in bacterial translocation.
The current data show a clear correlation between level of caloric delivery and epithelial apoptosis. This suggests involvement of the starvation response in induction of intestinal epithelial apoptosis, although it is equally clear that absence of enteral nutrients serves as another key trigger for EC apoptosis, even when sufficient parenteral nutrients are provided. Local and systemic signals triggering intestinal EC apoptosis include interferon-gamma and other cytokines elaborated by IEL, but control of EC apoptosis is not yet completely understood (2,3).
The mouse PN model has been extensively used, and is a key model for molecular studies in parenteral nutrition. As intravenous infusion studies are becoming increasingly common in mouse models, technical aspects of these models are of paramount importance. We therefore recorded technical complications of this model, which have not been described in detail previously. Increases in infusion rates are achieved by incrementally increasing the amount per bolus (and not by reducing the time interval between boluses)(22). Surprisingly, in our study, higher infusion rates were associated with a very high rate of technical failure (60%), usually attributable to extravasation of PN at the cannulation site. Mice with technical failure of IV infusion were not included in the study. If infusion rates could be increased by reducing the time interval between boluses (which is 20 seconds on our pumps) rather than by increasing the size of the individual bolus, we believe that this limitation in mice could be overcome. From an experimental viewpoint, the Reduced PN infusion group (0.3 ml/hr) appears to be the most practical for further work, as it optimized the balance between increased mortality associated with insufficient caloric intake versus technical failures (extravasation) associated with higher infusion rates. An adjustment in the micro-infusion pumps would probably resolve this difficulty. Although these technical points are irrelevant to parenteral nutrition-induced epithelial changes, we include this discussion because these points have not been adequately reported previously. These technical limitations should be considered by any investigator planning infusion studies in mice.
In summary, parenteral nutrition induces significant derangements in intestinal EC physiology, including higher apoptotic rates, villus atrophy, and greater degrees of mucosal permeability. The current study has shown that although a strong correlation exists between the level of caloric delivery and the severity of many of these derangements; however, the level of caloric delivery does not entirely account for these changes. To a substantial degree, villus atrophy, apoptosis, and mucosal permeability can only be corrected by provision of intraluminal nutrition.
References
- 1.Wildhaber BE, Lynn KN, Yang H, Teitelbaum DH. Total parenteral nutrition-induced apoptosis in mouse intestinal epithelium: regulation by the Bcl-2 protein family. Pediatr Surg Int. 2002;18:570–575. doi: 10.1007/s00383-002-0869-1. [DOI] [PubMed] [Google Scholar]
- 2.Yang H, Fan Y, Teitelbaum DH. Intraepithelial lymphocyte-derived interferon-gamma evokes enterocyte apoptosis with parenteral nutrition in mice. Am J Physiol Gastrointest Liver Physiol. 2003;284:G629–637. doi: 10.1152/ajpgi.00290.2002. [DOI] [PubMed] [Google Scholar]
- 3.Yang H, Kiristioglu I, Fan Y, Forbush B, Bishop DK, Antony PA, Zhou H, Teitelbaum DH. Interferon-gamma expression by intraepithelial lymphocytes results in a loss of epithelial barrier function in a mouse model of total parenteral nutrition. Ann Surg. 2002;236:226–234. doi: 10.1097/00000658-200208000-00011. [DOI] [PMC free article] [PubMed] [Google Scholar]
- 4.Fukatsu K, Kudsk KA, Zarzaur BL, Wu Y, Hanna MK, DeWitt RC. TPN decreases IL-4 and IL-10 mRNA expression in lipopolysaccharide stimulated intestinal lamina propria cells but glutamine supplementation preserves the expression. Shock. 2001;15:318–322. doi: 10.1097/00024382-200115040-00012. [DOI] [PubMed] [Google Scholar]
- 5.Li J, Kudsk KA, Gocinski B, Dent D, Glezer J, Langkamp-Henken B. Effects of parenteral and enteral nutrition on gut-associated lymphoid tissue. J Trauma. 1995;39:44–51. doi: 10.1097/00005373-199507000-00006. discussion 51–42. [DOI] [PubMed] [Google Scholar]
- 6.Wildhaber BE, Yang H, Spencer AU, Drongowski RA, Teitelbaum DH. Lack of enteral nutrition--effects on the intestinal immune system. J Surg Res. 2005;123:8–16. doi: 10.1016/j.jss.2004.06.015. [DOI] [PubMed] [Google Scholar]
- 7.Kiristioglu I, Antony P, Fan Y, Forbush B, Mosley RL, Yang H, Teitelbaum DH. Total parenteral nutrition-associated changes in mouse intestinal intraepithelial lymphocytes. Dig Dis Sci. 2002;47:1147–1157. doi: 10.1023/a:1015066813675. [DOI] [PubMed] [Google Scholar]
- 8.Purina Mills Product information for Rodent Chow 5001. http://www.labdiet.com/indexlabdiethome.htm
- 9.Kiristioglu I, Teitelbaum DH. Alteration of the intestinal intraepithelial lymphocytes during total parenteral nutrition. J Surg Res. 1998;79:91–96. doi: 10.1006/jsre.1998.5408. [DOI] [PubMed] [Google Scholar]
- 10.Urao M, Teitelbaum DH, Drongowski RA, Coran AG. The association of gut-associated lymphoid tissue and bacterial translocation in the newborn rabbit. J Pediatr Surg. 1996;31:1482–1487. doi: 10.1016/s0022-3468(96)90160-8. [DOI] [PubMed] [Google Scholar]
- 11.Helmrath MA, Erwin CR, Shin CE, Warner BW. Enterocyte apoptosis is increased following small bowel resection. J Gastrointest Surg. 1998;2:44–49. doi: 10.1016/s1091-255x(98)80102-9. [DOI] [PubMed] [Google Scholar]
- 12.Knott AW, Juno RJ, Jarboe MD, Profitt SA, Erwin CR, Smith EP, Fagin JA, Warner BW. Smooth muscle overexpression of IGF-I induces a novel adaptive response to small bowel resection. Am J Physiol Gastrointest Liver Physiol. 2004;287:G562–570. doi: 10.1152/ajpgi.00438.2003. [DOI] [PubMed] [Google Scholar]
- 13.Wyllie AH. Apoptosis and carcinogenesis. Eur J Cell Biol. 1997;73:189–197. [PubMed] [Google Scholar]
- 14.Alverdy JC, Aoys E, Moss GS. Total parenteral nutrition promotes bacterial translocation from the gut. Surgery. 1988;104:185–190. [PubMed] [Google Scholar]
- 15.Yang H, Wildhaber B, Tazuke Y, Teitelbaum DH. 2002 Harry M. Vars Research Award. Keratinocyte growth factor stimulates the recovery of epithelial structure and function in a mouse model of total parenteral nutrition. JPEN J Parenter Enteral Nutr. 2002;26:333–340. doi: 10.1177/0148607102026006333. discussion 340–331. [DOI] [PubMed] [Google Scholar]
- 16.Buchman AL, Moukarzel AA, Bhuta S, Belle M, Ament ME, Eckhert CD, Hollander D, Gornbein J, Kopple JD, Vijayaroghavan SR. Parenteral nutrition is associated with intestinal morphologic and functional changes in humans. JPEN J Parenter Enteral Nutr. 1995;19:453–460. doi: 10.1177/0148607195019006453. [DOI] [PubMed] [Google Scholar]
- 17.Peterson CA, Ney DM, Hinton PS, Carey HV. Beneficial effects of insulin-like growth factor I on epithelial structure and function in parenterally fed rat jejunum. Gastroenterology. 1996;111:1501–1508. doi: 10.1016/s0016-5085(96)70011-2. [DOI] [PubMed] [Google Scholar]
- 18.Burrin DG, Stoll B, Jiang R, Petersen Y, Elnif J, Buddington RK, Schmidt M, Holst JJ, Hartmann B, Sangild PT. GLP-2 stimulates intestinal growth in premature TPN-fed pigs by suppressing proteolysis and apoptosis. Am J Physiol Gastrointest Liver Physiol. 2000;279:G1249–1256. doi: 10.1152/ajpgi.2000.279.6.G1249. [DOI] [PubMed] [Google Scholar]
- 19.van der Hulst RR, van Kreel BK, von Meyenfeldt MF, Brummer RJ, Arends JW, Deutz NE, Soeters PB. Glutamine and the preservation of gut integrity. Lancet. 1993;341:1363–1365. doi: 10.1016/0140-6736(93)90939-e. [DOI] [PubMed] [Google Scholar]
- 20.Omura K, Hirano K, Kanehira E, Kaito K, Tamura M, Nishida S, Kawakami K, Watanabe Y. Small amount of low-residue diet with parenteral nutrition can prevent decreases in intestinal mucosal integrity. Ann Surg. 2000;231:112–118. doi: 10.1097/00000658-200001000-00016. [DOI] [PMC free article] [PubMed] [Google Scholar]
- 21.King BK, Li J, Kudsk KA. A temporal study of TPN-induced changes in gut-associated lymphoid tissue and mucosal immunity. Arch Surg. 1997;132:1303–1309. doi: 10.1001/archsurg.1997.01430360049009. [DOI] [PubMed] [Google Scholar]
- 22.http://www.abbott.com