Abstract
Strip extensometry tests are usually considered less reliable than trephinate inflation tests in studying corneal biomechanics. In spite of the evident simplicity of strip extensometry tests, several earlier studies preferred inflation tests in determining the constitutive relationship of the cornea and its other material properties, such as Young's modulus and the hysteresis behaviour. In this research, the deficiencies of the strip tests are discussed and a mathematical procedure presented to take account of these deficiencies when obtaining the corneal material properties. The study also involves testing 10 pairs of porcine corneas using both strip extensometry and trephinate inflation techniques and the results are subjected to mathematical back analysis in order to determine the stress–strain behaviour. The behaviour obtained from the strip extensometry tests and using the new mathematical analysis procedure is shown to match closely the inflation test results.
Keywords: corneal biomechanics, strip extensometry, trephinate inflation
1. Introduction
Strip extensometry tests have been attempted by several researchers (Andreassen et al. 1980; Nash et al. 1982; Seiler et al. 1992; Borja et al. 2004) to determine the stress–strain behaviour of the cornea. The test procedure is simple—a strip of corneal tissue with a constant width is dissected and attached to the grips of a slow rate tension machine while monitoring its behaviour. The procedure involves three inherent deficiencies, which have reduced the reliability of the technique. Two of the deficiencies originate from the fact that a strip specimen is originally part of a spherical surface. As a result, the length of the specimen along its longitudinal centreline is longer than along the sides. This variation in specimen length inevitably leads to a non-uniform stress distribution across the width of the specimen.
Flattening of the originally curved specimen is responsible for the second deficiency. The flattening produces tensile strains on the posterior side and compressive strains on the anterior side. These initial strains could be considerable even though the corneal thickness might be considered small in relation to the other dimensions (≈7% of radius). Earlier discussion of this point (Hoeltzel et al. 1992) has suggested that this deficiency might be insignificant based on an estimate of the difference in corneal behaviour between tension and compression. This point has been the subject of recent experimental research in Dundee, and it has been found that the corneal behaviour under compression is almost identical to the initial behaviour under tension. Further, it must be considered that under test conditions, the test specimen will eventually be under full tension, and that any initial compressive strain caused during flattening the specimen will lead to reduced tensile strains under the external tension load. Therefore, it must be at least worthwhile to study the effect of initial flattening on the specimen's behaviour.
Additionally, the back analysis of the strip-test results usually considers the central corneal thickness in deriving the material stress–strain behaviour. This is carried out while ignoring the natural increase in corneal thickness away from the centre.
These three deficiencies contribute to the perception that strip extensometry testing is a less reliable procedure to determine the corneal material properties compared with inflation testing (Hibbard et al. 1970; Greene 1978; Buzard 1992). This is in spite of the relative simplicity and hence low cost of strip tests.
The present research attempts to improve the accuracy of strip testing through the adoption of a mathematical back analysis procedure that seeks to consider and eliminate the effects of the deficiencies described above. As a test of the efficiency of the mathematical procedure, an experimental programme has been carried out involving testing porcine corneas from 10 pairs of eyes using both strip extensometry and trephinate inflation procedures. The results from the two sets of tests are compared to aid the final discussion on the reliability of strip testing.
2. Strip extensometry testing
Strip testing (also called coupon testing) is the most common experimental technique used to determine the properties of engineering materials. The test set up is quite simple, with a rectangular or a dog bone‐shaped specimen (or a coupon) attached to the grips of a tension machine and subjected to a gradually increasing axial tension until fracture. During the test, both the applied axial tension, T, and the resulting specimen elongation, δ, are recorded at several loading stages and used to determine the stress–strain relationship, using the expressions
| (2.1) |
where A is the cross-sectional area of the specimen, A=wt, w the specimen width, t the thickness and L the original length. Young's modulus is obtained as
| (2.2) |
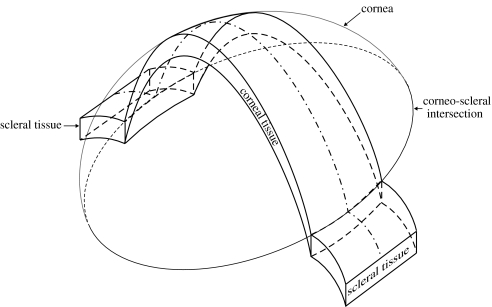
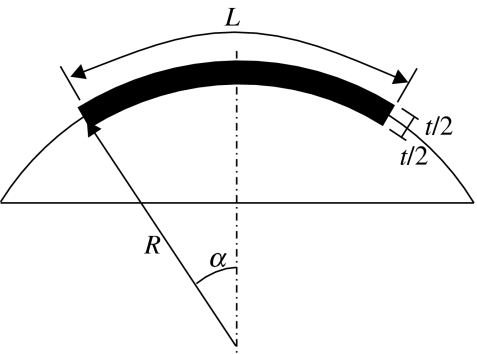
The simplicity of the test has persuaded several researchers in corneal biomechanics to use it to determine the corneal stress–strain relationship. In testing corneal specimens, strips of tissue are dissected from the cornea and possibly surrounding sclera as shown in figure 1. The scleral tissue, the limbus and the ends of the corneal strip are used for connection to the grips of the tension machine, leaving the middle corneal tissue to resist the applied tension loads. However, the curved shape of the cornea has presented a number of problems, raising doubts about the accuracy of the testing technique.
Figure 1.
Strip extensometry specimen with end parts.
The doubts revolve around the difference in length between the specimen centreline and sides, and the flattening of the initially curved specimen before the application of external tension loads. A mathematical procedure is presented in this section in an attempt to negate the effects from these two factors in analysing the results of strip tests, and subsequently improve the reliability of the tests. The mathematical procedure also considers the actual thickness increase away from the corneal centre in deriving the stress–strain relationship.
3. Effect of variation in length
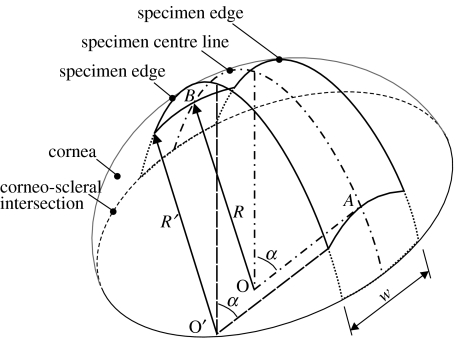
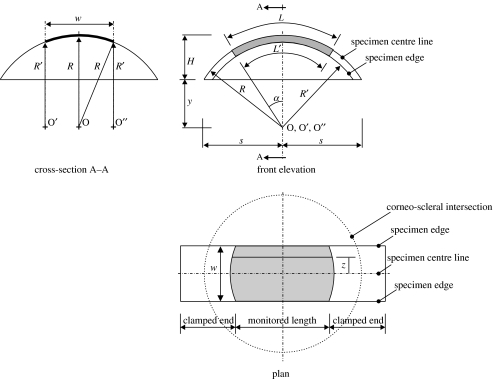
Figures 2 and 3 show schematic views of the median surface of the strip specimen. The sides of the specimen are in parallel planes that are also parallel to the plane of the longitudinal centreline. The width is constant along the whole length of the specimen. Therefore, while the longitudinal centreline is part of a main circle on the corneal spherical median surface, the sides are parts of secondary circles. It also follows that the three centre points (O, O′, O″) of the longitudinal centreline and the two sides are along the same line. The ends of the monitored part of the specimen, and hence the start of the clamped parts, are assumed perpendicular to both the specimen centreline and lines OA and OB originating from the centre of the cornea. They also form parts of main circles on the corneal spherical surface, with point O being the centre point.
Figure 2.
Isometric view of a strip specimen.
Figure 3.
Orthogonal views of a strip specimen.
The length of the monitored part of the specimen along its centreline and sides is obtained from the front elevation view in figure 3 as
| (3.1) |
where 2α is the angle of curvature of both the longitudinal centreline and the sides, R and R′ the radii of curvature of the centreline and the specimen sides, respectively. The relationship between R and R′ is obtained from the view depicting cross-section A–A in figure 3:
| (3.2) |
where w is the width of the specimen. The effect of this variation in specimen length is demonstrated for the cases of a human cornea with R=7.8 mm and a specimen width of either 3, 4 or 5 mm. In these cases, the ratios L/L′ are 1.020, 1.040 and 1.057, respectively, which could have a notable effect on the stress distribution across the cross-section of the specimen and the material properties obtained.
Now consider a longitudinal line, distance z away from the centreline. The length of this line is
| (3.3) |
where Rz is the radius of this line. Rz can be calculated similar to equation (3.2) as
| (3.4) |
The strain along this longitudinal line is therefore
| (3.5) |
where δ is the experimentally measured extension. A second-order formula can now be assumed for Young's modulus in the form
| (3.6) |
where a, b and c are constants. Therefore, the associated axial stress
| (3.7) |
Since the resultant of stresses acting across the width of the specimen should equal the applied tension, therefore
| (3.8) |
or
| (3.9) |
where t is the specimen's average thickness. Equation (3.9) can then be solved for every set of T–δ experimental data after substituting ϵz by its value in equation (3.5) to obtain the values of constants a, b and c, and hence the corresponding value of Young's modulus, E. Obtaining a closed-form solution for equation (3.9) is difficult. Instead, a solution based on numerical integration has been carried out successfully using a standard spreadsheet programme. The least-squares method is used to determine the values of constants a, b and c that provide the best fit with each set of T–δ experimental data. The values of a, b and c are then substituted in equation (3.6) to determine the corresponding value for E in terms of ϵ.
4. Effect of flattening the initial curvature
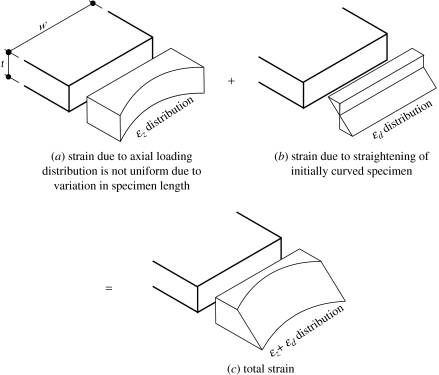
The flattening of the specimen's initial curvature causes a further change in the strain distribution on the specimen's cross-section, see figure 4. The resulting change adds tensile strain on the posterior side and compressive strain on the anterior side. A linear distribution between the maximum tensile strain and maximum compressive strain is assumed according to the beam theory, which states that cross-sections remain planar after flexural deformation (Megson 1996). The effect of flattening the specimen in the lateral direction is ignored in this work mainly because the resulting stresses are expected to be insignificant as the width of the specimen is normally much smaller than the length.
Figure 4.
Strain distribution on the cross-section of a strip extensometry specimen.
The strain components are now given separate symbols: ϵz owing to axial loading and ϵd owing to flattening of initial curvature. Strain ϵz has been determined in equation (3.5) and its distribution on the specimen's cross-section is shown in figure 4a.
The length of the specimen along the longitudinal centreline and at mid-thickness is
| (4.1) |
Also the lengths along the centreline, but measured this time on the posterior and anterior sides, are as shown in figure 5:
| (4.2) |
Figure 5.
Section across the longitudinal centre line of the strip specimen showing its thickness.
The difference in length between the mid-thickness and the sides is
Therefore, flattening the specimen so that all three lengths are the same will induce tensile strains on the posterior side and compressive strains on the anterior side. The maximum strains are equal in magnitude and have the value
| (4.3) |
The total strain at a general point distance d away from the mid-thickness is therefore
| (4.4) |
or
| (4.5) |
Note that at mid-thickness (where d=0), ϵd has no effect, while on the posterior and anterior surfaces, the effect is maximum. The total strain, ϵ, now replaces ϵz in equation (3.6) used to determine the Young's modulus, E. Therefore
| (4.6) |
and the process followed to determine the stress, σ, and the constants a, b and c remains unchanged except that the integration is now conducted across both the width and the thickness of the specimen. Note that in the derivation of the value of strain, ϵ, in equation (4.5) an average thickness, t, was assumed. The fact that the corneal specimen has a variable thickness is handled separately below for simplicity.
5. Effect of thickness variation
The derivation of the stress–strain relationship from the load-elongation data usually uses the central corneal thickness and ignores the natural growth in thickness towards the limbus. The effect of the thickness change is considered in this section and implemented as a final correction to the stress–strain relationship obtained using the above mathematical procedure.
For the strip specimen depicted in figure 6, the cross-sectional area varies from a minimum, A1, at the centre to a maximum, A2, at the ends. A1=wt1, A2=wt2, where w is the constant width of the specimen, t1 minimum thickness and t2 maximum thickness. Similarly, cross-sectional area Ax at distance x from the centre is
| (5.1) |
where l=L/2. The strain at this point is
| (5.2) |
The elongation, δ, can now be related to the strain using the expression
| (5.3) |
which leads to
| (5.4) |
or
| (5.5) |
Figure 6.
Variation of the specimen's cross-sectional area from a minimum at the centre to a maximum at the ends.
The first term, TL/δA1, in equation (5.5) represents the value of E when assuming constant cross-sectional area, A1, while the second term
is the modification owing to the change in thickness.
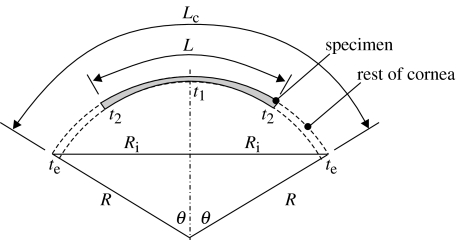
Now, figure 7 is used to determine the thickness, t2, at the end of the specimen. In this figure, Lc is the meridian length of the cornea:
| (5.6) |
where 2θ is the angle of curvature of the whole cornea. By assuming the thickness changes linearly from the centre (t1) to the intersection with the limbus (te),
| (5.7) |
or
| (5.8) |
Figure 7.
Thickness variation along the length of the strip specimen.
Substituting the value of t2 in equation (5.5) now enables the determination of E while considering the effect of thickness variation along the specimen length.
The following sections of the paper attempt to assess the success of this mathematical procedure in improving the accuracy of strip testing. An experimental programme involving both trephinate inflation and strip extensometry testing is introduced and the results are analysed mathematically to obtain the stress–strain behaviour using the two experimental techniques. The success of the procedure described above is measured by how close its results are to the inflation test results.
6. Experimental programme
The experimental programme involved testing 10 pairs of porcine corneas using trephinate inflation and strip extensometry testing techniques. The specimens were obtained from a local abattoir and were no more than 4 h post-mortem when tested. The 10 trephinate specimens, which included the cornea and a narrow ring of surrounding scleral tissue, were mechanically separated from the rest of the eye globe using a sharp cutting tool, then mounted on to a specially designed test rig that could provide watertight edge fixity for the specimens along their ring of scleral tissue. Care was taken to avoid damage to the epithelium or endothelium in spite of their reported small contribution to corneal biomechanics (Greene 1978).
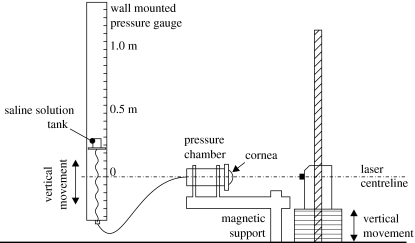
The specimens were subjected to a gradually increasing posterior pressure caused by a column of saline water to simulate the effect of elevated intra-ocular pressure as shown in figure 8. In the meantime, a laser (Keyence, CCD laser displacement sensor, LK series) was used to continually monitor the displacement at the apex of the cornea. The data related to the applied pressure and the corresponding apical displacement was automatically recorded for later analysis. Care was taken to consider the natural differences in the size of the specimens and in positioning the specimens relative to the laser. To ensure a good seal along the edge of the specimens, mechanical clamps and cyanoacrylate glue were used and found to be effective. The specimens were coated with mineral oil to prevent loss of hydration and any subsequent changes in dimensions and mechanical performance. All corneas were subjected to a gradually increasing posterior pressure up to a maximum pressure of 14 kPa (105 mmHg). This pressure was well above the level at which the corneas entered a stage of stable behaviour that was expected to continue until bursting (Shin et al. 1997; Voorhies 2003).
Figure 8.
Trephinate inflation test rig.
The other 10 specimens were prepared for strip extensometry tests. They were taken from the central portion of the cornea and cut to give 5 mm constant width. A cutting tool was used, consisting of a metal block attached to two parallel cutting blades. The tool was gently placed on the cornea through its centre. It was then pushed firmly into the cornea to cut the required specimen. This produced specimens with constant width and accurately trimmed edges, while avoiding damage to the internal structure of the cornea. Symmetry of the cornea was assumed, and while care was taken to ensure the specimens were taken from vertical corneal strips, small angular errors in positioning the tool were considered unimportant.
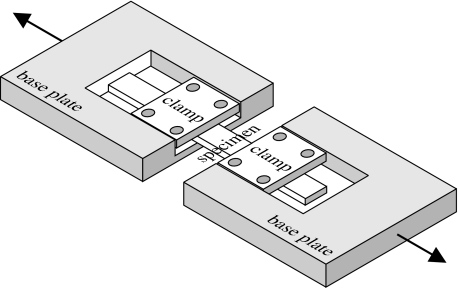
The specimens were coated with mineral oil to minimize hydration before and during the test and mounted onto the specially designed rig shown in figure 9. Cyanoacrylate glue and mechanical clamps were used to ensure uniform attachment to the rig clamps. This glue was used successfully earlier and found able to penetrate the internal corneal layers and maintain their connection to the clamps throughout the extensometry tests (Hoeltzel et al. 1992). Slippage between the specimen ends and the end clamps was also prevented using this glue, and this allowed the distance between the clamps to be used in the elongation and strain calculations. The specimens were fitted such that the length of the monitored part of the specimen (along its side) was 12 mm. The mechanical clamps were designed to fit into a tension Instron machine equipped with a 50 N capacity load cell. The initial cross-section (including the thickness) of each specimen was measured before commencing the test using a microscope. The Instron machine was set up to produce an elongation rate of 1 mm min−1, and this continued until the specimen ruptured. During the tests, axial tension and elongation data were collected electronically. The design of the test set up benefited from earlier work by Nyquist (1968) and Hoeltzel et al. (1992).
Figure 9.
Strip extensometry test rig.
The tests reported in this paper are part of an experimental study conducted to evaluate the corneal material properties, especially the stress–strain relationship. This work was preceded by a review of the available literature in which it became evident that there was some disagreement regarding the form the of σ–ϵ curve which could be used in numerical modelling. The testing programme was conducted to enable the development of reliable material properties that could be counted on to produce accurate numerical models. A comparison of the material properties reported in the literature and those found in this testing programme can be found as in Anderson (2005).
7. Results of trephinate inflation tests
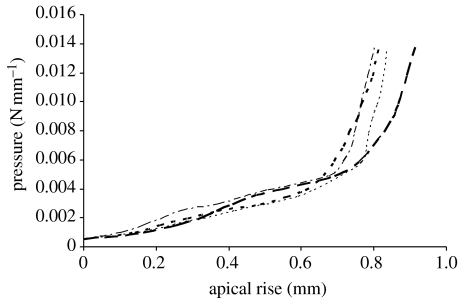
The results in figure 10 show the pressure apical rise relationships obtained for a representative selection of the 10 trephinate inflation tests. The results show a long phase of linear behaviour followed by a gradual stiffening at about 2–4 kPa (15–30 mmHg). Based on the results of earlier studies on the corneal microstructure (Woo et al. 1972; Hjortdal 1993, 1998), and what has been found in current laboratory testing, it is suggested to divide the stress–strain relationship into two distinctive phases: a matrix regulated phase with low stiffness followed by a collagen regulated phase with a much higher stiffness. In the first phase, the behaviour is dominated by the corneal matrix, particularly within the stroma. As a result, the apical rise of the cornea increases almost linearly with pressure at a low stiffness. The collagen fibrils in this phase remain loose and unable to contribute notably to the overall performance. Subsequently, with the start of the second phase it is expected that the collagen fibrils become taut, and owing to their much higher stiffness, they start to control the overall behaviour and quickly lead to a much increased stiffness (the average increase in stiffness observed in the 10 tests is approximately 22.5). Note also that these two phases of behaviour are preceded by a short irregular phase in which the corneal specimen is initially relaxed and gradually inflated to assume its natural curved topography.
Figure 10.
Selection of pressure-apical rise results of the trephinate inflation tests.
Mathematical analysis based on shell theory has been used to derive the material constitutive relationship from the pressure–apical rise experimental results. The analysis considers both in-plane and out-of-plane stiffness components, and assumes that the cornea can be approximated as a homogenous spherical structure (Vito et al. 1989). Details of the analysis procedure can be found in earlier publications (Anderson et al. 2004a,b). The final equation relating the internal pressure, p, to the apical rise, r, is
| (7.1) |
where R is the radius of the corneal median surface, t the average thickness, ν Poisson's ratio, taken as 0.49 based on the assumption that the cornea behaves as an incompressible body (Bryant & McDonnell 1996), θ half the central angle of curvature (see figure 7), θ=sin−1(Ri/R) and .
Equation (7.1) is used for each set of p–r data, and the corresponding Young's modulus, E, is obtained. The strain at this level of loading is then obtained using the relationship (Anderson et al. 2004a)
| (7.2) |
where Nφ=(pR)/2 and
| (33) |
Therefore,
| (7.3) |
The corresponding stress is then obtained using
| (7.4) |
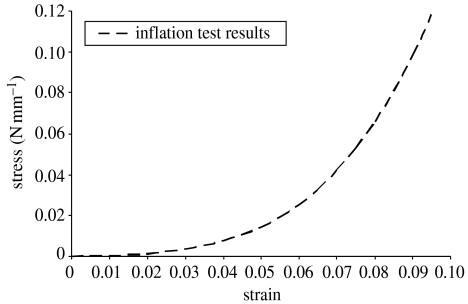
The results for each of the 10 inflation tests have been analysed using this procedure, and the average stress–strain curve obtained is shown in figure 11.
Figure 11.
Material constitutive relationship based on inflation test results.
8. Results of strip extensometry tests
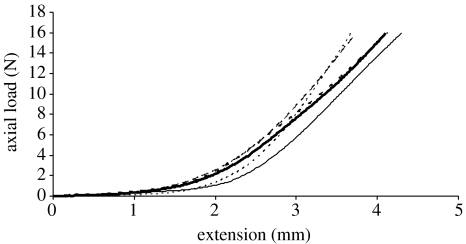
Similar to the inflation tests, the strip extensometry tests demonstrate a highly nonlinear behaviour. There is strong evidence of an initial phase of low stiffness followed by another with a much higher stiffness. A selection of the load–elongation results are shown in figure 12. The second phase of behaviour continued until rupture occurs under an axial load between 23 and 26 N. However, figure 12 shows only the behaviour up to 16 N, beyond which load, the load–elongation relationship remains linear until rupture.
Figure 12.
Load–elongation behaviour of a selection of strip tests.
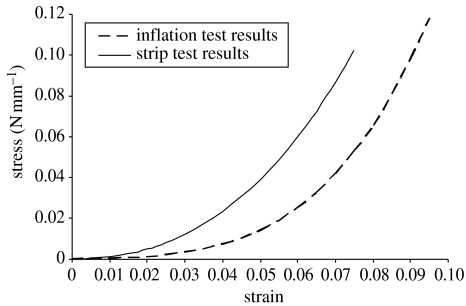
The results of the 10 strip tests have been analysed first using the simple and commonly adopted procedure involving equation (2.1), and the average stress–strain relationship obtained is compared with the result of the inflation tests in figure 13. On average, the strip tests overestimate the material stiffness by about 32% compared with the inflation test procedure.
Figure 13.
Material constitutive relationship obtained using both inflation and strip tests.
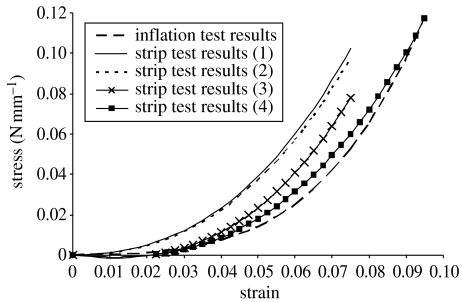
The stress–strain relationship obtained using the strip tests has been subjected to a number of modifications to consider the effect of specimen length variation, effect of flattening the initial curvature and effect of thickness variation. The result of these incremental modifications is illustrated in figure 14, which shows the following.
Figure 14.
Effect of introducing new mathematical procedures on accuracy of material constitutive relationship obtained using strip tests. (Results (1) are obtained using the commonly adopted equation (2.1); results (2) obtained after considering effect of length variation; results (3) obtained after also considering effect of flattening the initial curvature; results (4) obtained after also considering effect of thickness variation.)
Considering the effect of length variation leads to a small change in the stress–strain relationship. With this modification, the difference in material stiffness predictions between the strip and inflation tests reduces to 31%. In this work, R=9.75 mm, w=5 mm, R′=9.424 mm (equation (3.2)), L′=12 mm, α=0.636 7 rad, L=12.415 mm (equation (3.1)). Equation (3.9) is solved using numerical integration, and the resulting values of constants a, b and c are 99.78, 9.8655 and 0.00, respectively.
Modifying the analysis procedure to take into account the effect of flattening the initial curvature is more successful in closing the gap with the inflation test results. The difference in material stiffness now reduces to 17%. In this analysis, t=0.8 mm, Lposterior=11.906 mm, Lanterior=12.925 mm, ϵd−max=0.0410, a=117.33, b=8.1708 and c=−0.2315.
Introducing the third modification to consider the effect of thickness variation then results in reducing the difference between the two stress–strain relationships to about 5% on average. In the calculations to consider the thickness variation, the following parameters are determined: Ri=8.75 mm, θ=63.823°=1.1139 rad, Lc=21.721 mm, t1=0.75 mm, te=0.95 mm and t2=0.860 mm. The modification factor in equation (5.5) is 0.932.
9. Discussion
This paper presents a mathematical procedure to enable the accurate analysis of strip extensometry tests of corneal specimens. The procedure is intended to remedy three sources of inaccuracy in strip tests, which originate from the natural spherical shape of the cornea and from the thickness variation between the corneal centre and periphery. With this procedure, the variation in specimen length between the longitudinal centreline and the edges is considered by carrying out numerical integration of the stress across the width of the specimen and equating the result to the applied tension load. Flattening the initially curved specimen introduces initial tension and compression stresses on the specimen's posterior and anterior sides, respectively. The effect of these stresses is considered in the analysis by adding their distribution to that created by the applied tension, and using the result in calculating the specimen's resistance. The third source of inaccuracy is the thickness variation along the length of the specimen. Although the corneal thickness is minimal at the centre and grows gradually towards the limbus, current analysis procedures use the central corneal thickness in deriving the material stress–strain relationship. A method is developed in this paper to consider this effect by deriving the longitudinal strain as a dependent parameter on the thickness variation.
The paper also presents an experimental programme, in which 10 pairs of porcine corneas have been subjected to both button inflation tests and strip extensometry tests. The strip-test results have been analysed using the simple procedure based on equation (2.1), which does not consider any of the sources of inaccuracy described above. The resulting material stress–strain relationship is considerably stiffer than that derived using the inflation tests. Modifications have then been introduced into the analysis procedure to consider the three sources of inaccuracy one by one. As the modifications are introduced, the strip-test results gradually approach the inflation results, reducing the difference between the two sets of results from above 30 to approximately 5% on average.
These results indicate a moderate success of the mathematical procedure described in this paper in improving the accuracy of strip tests. The decision is now left to the researcher to choose whether to use the more demanding inflation tests with the straightforward analysis procedure or the simpler strip tests, which require more complex mathematical handling. The mathematical handling of strip tests is probably unsuitable for hand calculations, and would require programming or at least the use of a spreadsheet package.
Acknowledgments
This work was partially supported by a Doctorate Training award from the Engineering and Physical Sciences Research Council.
References
- Anderson, K. 2005 The application of structural engineering to corneal biomechanics. Ph.D. thesis, University of Dundee, UK.
- Anderson K, El-Sheikh A, Newson T. Application of structural analysis to the mechanical behaviour of the cornea. J. R. Soc. Interface. 2004;1:1–13. doi: 10.1098/rsif.2004.0002. [DOI] [PMC free article] [PubMed] [Google Scholar]
- Anderson K, El-Sheikh A, Newson T. FEA of the biomechanics of porcine cornea. J. Struct. Eng. 2004;82:20–25. [Google Scholar]
- Andreassen T.T, Simonsen A.H, Oxlund H. Biomechanical properties of keratoconus and normal corneas. Exp. Eye Res. 1980;31:435–441. doi: 10.1016/s0014-4835(80)80027-3. [DOI] [PubMed] [Google Scholar]
- Borja D, Manns F, Lamar P, Rosen A, Fernandez V, Parel J.-M. Preparation and hydration control of corneal tissue strips for experimental use. Cornea. 2004;23:61–66. doi: 10.1097/00003226-200401000-00010. [DOI] [PubMed] [Google Scholar]
- Bryant M.R, McDonnell P.J. Constitutive laws for bio-mechanical modelling of refractive surgery. J. Biomech. Eng. 1996;118:473–481. doi: 10.1115/1.2796033. [DOI] [PubMed] [Google Scholar]
- Buzard K.A. Introduction to biomechanics of the cornea. Refract. Corneal Surg. 1992;8:127–138. [PubMed] [Google Scholar]
- Greene, P. R. 1978 Mechanical aspects of myopia. Ph.D. thesis, Harvard University, Cambridge, MA.
- Hibbard R.R, Lyon C.S, Shepherd M.D, McBain E.H, McEwen W.K. Immediate rigidity of an eye: whole, segments and strips. Exp. Eye Res. 1970;9:137–143. doi: 10.1016/s0014-4835(70)80068-9. [DOI] [PubMed] [Google Scholar]
- Hjortdal J.O. Regional elastic performance of the human cornea. J. Biomech. 1993;29:931–942. doi: 10.1016/0021-9290(95)00152-2. [DOI] [PubMed] [Google Scholar]
- Hjortdal J.O. On the biomechanical properties of the cornea with particular reference to refractive surgery. Ophthalmol. J. Nordic Countries. 1998;76:1–23. [PubMed] [Google Scholar]
- Hoeltzel D.A, Altman P, Buzard K, Choe K.-I. Strip extensometry for comparison of the mechanical response of bovine, rabbit and human corneas. Trans. ASME. 1992;114:202–215. doi: 10.1115/1.2891373. [DOI] [PubMed] [Google Scholar]
- Megson T.H.G. Arnold; London: 1996. Structural and stress analysis. [Google Scholar]
- Nash I.S, Greene P.R, Foster C.S. Comparison of mechanical properties of keratoconus and normal corneas. Exp. Eye Res. 1982;35:413–442. doi: 10.1016/0014-4835(82)90040-9. [DOI] [PubMed] [Google Scholar]
- Nyquist G.W. Rheology of the cornea: experimental techniques and results. Exp. Eye Res. 1968;7:183–188. doi: 10.1016/s0014-4835(68)80064-8. [DOI] [PubMed] [Google Scholar]
- Seiler T, Matallana M, Sendler S, Bende T. Does Bowman's layer determine the biomechanical properties of the cornea? Refract. Corneal Surg. 1992;8:139–142. [PubMed] [Google Scholar]
- Shin T.J, Vito R.P, Johnson L.W, McCarey B.E. The distribution of strain in the human cornea. J. Biomech. 1997;30:497–503. doi: 10.1016/s0021-9290(97)84433-8. [DOI] [PubMed] [Google Scholar]
- Vito R, Shin T, McCarey B. A mechanical model of the cornea: the effects of physiological and surgical factors on radial kertotomy surgery. Refract. Corneal Surg. 1989;5:82–87. [PubMed] [Google Scholar]
- Voorhies, K. D. 2003 Static and dynamic stress/strain properties for human and porcine eyes. M.Sc. thesis, Virginia Polytechnic Institute, USA.
- Woo S.L.Y, Kobayashi A.S, Schlegel W.A, Lawrence C. Nonlinear properties of intact cornea and sclera. Exp. Eye Res. 1972;14:29–39. doi: 10.1016/0014-4835(72)90139-x. [DOI] [PubMed] [Google Scholar]


