Abstract
Eukaryotic DNA replication is initiated from multiple origins of replication, but little is known about the global regulation of origins throughout the genome or in different types of cell cycles. Here, we identify 401 strong origins and 503 putative weaker origins spaced in total every 14 kb throughout the genome of the fission yeast Schizosaccharomyces pombe. The same origins are used during premeiotic and mitotic S-phases. We found that few origins fire late in mitotic S-phase and that activating the Rad3 dependent S-phase checkpoint by inhibiting DNA replication had little effect on which origins were fired. A genome-wide analysis of eukaryotic origin efficiencies showed that efficiency was variable, with large chromosomal domains enriched for efficient or inefficient origins. Average efficiency is twice as high during mitosis compared with meiosis, which can account for their different S-phase lengths. We conclude that there is a continuum of origin efficiency and that there is differential origin activity in the mitotic and meiotic cell cycles.
Keywords: cell cycle, DNA replication, fission yeast, microarray analysis, replication origin
Introduction
Most research into eukaryotic origins has been limited to a small number of individual origins and origin clusters, and has not provided information on the dynamics and coordination of origin utilization throughout the entire genome. In budding yeast comprehensive global analyses have identified ∼260–420 origins in the genome (Macalpine and Bell, 2005; Feng et al, 2006); these are ∼150 bp DNA fragments containing an 11–17 bp consensus sequence (Theis and Newlon, 1997) reminiscent of viral and bacterial origins. Metazoan origins lack a consensus sequence and often contain cis-regulatory elements embedded in complex genomes (DePamphilis, 2005), which has made it difficult to identify such origins on a genome-wide scale and at the resolution required to investigate origin utilization. In somatic cells, the median replicon size has been estimated to be between 50 and 300 kb (Berezney et al, 2000), but in preblastula embryos of Drosophila or Xenopus DNA replication initiates every 8–15 kb, leading to a reduction in S-phase length compared with somatic cells (Hyrien et al, 2003). The transition from the inefficient replication that takes place in differentiated erythrocyte nuclei in Xenopus egg extracts to efficient replication more typical of early development is dependent on the re-programming of replicon organization during mitosis and results in shorter interorigin distances (Lemaitre et al, 2005). It is therefore possible that potential origin sequences are distributed at relatively short intervals throughout chromosomes and are regulated to adjust their use in different biological situations. This could account for the increased length of premeiotic S-phase compared with mitotic S-phase observed in many eukaryotes (Collins and Newlon, 1994), although two-dimensional agarose gel electrophoresis (2D-gel) of six origins in a 100 kb region of budding yeast Chromosome 3 has shown that the same origins were used both in premeiotic and mitotic S-phase (Collins and Newlon, 1994).
The genome-wide characterization of eukaryotic origins not stringently defined by a consensus sequence is important for understanding how such origins are specified and utilized in different developmental situations such as the mitotic and meiotic cell cycles. Fission yeast origins are not stringently defined because they lack a consensus sequence and have a 500–1000 bp extended AT-rich structure, a feature that has been used bioinformatically to identify 384 potential origins (Segurado et al, 2003). The extended structure of fission yeast origins is characterized by redundant and complex sequence elements that share features with metazoan origins, and the main sequence of events leading to the initiation of DNA replication is also similar (Kong et al, 2003; Vashee et al, 2003; DePamphilis, 2005). Budding yeast and fission yeast origin sequences are not always interchangeable (Beach and Nurse, 1981; Clyne and Kelly, 1995), suggesting that sequence requirements for origin function can differ between the two yeasts. A recent genome-wide analysis identified 321 origins in fission yeast at a resolution of 12 kb by mapping single-stranded DNA on ORF microarrays in the presence of hydroxyurea (HU) in an S-phase checkpoint deficient strain (Feng et al, 2006). However, only a subset of these (61%) could be identified in cells undergoing a normal S-phase suggesting that an S-phase checkpoint might suppress many origins.
More than 50% of fission yeast intergenic regions have the propensity to function as origins on extrachromosomal plasmids (Dai et al, 2005), raising the question of how many of them are active in their chromosomal context and how efficiently they are used in S-phases of the mitotic and meiotic cell cycles. Using both intergenic and ORF microarrays, we have globally mapped 401 strong and 503 putative weaker fission yeast origins during the mitotic and premeiotic S-phases, resulting in an average interorigin distance of 14 kb. The good reproducibility and resolution of our results have made it possible for the first time in a eukaryotic organism to assess origin efficiency on a genome-wide level in the different developmental situations of the mitotic and premeiotic S-phases.
Results and discussion
Identifying origins used during the mitotic cell cycle
We have employed microarrays to characterize origins used during the mitotic and meiotic cell cycles of the fission yeast. To map origins, the increase in DNA content was monitored as cells underwent synchronous progression through mitotic S-phase (Yabuki et al, 2002) (Figure 1A) induced using the temperature-sensitive cdc25-22 mutant strain that blocks cells in late G2 (Fantes, 1979). Cdc25 is a protein phosphatase required for the activation of the cyclin-dependent kinase cdc2 to initiate mitosis (Russell and Nurse, 1986; Gould et al, 1990). Two types of experiments were performed. In the ‘time-course experiment', DNA samples were taken every 5–10 min until S-phase was complete. In the ‘HU experiment', HU was added to slow down replication fork progression and confine DNA synthesis to the vicinity of origins (Patel et al, 2006). DNA samples were taken from cells that had been blocked for 90 min in HU, which is around 30 min after the onset of S-phase when bulk DNA replication was almost completed in a cdc25-22 block/release experiment (Figure 1A, right panel). This was considered the optimal time point since no significant change in signal ratio was observed on the replication profiles from 90 to 120 min (Figure 1B). In both types of experiments, DNA samples were differentially hybridized to ORF and intergenic microarrays covering the coding and noncoding regions of the genome; DNA from G2-arrested cells was used as a reference sample. Replicate experiments demonstrated that the results obtained were highly reproducible (Figure 2B).
Figure 1.
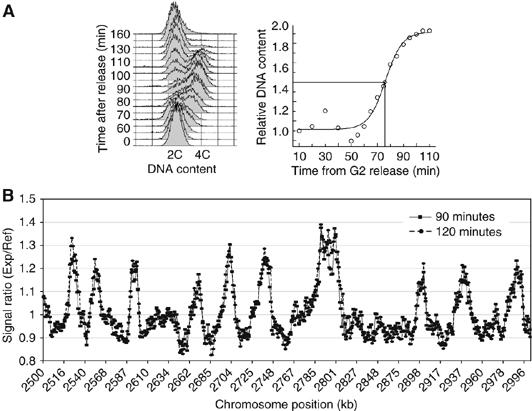
Assessment of S-phase kinetics for microarray experiments. (A) Left panel: FACS analysis of a synchronous mitotic S-phase. Cells were synchronized by incubating the temperature-sensitive cdc25-22 mutant strain at the restrictive temperature, which blocked cells in late G2. On shift to the permissive temperature, these cells rapidly underwent mitosis and G1, and entered S-phase synchronously. It should be pointed out that in fission yeast cytokinesis takes place in late S-phase/early G2. Therefore, the DNA content when cells enter S-phase as seen by FACS analysis is 2C (binucleate cells) and increases to 4C before cells divide. Right panel: Replication kinetics of a synchronous cell population in mitotic S-phase (see Materials and methods). Bulk DNA replication takes place between 60 and 100 min. (B) Comparison of HU replication profiles of a 90 and 120 min time point. A 500 kb region of Chromosome 2 is shown. The signal ratios do not significantly change when cells are blocked for an additional 30 min in HU.
Figure 2.
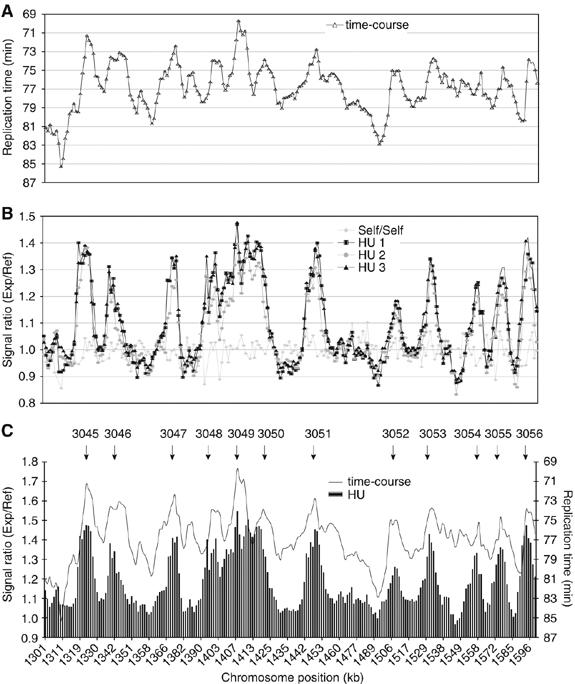
Mapping origins in the mitotic S-phase of fission yeast. (A) Replication timing profile of the time-course experiment along a 300 kb region of Chromosome 3. A moving average of the time at which 50% of each probe was replicated was determined (see Materials and methods) and plotted against chromosome position. (B) Replication profile of a triplicate repeat of the HU experiment; same region as in (A) is shown. Averaged microarray signal ratios were plotted for each probe against chromosome position. The plot of a self/self-hybridization is shown as a control. (C) Overlay of (A) and (B). Arrows indicate the position of origins in this region.
The time-course experiments were analyzed by plotting the relative content of DNA segments corresponding to each microarray probe during S-phase. The time point at which each segment became 50% replicated was identified and plotted along the chromosomes as a moving average across five microarray probes (∼6.5 kb). Peaks were identified, which replicated at least 3 min faster than surrounding regions and thus contained origins. An example of the time-course experiment for a 300 kb region is given in Figure 2A. The HU experiment allowed origins to be mapped more precisely because fork migration away from the origin was reduced (Patel et al, 2006). A moving average across three microarray probes was applied (∼3.9 kb) and signal ratios were plotted along the chromosomes. Origins were identified when peaks of replication were defined by three contiguous probes with a hybridization ratio in excess of 1.1 compared with the surrounding regions. Data for the HU experiment corresponding to the same 300 kb region analyzed in Figure 2A is given in Figure 2B. Peaks from both approaches generally coincided (Figure 2C), and by combining data from both types of experiments a total of 401 origins were identified (for origin lists see Supplementary data). Using this method, even closely spaced origins such as ars3003 and ars3002/4 (∼3.5 kb interorigin distance) within the well-characterized ura4 origin cluster could be identified (Dubey et al, 1994; Segurado et al, 2003; Patel et al, 2006). An additional 503 minor peaks were identified in the HU experiment with signal ratios below 1.1 (Figure 9A and B, small arrows), and we judged that many of these peaks corresponded to inefficient initiation events. However, because these were also likely to include some false-positives, we consider them further only later in this paper.
Figure 9.
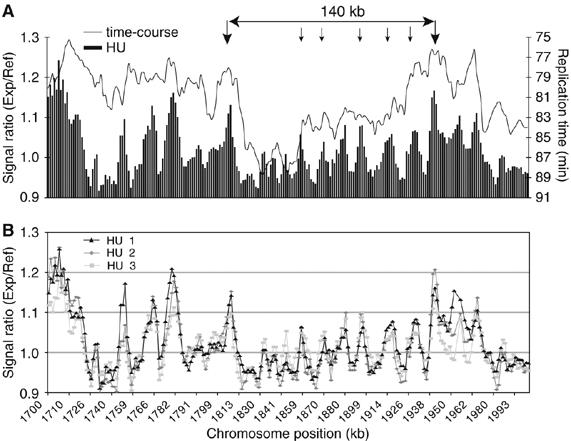
Characterization of a large interorigin region. (A) Overlay of the HU and time-course experiments across a 300 kb region of Chromosome 2. Origins flanking the 140 kb region analyzed (as indicated) are marked by two large arrows. Small arrows indicate distinct but small peaks (signal ratios below 1.1) within the 140 kb region on the replication profiles of the HU experiment. (B) Replication profiles of a triplicate repeat of the HU experiment of the 300 kb region shown in (A). Even small peaks within the 140 kb region were reproducible.
To investigate the possibility that inhibition of late firing origins by the S-phase checkpoint could interfere with origin identification (Feng et al, 2006), the HU experiment was repeated with a checkpoint deficient strain lacking the rad3 gene (Bentley et al, 1996) (Figure 3). Rad3 acts upstream of the S-phase checkpoint mutant cds1 (Xu et al, 2006), which was used by Feng et al (2006) in origin mapping experiments. We found that in the absence of the Rad3 dependent S-phase checkpoint, only two additional peaks were identified and only eight origins that generally replicated late in S-phase (79–85 min) out of the 401 origins (2%) were significantly induced (between 0.07 and 0.16 increases in hybridization ratios). This experiment demonstrates that using our experimental approach, origin identification in the presence of HU was not significantly affected by the Rad3 dependent S-phase checkpoint.
Figure 3.
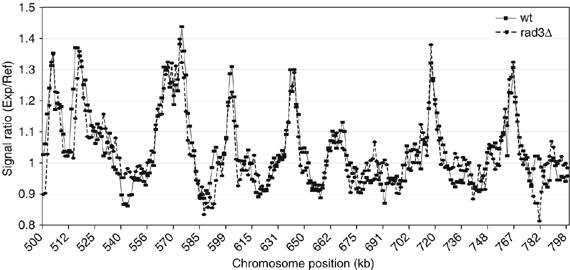
Origin firing in a rad3Δ mutant. Comparison of wild type and rad3Δ replication profile from HU experiments of a 300 kb region from Chromosome 3. Cells were blocked in HU for 90 min after release from G2 (see Materials and methods).
Thirty-two of 35 origins (91%) previously characterized by 2D-gel analysis (Segurado et al, 2003) mapped to our 401 origins. We compared our data with a bioinformatic analysis that proposed that origins were A+T-rich islands with at least a 72% AT-content in a 1000 bp window (Segurado et al, 2003). This analysis identified 324 putative origins in regions of the genome covered by our microarrays, 87% of which co-localized with our origins. We also compared our data with 321 origins identified on ORF microarrays in checkpoint deficient fission yeast cells in the presence of HU (Feng et al, 2006), and found an 84% overlap in these origin positions with our 401 origins (Supplementary data, origin lists). The gaps between these 401 origins were spaced from 3 to 114 kb, with a mean interorigin distance of 31 kb (Figure 4). They co-localized with A+T-rich islands (∼75% AT content in a 500 bp window) that mapped to large intergenic regions (2190 bp) compared to an average size of 952 bp (Wood et al, 2002; Segurado et al, 2003). These data indicate that there is a preference of origins for larger intergenic regions (Segurado et al, 2003). Next, we examined the timing of replication of different chromosomal regions. Overall, Chromosome 3 replicated 3 min earlier than Chromosomes 1 and 2, and the left arm of Chromosome 2 replicated 2 min earlier than the right arm. These are small differences in timing, although it should be remembered that the overall length of S-phase in fission yeast is only about 20 min (Mitchison and Creanor, 1971). Most origins replicated in a 10-min window early in S-phase (70–80 min). Only 7% of origins replicated later (>80 min); many of these were found in the subtelomeric regions on chromosomes 1 and 2, regions that replicated up to 9 min later than average. No late origins were identified on chromosome 3. Some origins near the centromeres and mating type locus replicated up to 9 min earlier than average.
Figure 4.
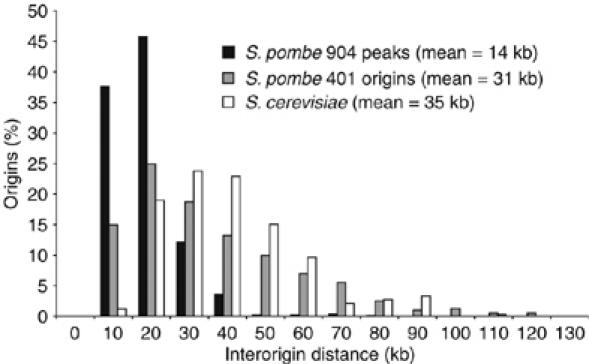
Comparison of interorigin distances in fission yeast and budding yeast. Histogram of the interorigin distance for 401 origins, the 904 peaks identified in the HU experiment and 332 origins of budding yeast (Raghuraman et al, 2001).
These data have allowed us to identify 401 strong origins genome-wide, which include between 80 and 90% of previously published origins, and has also shown that the Rad3 dependent S-phase checkpoint does not affect the identification of origins. Our data contrast with the findings by Feng et al (2006), which did not identify 39% of origins in the presence of HU in a wild-type strain compared with an S-phase checkpoint deficient strain in fission yeast. In our study, all but two origins could be identified both in wild type and the rad3 checkpoint mutant. We speculate that the reason for the discrepancy between the two studies may be the use of ssDNA for origin identification (Feng et al, 2006). It has been shown in budding yeast that replication forks collapse in a checkpoint deficient strain in the presence of HU, which leads to fork reversal at stalled replication forks and the formation of extended ssDNA intermediates along the replication fork (Sogo et al, 2002). Possibly the processing of the short single-stranded DNA templates for microarray hybridization derived from wild-type cells was inefficient compared with the processing of the typically longer templates, which would be expected in the checkpoint deficient cells (Sogo et al, 2002; Feng et al, 2006). In budding yeast, late-firing replication origins are suppressed by the S-phase checkpoint (Santocanale and Diffley, 1998). Feng et al (2006) conclude that the S-phase checkpoint in fission yeast and budding yeast have a similarly strong effect on the inhibition of late-firing origins. We suggest that this effect is much stronger in budding yeast where the checkpoint interferes with the identification of up to 66% of origins (Yabuki et al, 2002; Feng et al, 2006) compared with our estimate of 2–3% (10 in total) in fission yeast. The data from our time-course experiment indicate that late origins are not common in fission yeast, which confirms previous observations (Kim and Huberman, 2001), and could explain why the rad3 checkpoint mutant does not suppress the firing of a large subset of origins.
Identifying origins used during the meiotic cell cycle
Premeiotic S-phase in eukaryotes is extended compared with mitotic S-phase (Collins and Newlon, 1994) and is followed by high levels of recombination. To investigate whether changes in origin usage might contribute to these developmental differences, we mapped origin localization in meiotic cells. Cells were synchronized in the meiotic cell cycle using a temperature-sensitive pat1-114 mutant strain, which undergoes a synchronous meiotic cell cycle when incubated at 34°C (Figure 5A) (Bähler et al, 1991). The time to complete DNA replication during the synchronous premeiotic S-phase culture was about 30% extended compared with the time in a synchronous mitotic S-phase culture (compare Figures 1A and 5A). Both time-course and HU experiments were performed and a typical 300 kb region is shown in Figure 5B. There was almost a complete overlap of origins between the S-phases of meiotic and mitotic cell cycles (Figure 5C). Only five origins (1%) were not operative in the meiotic cell cycle, and no origins fired only in the meiotic cell cycle (see Supplementary data, origin lists). We conclude that the origins used in meiosis and mitosis are essentially identical.
Figure 5.
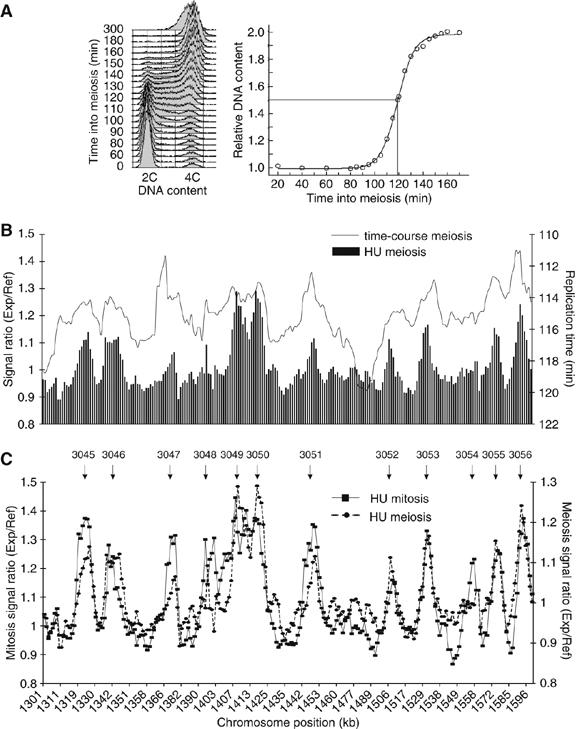
Mapping of origins in premeiotic S-phase. (A) Left panel: FACS analysis of a synchronous premeiotic S-phase (see Materials and methods). Right panel: Replication kinetics of a synchronous cell population in premeiotic S-phase (see Materials and methods). Bulk DNA replication takes place between 90 and 150 min. (B) Comparison of replication profiles from the time course and HU experiments in premeiotic S-phase. A 300 kb region of Chromosome 3 is shown. (C) Mitotic and meiotic replication profiles of the HU experiment are superimposed along the region shown in (B). Arrows indicate positions of origins.
Efficiency of origin utilization
We next estimated the efficiency of origin usage in both mitotic and premeiotic S-phases, excluding the eight origins that were significantly affected by the Rad3 dependent S-phase checkpoint. Origins used efficiently would fire in most cell cycles and would exhibit a high signal ratio in the HU experiments, while origins used inefficiently would exhibit lower ratios. To validate our approach for estimating origin efficiencies, we compared our efficiency estimates with those obtained from 15 origins previously studied by single molecule analysis of combed DNA (Patel et al, 2006). The correlation between the two data sets was 92% (Figure 6), from which we conclude that the signal ratio observed in HU can be used to estimate the efficiency of origin utilization. The average efficiency was found to be 29% during mitotic S-phase (Figure 7A). Combining these data with estimates of replication fork velocity (2.8 kb/min) determined from the time taken for origin flanking regions to become replicated in the time-course experiments (Figure 8), the minimum length of S-phase was calculated to be 19 min, close to the 20 min measured experimentally (Mitchison and Creanor, 1971). Plotting the efficiency of origin utilization as a function of replication time during S-phase revealed a good correlation (Figure 7B), indicating that early origins tend to be more efficient than those that fire late. Finally, we observed different large chromosomal domains enriched either for efficient or inefficient origins; for example, two ∼1.3 Mb clusters of efficient origins were found on Chromosome 1 (Figure 7C) and two smaller ∼500 kb clusters of efficient origins on the left arm of Chromosome 2 (Figure 7D, gray bars).
Figure 6.
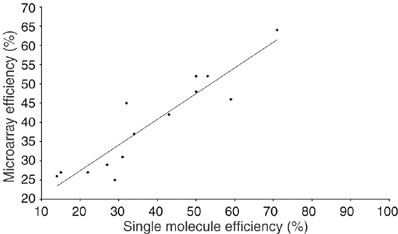
Comparison of origin efficiencies from single molecule and microarray analyses. Origin efficiencies estimated from 15 origins analyzed on single DNA molecules (Patel et al, 2006) were plotted against origin efficiency estimates from our microarrays.
Figure 7.
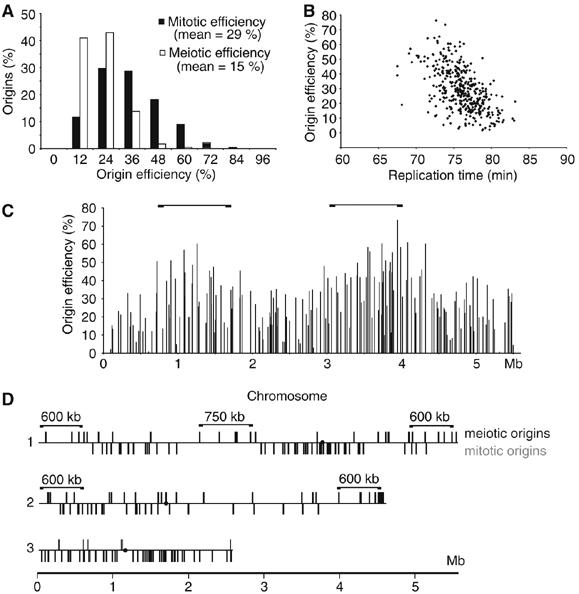
Origin efficiencies in mitotic and premeiotic S-phase. (A) Origin efficiency is higher in mitotic than in premeiotic S-phase. The signal ratio was used to estimate the efficiency of 401 origins in meiosis and mitosis. A histogram of efficiency distribution is shown. (B) Origin efficiency and time of replication shows a negative correlation in mitotic S-phase. The efficiency of origins was plotted as a function of origin replication time. (C) Two large domains (∼1.3 Mb) of efficient mitotic origins on Chromosome 1 are marked with brackets. (D) Clusters of origins (black bars) that are at least two-fold induced in premeiotic S-phase are indicated (brackets). Origins that are more than 35% efficient in mitotic S-phase were plotted on the same line below (gray bars). The position of centromeres is marked with a dot.
Figure 8.
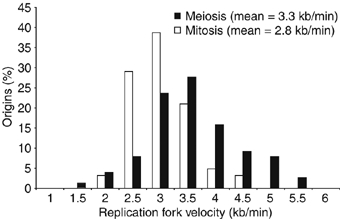
Replication fork velocities in mitotic and premeiotic S-phase. Replication fork velocity was determined from the replication timing profiles by measuring the gradient of replication forks from 31 mitotic and 38 meiotic origins.
The average efficiency of origins in premeiotic S-phase was only 15% (Figure 7A), half that of mitotic S-phase. Also meiotic origin efficiencies did not always correlate with mitotic ones. To investigate this further, we identified origins that were utilized at least twice as efficiently in premeiotic S-phase compared with mitotic S-phase. These mostly mapped within 600 kb of telomeres and within a 750 kb segment located on Chromosome 1 (Figure 7D, black bars). The same areas were also found to be depleted of efficient origins during mitotic S-phase (Figure 7D, gray bars). We speculate that these segments may correspond to more condensed regions of the chromosome, which may become de-condensed during premeiotic S-phase to be more available for recombination and hence for DNA replication initiation factors. The transcriptional activation of regions near telomeres repressed by various Clr silencing proteins, which become transcriptionally activated during meiosis, is consistent with this speculation (Mata et al, 2002; Hansen et al, 2005). Replication fork velocity was determined to be approximately 3.3 kb/min during premeiotic S-phase (cells at 34°C), similar to the 2.8 kb/min during mitotic S-phase (cells at 25°C) (Figure 8). Based on an origin utilization efficiency of 15%, we estimate that 59 origins are used during premeiotic S-phase, which leads to a predicted length of 32 min, longer than the 19 min calculated for mitotic S-phase. Thus, less efficient utilization of origins can account for a longer duration of premeiotic S-phase compared with mitotic S-phase.
To investigate the uneven distribution of origin spacing (ranging from 3 to over 100 kb), a long gap region on Chromosome 2, which replicates late and consists of very few origins, was examined (Figure 9A and B). We identified five additional peaks between two flanking origins, a subset of the 503 minor peaks described earlier. The presence of less efficient origins in regions depleted of efficient origins helps explain how these regions become replicated. The average AT-content for all the small HU peaks throughout the genome was 72% (500 bp window) and their average efficiency was 8%. We suggest that many of the 503 peaks represent weak origins, which could assist the bridging of unreplicated large gaps between more efficient origins. The average distance between the total of 904 putative origins was 14 kb (Figure 4). Our findings differ from previous conclusions that interorigin distances in fission yeast and budding yeast are similar at around 35 kb (Feng et al, 2006). Instead we find that the average spacing of 14 kb between origins is more similar to the ∼10 kb spacing of origins observed in embryonic Drosophila and Xenopus cells (Hyrien et al, 2003). These data support the view that in organisms where origins are not defined by a clear consensus sequence, a continuum of potential origins exists, with a range of efficiencies (Dai et al, 2005), which may be differentially activated in different developmental situations, such as in cells undergoing meiosis.
This is the first genome-wide analysis of origin efficiencies in a eukaryotic organism. During the mitotic cell cycle of the fission yeast, some origins are used efficiently, around once every two cell cycles; however, many origins operate once every five cell cycles and some, which contribute only a minor part of total replication operate only every 10–20 cell cycles. Thus, in fission yeast, the pattern of origin usage is different to budding yeast where about half of origins are used in more than 50% of cell cycles (Friedman et al, 1997; Poloumienko et al, 2001), but is similar to the generally inefficient origin usage observed in metazoan cells (Macalpine and Bell, 2005; Machida et al, 2005; Mesner et al, 2006). Our results also showed that more efficient origins tend to fire early in S-phase while less efficient origins tend to fire later. This may explain in part the temporal program of origin firing during S-phase. Finally, the presence of chromosomal domains consisting of efficient and inefficient origins and origins induced in premeiotic S-phase establishes that chromosomal context is important for origin activity.
Materials and methods
Strains and growth conditions
Standard media and methods were used (Moreno et al, 1991; Hayles and Nurse, 1992). Cdc25-22ts cells were synchronized by growing in minimal medium (EMM) at 25°C to 1.6 × 10⁶/ml, shifting to 36.5°C for 3.5 h to block cells in G2, followed by release at 25°C with or without addition of 11 mM HU. Samples for DNA were taken every 5–10 min during the synchronous S-phase and at 90 min into the HU block. The reference for all time points was cells blocked in G2 with haploid 2C DNA content (time 0). Synchronous meiosis was induced using pat1-114ts/pat1-114ts ade-M210/ade6-M216 h+/h+ diploid cells grown to 8 × 10⁶/ml in EMM, re-suspended in EMM without NH4Cl (EMM-N) at 2.7 × 10⁶/ml and incubated for 14 h at 25°C. Meiosis was induced by shifting to 34°C after adding 0.05% NH4Cl, with or without 11 mM HU. Samples for DNA were taken every 5–10 min during premeiotic S-phase and at 3 and 4 h into the HU block. The reference was diploid pat1-114 nitrogen starved cells blocked in G1 with diploid 1C DNA content. Experiments were carried out at least in duplicate. Cells were fixed in 70% ethanol/dH2O and processed for FACS. Septa of re-hydrated cells were stained with calcofluor and DNA was stained with DAPI (4′,6,diamidino-2-phenylindole). Cell number was determined using a Coulter counter with cells fixed in formal saline.
Microarray design
The microarrays used were ORF arrays covering the coding regions and intergenic arrays covering all noncoding regions. ORF microarrays were designed as described (Lyne et al, 2003). The intergenic microarrays were developed using similar approaches as follows: for intergenic regions larger than 2 kb, we produced more than one PCR probe, and the average probe length is ∼1 kb. In total, there are ∼5200 intergenic probes ranging in size from 100 bp to 2 kb, which are printed in duplicate onto arrays. The interprobe distance was 1.3 kb on average. The microarrays do not cover the ∼1.2 Mb rDNA repeats proximal to the telomeres on Chromosome 3, and the centromere core regions.
DNA preparation and microarray experiments
A maximum of 109 cells were harvested by filtration and washed once with 50 ml of ice-cold buffer (50 mM MOPS pH 7.2, 150 mM potassium acetate, 2mM magnesium chloride) with 0.1% sodium azide, then washed again with 50 ml of buffer alone. Genomic DNA was purified from cells as described (Wu and Gilbert, 1995). DNA yield and quality was determined by gel-electrophoresis and spectrophotometry, and 600 ng of DNA labelled (Fiegler et al, 2003). Purified experimental DNA was mixed with the reference DNA (Cy3/Cy5 or vice versa) for differential hybridization. DNA was precipitated with 1/10th volume of 3 M NaAc pH 5.2 and 3 volumes of 100% ethanol at −70°C for 30 min. Samples were centrifuged for 15 min at 16100 g in a microcentrifuge and the pellet was washed with 100 μl 70% ethanol/dH2O (4°C), dried and resuspended in 70 μl of hybridization buffer (5 × SSC, 6 × Denhardt's, 60 mM Tris–HCl pH 7.6, 0.12% sarkosyl, 48% formamide; filter sterilized). An aliquot of 30 μl was hybridized to microarrays at 49°C in a Grant Boekel hybridization oven for 16 h. Slides were washed and stored in the dark for scanning. A detailed protocol for hybridization and slide washing is available at this URL: http://www.sanger.ac.uk/PostGenomics/S_pombe/. We carried out two independent time-course experiments for both mitosis and meiosis. The HU experiments were performed at least in duplicate.
Data acquisition and analysis
Data acquisition, processing and normalization were as described (Lyne et al, 2003) based on the genome sequence of April 2004. This and current sequence data can be obtained from the Sanger Institute ftp server at ftp://ftp.sanger.ac.uk/pub/yeast/pombe/Chromosome_contigs/. The relative DNA content during S-phase was measured using data from flow cytometry profiles and logistic curves were fitted using XlFit 4.0 (ID Business Solutions Ltd, Surrey, UK). The DNA content on the curve was used to scale microarray signals during the time-course experiments. Normalized signals were exported from GeneSpring (Agilent Technologies UK Limited, Cheshire, UK) into Microsoft Excel. Data from ORF and intergenic microarrays were combined in sequential order of chromosome position. To normalize for any dye bias, signal ratios of all time points in time-course and HU experiments were divided by signals obtained from self/self-hybridizations of a sample at time 0 from the same culture. For the mitotic and meiotic time-course, a sigmoid curve of signal ratio as a function of time was fitted for each probe using the regression analysis in XlFit 4.0, and the time at which 50% of each probe was replicated was determined and plotted against chromosome position. Microsoft Excel pivot tables and graphs were used to construct the replication profiles for all experiments. Replication profiles for the time-course experiment were constructed from a moving average over five probes; all other plots from moving averages over three probes. The probability that three adjacent probes had signal ratios above 1.1 (P=5 × 10⁻⁸) and five adjacent probes had signal ratios above 1.01 (P=0.0038) was calculated from the background noise of signals obtained from a self/self-hybridization of G2-blocked cells. This was used as a threshold for mapping the 401 origins and the 503 additional peaks, respectively, in HU experiments. For calculation of origin efficiency, the increase in signal ratio from 1 to 2 was converted into %increase (0–100%). To calculate the signal ratio, which corresponds to a 100% increase in DNA content, DNA from cdc25-22 cells consisting of a minichromosome (CH16) that represents a duplication of the central 500 Mb of Chromosome 3 blocked in G2 of the cell cycle was hybridized to DNA from cells lacking the minichromosome. The average hybridization signal in both the ORF and intergenic microarrays was 1.8 in the duplicated region (data not shown). Subsequently, the highest signal ratio (central probe) obtained for each origin was scaled by dividing signal ratio increases by a factor of 0.83 (taking into account 3% minichromosome loss in this background). All processed data are available from our website: http://www.sanger.ac.uk/PostGenomics/S_pombe/. Current genome annotation status can be viewed on http://www.sanger.ac.uk/Projects/S_pombe/. A+T-rich islands that were closely spaced were grouped for comparative analysis with microarray origins if two or more A+T-rich islands co-localized with a single peak on the replication profiles.
Supplementary Material
Supplementary Data
Acknowledgments
We thank Aengus Stewart at Cancer Research UK for help with the bioinformatic analysis as well as Juan Mata and Gavin Burns of the Fission Yeast Functional Genomics Group for discussions and initial help with microarray experiments. We are also grateful to Francisco Antequera for providing mapping data from the bioinformatic analysis and useful suggestions, to Nick Rhind for sharing unpublished data and to all members of the Cell Cycle Laboratory for critical reading of the manuscript. This study was supported by Cancer Research UK, the Rockefeller University, the Hamilton Street Family Foundation and the Breast Cancer Research Foundation.
References
- Bähler J, Schuchert P, Grimm C, Kohli J (1991) Synchronized meiosis and recombination in fission yeast: observations with pat1-114 diploid cells. Curr Genet 19: 445–451 [DOI] [PubMed] [Google Scholar]
- Beach D, Nurse P (1981) High-frequency transformation of the fission yeast Schizosaccharomyces pombe. Nature 290: 140–142 [DOI] [PubMed] [Google Scholar]
- Bentley NJ, Holtzman DA, Flaggs G, Keegan KS, DeMaggio A, Ford JC, Hoekstra M, Carr AM (1996) The Schizosaccharomyces pombe rad3 checkpoint gene. EMBO J 15: 6641–6651 [PMC free article] [PubMed] [Google Scholar]
- Berezney R, Dubey DD, Huberman JA (2000) Heterogeneity of eukaryotic replicons, replicon clusters, and replication foci. Chromosoma 108: 471–484 [DOI] [PubMed] [Google Scholar]
- Clyne RK, Kelly TJ (1995) Genetic analysis of an ARS element from the fission yeast Schizosaccharomyces pombe. EMBO J 14: 6348–6357 [DOI] [PMC free article] [PubMed] [Google Scholar]
- Collins I, Newlon CS (1994) Chromosomal DNA replication initiates at the same origins in meiosis and mitosis. Mol Cell Biol 14: 3524–3534 [DOI] [PMC free article] [PubMed] [Google Scholar]
- Dai J, Chuang RY, Kelly TJ (2005) DNA replication origins in the Schizosaccharomyces pombe genome. Proc Natl Acad Sci USA 102: 337–342 [DOI] [PMC free article] [PubMed] [Google Scholar]
- DePamphilis ML (2005) Cell cycle dependent regulation of the origin recognition complex. Cell Cycle 4: 70–79 [DOI] [PubMed] [Google Scholar]
- Dubey DD, Zhu J, Carlson DL, Sharma K, Huberman JA (1994) Three ARS elements contribute to the ura4 replication origin region in the fission yeast, Schizosaccharomyces pombe. EMBO J 13: 3638–3647 [DOI] [PMC free article] [PubMed] [Google Scholar]
- Fantes P (1979) Epistatic gene interactions in the control of division in fission yeast. Nature 279: 428–430 [DOI] [PubMed] [Google Scholar]
- Feng W, Collingwood D, Boeck ME, Fox LA, Alvino GM, Fangman WL, Raghuraman MK, Brewer BJ (2006) Genomic mapping of single-stranded DNA in hydroxyurea-challenged yeasts identifies origins of replication. Nat Cell Biol 8: 148–155 [DOI] [PMC free article] [PubMed] [Google Scholar]
- Fiegler H, Carr P, Douglas EJ, Burford DC, Hunt S, Scott CE, Smith J, Vetrie D, Gorman P, Tomlinson IP, Carter NP (2003) DNA microarrays for comparative genomic hybridization based on DOP-PCR amplification of BAC and PAC clones. Genes Chromosomes Cancer 36: 361–374 [DOI] [PubMed] [Google Scholar]
- Friedman KL, Brewer BJ, Fangman WL (1997) Replication profile of Saccharomyces cerevisiae chromosome VI. Genes Cells 2: 667–678 [DOI] [PubMed] [Google Scholar]
- Gould KL, Moreno S, Tonks NK, Nurse P (1990) Complementation of the mitotic activator, p80cdc25, by a human protein-tyrosine phosphatase. Science 250: 1573–1576 [DOI] [PubMed] [Google Scholar]
- Hansen KR, Burns G, Mata J, Volpe TA, Martienssen RA, Bahler J, Thon G (2005) Global effects on gene expression in fission yeast by silencing and RNA interference machineries. Mol Cell Biol 25: 590–601 [DOI] [PMC free article] [PubMed] [Google Scholar]
- Hayles J, Nurse P (1992) Genetics of the fission yeast Schizosaccharomyces pombe. Annu Rev Genet 26: 373–402 [DOI] [PubMed] [Google Scholar]
- Hyrien O, Marheineke K, Goldar A (2003) Paradoxes of eukaryotic DNA replication: MCM proteins and the random completion problem. Bioessays 25: 116–125 [DOI] [PubMed] [Google Scholar]
- Kim SM, Huberman JA (2001) Regulation of replication timing in fission yeast. EMBO J 20: 6115–6126 [DOI] [PMC free article] [PubMed] [Google Scholar]
- Kong D, Coleman TR, DePamphilis ML (2003) Xenopus origin recognition complex (ORC) initiates DNA replication preferentially at sequences targeted by Schizosaccharomyces pombe ORC. EMBO J 22: 3441–3450 [DOI] [PMC free article] [PubMed] [Google Scholar]
- Lemaitre JM, Danis E, Pasero P, Vassetzky Y, Mechali M (2005) Mitotic remodeling of the replicon and chromosome structure. Cell 123: 787–801 [DOI] [PubMed] [Google Scholar]
- Lyne R, Burns G, Mata J, Penkett CJ, Rustici G, Chen D, Langford C, Vetrie D, Bahler J (2003) Whole-genome microarrays of fission yeast: characteristics, accuracy, reproducibility, and processing of array data. BMC Genomics 4: 27. [DOI] [PMC free article] [PubMed] [Google Scholar]
- Macalpine DM, Bell SP (2005) A genomic view of eukaryotic DNA replication. Chromosome Res 13: 309–326 [DOI] [PubMed] [Google Scholar]
- Machida YJ, Hamlin JL, Dutta A (2005) Right place, right time, and only once: replication initiation in metazoans. Cell 123: 13–24 [DOI] [PubMed] [Google Scholar]
- Mata J, Lyne R, Burns G, Bahler J (2002) The transcriptional program of meiosis and sporulation in fission yeast. Nat Genet 32: 143–147 [DOI] [PubMed] [Google Scholar]
- Mesner LD, Crawford EL, Hamlin JL (2006) Isolating apparently pure libraries of replication origins from complex genomes. Mol Cell 21: 719–726 [DOI] [PubMed] [Google Scholar]
- Mitchison JM, Creanor J (1971) Further measurements of DNA synthesis and enzyme potential during cell cycle of fission yeast Schizosaccharomyces pombe. Exp Cell Res 69: 244–247 [DOI] [PubMed] [Google Scholar]
- Moreno S, Klar A, Nurse P (1991) Molecular genetic analysis of fission yeast Schizosaccharomyces pombe. Methods Enzymol 194: 795–823 [DOI] [PubMed] [Google Scholar]
- Patel PK, Arcangioli B, Baker SP, Bensimon A, Rhind N (2006) DNA replication origins fire stochastically in fission yeast. Mol Biol Cell 17: 308–316 [DOI] [PMC free article] [PubMed] [Google Scholar]
- Poloumienko A, Dershowitz A, De J, Newlon CS (2001) Completion of replication map of Saccharomyces cerevisiae chromosome III. Mol Biol Cell 12: 3317–3327 [DOI] [PMC free article] [PubMed] [Google Scholar]
- Raghuraman MK, Winzeler EA, Collingwood D, Hunt S, Wodicka L, Conway A, Lockhart DJ, Davis RW, Brewer BJ, Fangman WL (2001) Replication dynamics of the yeast genome. Science 294: 115–121 [DOI] [PubMed] [Google Scholar]
- Russell P, Nurse P (1986) cdc25+ functions as an inducer in the mitotic control of fission yeast. Cell 45: 145–153 [DOI] [PubMed] [Google Scholar]
- Santocanale C, Diffley JF (1998) A Mec1- and Rad53-dependent checkpoint controls late-firing origins of DNA replication. Nature 395: 615–618 [DOI] [PubMed] [Google Scholar]
- Segurado M, de Luis A, Antequera F (2003) Genome-wide distribution of DNA replication origins at A+T-rich islands in Schizosaccharomyces pombe. EMBO Rep 4: 1048–1053 [DOI] [PMC free article] [PubMed] [Google Scholar]
- Sogo JM, Lopes M, Foiani M (2002) Fork reversal and ssDNA accumulation at stalled replication forks owing to checkpoint defects. Science 297: 599–602 [DOI] [PubMed] [Google Scholar]
- Theis JF, Newlon CS (1997) The ARS309 chromosomal replicator of Saccharomyces cerevisiae depends on an exceptional ARS consensus sequence. Proc Natl Acad Sci USA 94: 10786–10791 [DOI] [PMC free article] [PubMed] [Google Scholar]
- Vashee S, Cvetic C, Lu W, Simancek P, Kelly TJ, Walter JC (2003) Sequence-independent DNA binding and replication initiation by the human origin recognition complex. Genes Dev 17: 1894–1908 [DOI] [PMC free article] [PubMed] [Google Scholar]
- Wood V, Gwilliam R, Rajandream MA, Lyne M, Lyne R, Stewart A, Sgouros J, Peat N, Hayles J, Baker S, Basham D, Bowman S, Brooks K, Brown D, Brown S, Chillingworth T, Churcher C, Collins M, Connor R, Cronin A, Davis P, Feltwell T, Fraser A, Gentles S, Goble A, Hamlin N, Harris D, Hidalgo J, Hodgson G, Holroyd S, Hornsby T, Howarth S, Huckle EJ, Hunt S, Jagels K, James K, Jones L, Jones M, Leather S, McDonald S, McLean J, Mooney P, Moule S, Mungall K, Murphy L, Niblett D, Odell C, Oliver K, O'Neil S, Pearson D, Quail MA, Rabbinowitsch E, Rutherford K, Rutter S, Saunders D, Seeger K, Sharp S, Skelton J, Simmonds M, Squares R, Squares S, Stevens K, Taylor K, Taylor RG, Tivey A, Walsh S, Warren T, Whitehead S, Woodward J, Volckaert G, Aert R, Robben J, Grymonprez B, Weltjens I, Vanstreels E, Rieger M, Schafer M, Muller-Auer S, Gabel C, Fuchs M, Dusterhoft A, Fritzc C, Holzer E, Moestl D, Hilbert H, Borzym K, Langer I, Beck A, Lehrach H, Reinhardt R, Pohl TM, Eger P, Zimmermann W, Wedler H, Wambutt R, Purnelle B, Goffeau A, Cadieu E, Dreano S, Gloux S, Lelaure V, Mottier S, Galibert F, Aves SJ, Xiang Z, Hunt C, Moore K, Hurst SM, Lucas M, Rochet M, Gaillardin C, Tallada VA, Garzon A, Thode G, Daga RR, Cruzado L, Jimenez J, Sanchez M, del Rey F, Benito J, Dominguez A, Revuelta JL, Moreno S, Armstrong J, Forsburg SL, Cerutti L, Lowe T, McCombie WR, Paulsen I, Potashkin J, Shpakovski GV, Ussery D, Barrell BG, Nurse P (2002) The genome sequence of Schizosaccharomyces pombe. Nature 415: 871–880 [DOI] [PubMed] [Google Scholar]
- Wu JR, Gilbert DM (1995) Rapid DNA preparation for 2D gel analysis of replication intermediates. Nucleic Acids Res 23: 3997–3998 [DOI] [PMC free article] [PubMed] [Google Scholar]
- Xu YJ, Davenport M, Kelly TJ (2006) Two-stage mechanism for activation of the DNA replication checkpoint kinase Cds1 in fission yeast. Genes Dev 20: 990–1003 [DOI] [PMC free article] [PubMed] [Google Scholar]
- Yabuki N, Terashima H, Kitada K (2002) Mapping of early firing origins on a replication profile of budding yeast. Genes Cells 7: 781–789 [DOI] [PubMed] [Google Scholar]
Associated Data
This section collects any data citations, data availability statements, or supplementary materials included in this article.
Supplementary Materials
Supplementary Data


