

Abstract
p63 is a developmentally regulated transcription factor related to p53. It is involved in the development of ectodermal tissues, including limb, skin and in general, multilayered epithelia. The ΔNp63α isoform is thought to play a ‘master' role in the asymmetric division of epithelial cells. It is also involved in the pathogenesis of several human diseases, phenotypically characterized by ectodermal dysplasia. Our understanding of transcriptional networks controlled by p63 is limited, owing to the low number of bona fide targets. To screen for new targets, we employed chromatin immunoprecipitation from keratinocytes (KCs) coupled to the microarray technology, using both CpG islands and promoter arrays. The former revealed 96 loci, the latter yielded 85 additional genes. We tested 40 of these targets in several functional assays, including: (i) in vivo binding by p63 in primary KCs; (ii) expression analysis in differentiating HaCaT cells and in cells overexpressing ΔNp63α; (iii) promoter transactivation and (iv) immunostaining in normal tissues, confirming their regulation by p63. We discovered several new specific targets whose functional categorization links p63 to cell growth and differentiation.
Keywords: ChIP on chip, p63, skin, targets
Introduction
p63 is a transcription factor (TF) homologous to p53 and p73 which binds DNA in a sequence-specific way. p63 has two different transcription initiation sites generating proteins containing (TA) or lacking (ΔN) an activation domain. The 3′ end of the gene is involved in alternative splicing of three isoforms, termed α, β and γ. Hence, a minimum of six p63 isoforms are present in cells, at various levels of relative expression.
Unlike p53, p63 is not ubiquitously expressed, and is involved in developmental processes (Mills et al, 1999; Yang et al, 1999). In particular, compelling genetic evidence indicates that it plays a central role in the development of ectodermal tissues (Koster and Roop, 2004; Barbieri and Pietenpol, 2006). (i) In humans, the ankyloblepharon—ectodermal defects—cleft lip/palate (AEC), the ectrodactily, ectodermal dysplasia and cleft lip/palate 3 (EEC) and the split-hand/foot malformation 4 (SHFM) syndromes, caused by mutations in the p63 gene, show clinical variability, with sparse hair, dry skin, pilosebaceous gland dysplasia and oligodontia, as well as association of ectodermal dysplasia with cleft lip/palate and limb abnormalities (Brunner et al, 2002). (ii) p63 knockout (KO) mice die soon after birth with severe defects in limb, craniofacial and skin development (Mills et al, 1999; Yang et al, 1999). (iii) In zebrafish, the ΔNα isoform is required for epithelial development (Lee and Kimelman, 2002). It is clear, therefore, that p63 is a master regulatory gene of multilayered epithelia in general, and of keratinocytes (KCs) in particular (Koster et al, 2004).
Most genes reported so far to be targeted in vivo by p63 were identified through three conventional strategies: (i) p21, 14-3-3σ (Westfall et al, 2003), REDD1 (Ellisen et al, 2002), PERP (Ihrie et al, 2005) and p57 (Beretta et al, 2005) by analogy to p53-controlled genes; (ii) profiling analysis of cells in which mainly p63γ or α were overexpressed identified JAG1 (Sasaki et al, 2002; Wu et al, 2003), CD95 (Gressner et al, 2005), EVPL, SMARCD3 (Osada et al, 2005) and WNT4 (Osada et al, 2006). (iii) a screening with p63 silenced by siRNA led to the identification of IGFBP-3 (Barbieri et al, 2005). The majority of the p63 targets identified so far were further validated by chromatin immunoprecipitation (ChIP) from cells overexpressing p63 in non-p63-expressing background—PERP, p21, 14-3-3s, ITAG3 and IGFBP-3—or from p63-expressing KCs, HEK cells or mouse tissues (Westfall et al, 2003; Kurata et al, 2004; Barbieri et al, 2005; Ihrie et al, 2005). This latter point is particularly relevant because of the transcriptional intersection between p63, p53 and p73. As cells that express p63 also express the ubiquitous p53, one key issue to separate the relative transcriptional roles is to identify specific targets of the two TFs. Given the high homology of their DNA-binding domains and the loose specificity of the consensus sequence (Osada et al, 2005), many are likely to be common (Harms et al, 2004). It is apparent from the genetic data, though, that p63 has unique DNA interactions and governs the relative set of genes expressed in ectodermal tissues.
One of the methods to identify targets in vivo in an unbiased way is to use the ChIP on chip technique, which couples ChIP to the use of slides containing genomic DNA fragments or oligonucleotides. Several microarrays have been described so far, ranging from CpG islands and promoters, to tiling oligo arrays. Many TFs were analyzed with this technique, including cell cycle regulators such as E2Fs, and developmentally important factors such as HNFs, MRFs and OCT4-NANOG-SOX2 (reviewed by Kirmizis and Farnham, 2004; Blais and Dynlacht, 2005). The need to elucidate the transcriptional network governed by p63 in ectodermal tissues prompted us to employ this technology to identify genome-wide p63 targets in human immortalized HaCaT KCs using two different platforms: the 12K CpG islands and 12K promoters arrays.
Results
Identification of p63-bound loci
To identify novel p63 target genes, we performed ChIP on chip experiments with the human HaCaT KCs, which predominantly express the ΔNp63α isoform. Crosslinked chromatin was immunoprecipitated with a polyclonal antibody generated against the full-length p63α protein (Beretta et al, 2005), and the α-Flag antibody was used as negative control. Figure 1A shows the enrichment of the p63 IP material with three known targets (14-3-3σ, mdm2 and p21). Four independent ChIPs were pooled and two sets of amplicons generated by LM-PCR. These amplicons were of 200–400 bp in size (Figure 1B) and the specific enrichment was further controlled, as shown in Figure 1C. In parallel, we subjected input DNA to the same LM-PCR procedure and input amplicons were used as a reference for all the CpG island hybridizations. This material was sufficient for independent hybridizations on the 12K CpG islands and the 12K promoter arrays.
Figure 1.
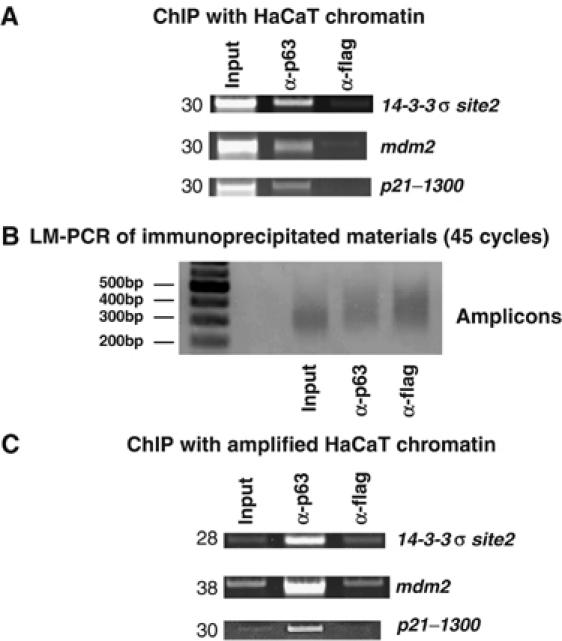
Generation of the ChIP amplicons for ChIP on chip experiments. (A) ChIP of HaCaT cells with α-p63 and control α-Flag antibodies. The known targets tested are indicated. Numbers on the left represent the PCR cycles. (B) Size distribution of the amplicons generated after 45 cycles of PCR. Molecular weight markers are indicated on the left lane. (C) Control of relative enrichment of the indicated amplicons with the same genomic targets tested in (A).
We screened the library of approximately 12 000 clones representing genomic fragments containing CpG islands. We performed three independent hybridizations on six different 12K arrays. We obtained 803 clones with a p63/Flag ratio ⩾2 in the first experiment, corresponding to 560 mapped loci; 453 clones in the second one, (354 loci) and 173 in the third experiment (129 loci). We decided to focus on the 96 loci common to at least two experiments out of three. The list of these loci is shown in Supplementary Table 2, corresponding to 98 GenBank accession numbers (known genes, mRNAs or ESTs) plus nine loci mapping in regions where no genes or ESTs were found. Considering the redundancy of the 12K CpG island array and the 30% of spots that could not be unequivocally mapped (Heisler et al, 2005), we found 1.9% of 5144 loci represented on the array enriched in the α-p63 ChIP.
Next, we used the same p63-enriched material on an array containing PCR-amplified sequences corresponding to the promoters of about 12 000 human genes. We cohybridized the slides with the α-p63 and the α-Flag material, performing independent dye swaps. We considered promoter regions that displayed a p63/Flag ratio of >2 in at least three out of four slides. We found 65 promoters enriched for p63, corresponding to 85 GenBank reference sequences. As observed for the CpG islands regions, some promoters were bidirectional and associated to more than one gene. The list of these genes is shown in Supplementary Table 3.
Validation of targets
We chose 38 loci from both sets and performed semiquantitative PCR analysis of independent ChIPs from growing HaCaT cells. We selected these loci according to suitability of primer design, different positions of the hybridization regions with respect to the nearest gene (CpG island clones) and different functional categories. The strategy for locating specific p63 binding subregions was the following: in most cases, we designed the primer set in the proximal promoter of the selected loci, or in hybridization regions (CpG clones). In addition, we designed primer pairs close to predicted p53 consensus (emi)sites. A schematic representation of the selected loci, with the position of the associated genes, p53 sites and primer pairs is given in Supplementary Figures 1 and 2.
Figure 2 shows the results of the validation. Eleven loci from the CpG array and seven from the promoter array were strongly enriched for p63 (Figure 2A). Interestingly, we observe that in the tegt/BI-1 locus, both the promoter and the downstream locations were significantly enriched, even if this gene showed up only in 1/3 CpG island experiments; similarly, the wdfy2 locus is strongly enriched both in the promoter and the first intron. On the other hand, for the cited2 locus, only the upstream region is enriched. Figure 2B shows the validation of additional loci still significantly enriched in the α-p63 material, but to a much lower extent. For seven of these loci, we analyzed several subregions, but were unable to detect any additional p63 binding. For example, in the hoxc4 locus, p63 was associated to the upstream/intron region (see Supplementary Figure 2 for a scheme of locations) and weakly to the intron 1–2 region, whereas no binding was scored in the hybridization region or in the promoter. Considering the numbers of positive loci, the validation rate was 88% (35/38), with three loci from the CpG arrays being negative: his1, centg2 and gsc (Not shown). In summary, our lists provided 96+65 (161) genomic loci bound in vivo by ΔNp63α in HaCaT cells with a nearly 90% confidence.
Figure 2.
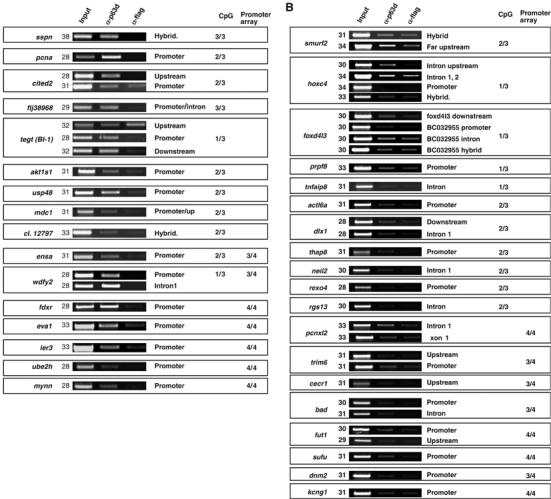
Validation of the loci from the screening. ChIP of HaCaT cells with α-p63 (middle lanes) and control α-Flag (right lanes) antibodies. (A) Displays the loci highly enriched, whereas (B) displays those weakly bound by p63. For each locus, the position of the primer set is indicated on the right (see Supplementary Figures 1 and 2 for a schematic representation). Numbers on the left refer to the PCR cycles. The numbers on the right side indicate the number of times the locus has been found positive in the CpG islands experiments (CpG), or in the promoter arrays. ensa and wdfy2 were scored in both platforms.
Functional mining of the genes
We manually assigned functional categories to each gene, using all information available at NCBI Entrez Gene, and ranked them according to their function. Figure 3A is a summary of this functional mining. The most highly represented systemic categories are: development, morphogenesis and tissue regeneration (40 genes) and cancer (18 genes). For specific cellular functions, we found 27 genes involved in cell adhesion and cytoskeleton, 23 in cell cycle and proliferation and 21 TFs. We also performed a statistical enrichment analysis for GO terms for the full, nonredundant target set obtained with the three combined CpG island experiments. This set was chosen in order to enlarge the number of genes and obtain more statistically significant results. As shown in Figure 3B, statistical enrichment (P-value<1.00E-04) for transcription regulation and RNA metabolism/structure is evident.
Figure 3.
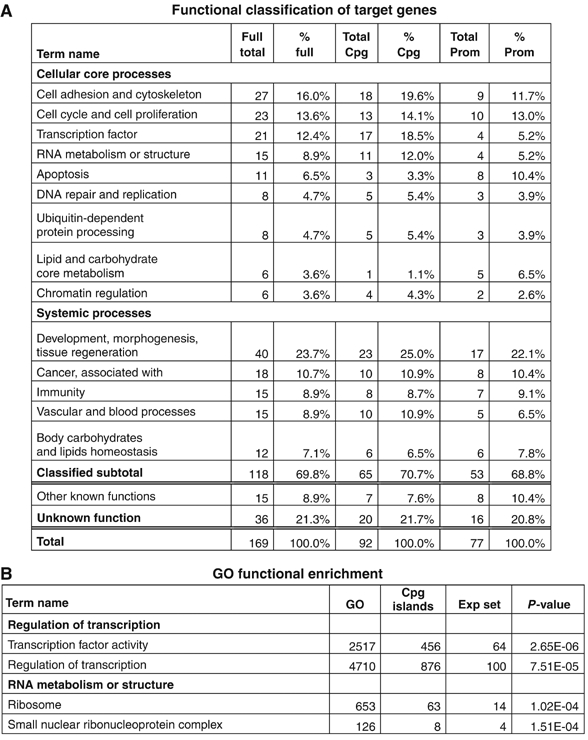
Functional classification of the genes. (A) Functional categories manually assigned to each gene from both the lists of CpG (2/3 positives) and promoters (3/4 positives), according to the annotation of NCBI EntrezGene. The columns show the total number of genes assigned to each category (full total), the percentage over the total number of genes (% full) and the relative number and percentages for each list (CpG or promoter). Note that 20% of genes remain unclassified. (B) Summarizes the results of the statistical GO functional enrichment obtained with the full nonredundant list of genes from all three CpG islands experiments. GO indicates the term number in the Gene Ontology library; CpG islands, the term number of the entire CpG island library (data obtained from http://derlab.med.utoronto.ca/CpGIslands.htm); Exp set refers to the term number in the list of positive clones and P-value indicates the statistical enrichment.
In vivo p63 binding in human primary KCs
We performed standard ChIP experiments in human primary KCs, which reflect a physiological cellular environment. We also included a p53 ChIP, as KCs possess wt p53 alleles, whereas HaCaT cells contain two mutated p53 genes (Lehman et al, 1993). As shown in Figure 4, all but two (mdc1 and pcna) of the 16 strong positives were bound by p63 in KCs, with two different antibodies (Figure 4, lanes 2 and 4). Six of these loci (sspn, cited2, usp48, clone12797, ensa and fdxr) were enriched also in the p53 ChIP (Figure 4, lane 3). Only fdxr had been previously reported to be regulated by p53 (Liu and Chen, 2002). As for loci weakly enriched in HaCaT cells, seven (smurf2, actl6a, dlx1, trim6, fut1, dnm2 and kcng) were bound by both p63 and p53 in KCs, three (hoxc4, prpf8 and sufu) were bound only by p63 and two (neil2 and pcnxl2) only by p53. The other loci tested were negative. In summary, the majority (68%) of the locations were bound by p63 in primary cells. Importantly, p63-specifc genes emerged, suggesting that our new targets provide additional information on the network of genes regulated; the finding that half of these loci are also bound by p53, in the absence of any ‘activating' stimuli, such as DNA-damage or cellular stress, confirms that both proteins regulate common sets of genes.
Figure 4.
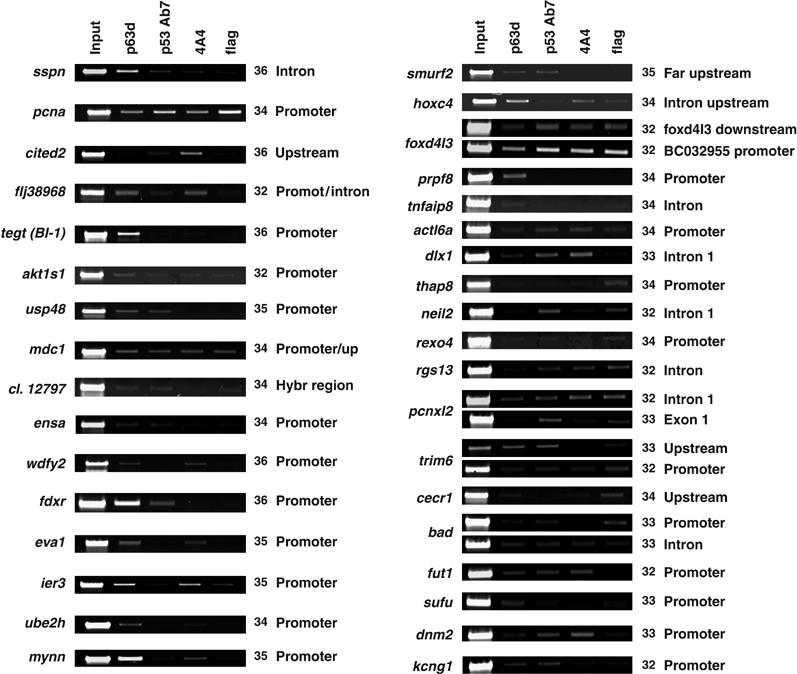
Validation of targets in human primary KCs. ChIP from human primary KCs performed with α-p63 (lane 2), α-p53 (lane 3), α-p63 monoclonal 4A4 (lane 4) and control α-Flag (lane 5) antibodies. The same layout of Figure 2 was maintained, with the strong positive loci observed in HaCaT cells on the left side, and the weak ones on the right. The position of the primers and PCR cycles are indicated.
Transcriptional activation of promoters
As DNA binding does not necessarily result in transcriptional activation (Beima et al, 2006), we tested the transcriptional activity of different p63 isoforms on five targeted promoters: ensa, eva1, kcng1, pcna and tegt/BI-1. Figure 5 shows the results of the transactivation assays in Cos-1 cells, and comparison with the bona fide target promoter mdm2 (Ghioni et al, 2002). The TAp63γ isoform activated all promoters, albeit at different levels, ranging from 17-fold on eva1 to the modest three-fold on ensa. TAp63β, ΔNp63β and γ also activated, at different extents, all promoters. TAp63α did show activation on eva1 (nine-fold) and kcng1 (3.5-fold), was modestly active on tegt/BI-1 and pcna (1.8-fold), whereas neutral on mdm2 and ensa. ΔNp63α activated eva1 (9-fold) and kcng1 (5-fold), was modestly active on the ensa (2-fold) and tegt/BI-1 (3-fold) and hardly active on pcna and mdm2 promoters. Note that previous such experiments on the fdxr promoter revealed similar TAp63α activation and ΔNp63α repression (Liu and Chen, 2002). Taken together, these data suggest that the promoters of the genes identified by ChIP on chip can be directly—and differentially—regulated by p63 isoforms.
Figure 5.
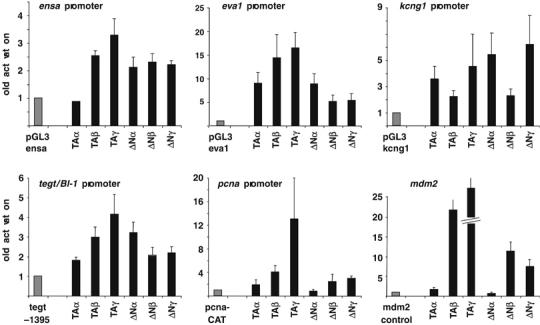
Transactivation assay in Cos-1 cells. Transcriptional activity of the different p63 isoforms cotransfected in Cos-1 cells with the human ensa, eva1, kcng1 (top panels), the rat tegt/BI-1, the human pcna promoters and the mdm2 control reporter (bottom panels). Cells were transfected with 1 μg of reporter plasmids and 0.5 (ensa and eva1 panels) or 1 μg (kcng1, tegt/BI-1, pcna and mdm2 panels) of p63 expression plasmids. Bars represent the luciferase (ensa, eva1, kcng1 and tegt/BI-1 promoters) or CAT (pcna promoter and mdm2 reporter) activity of transfected cell extracts (mean±s.e.m. of at least three independent experiments, each performed in duplicate), expressed as fold-activation over the activity of the promoter-only construct, artificially set at 1. Values were normalized by cotransfection of 100 ng of a pCMV-β-gal plasmid as an internal standard.
Expression of targets in differentiating HaCaT cells
HaCaT cells can be induced to differentiate and express markers of suprabasal KCs. To verify whether the genes bound by ΔNp63α are subject to regulation under these conditions, we analyzed their mRNA levels during differentiation of HaCaT cells in the presence of Ca2+. This treatment causes a modest decrease of the ΔNp63α protein and a weak increase of the much less abundant ΔNβ and γ isoforms, as shown in Supplementary Figure 3D. We performed RT–PCR analysis on 33 genes (Figure 6); NF-YB was used as internal control, because we observed that the levels of β-actin, often used as internal control, were significantly decreased by this treatment (not shown). The only gene that was not affected was TEGT/BI-1; all other genes varied in expression following the addition of Ca2+. In particular, SSPN, CITED2, FLJ38968, USP48, EVA1, UBE2H, HOXC4, FOXD4L3, RGS13, PCNXL2, and DNM2 were strongly induced. PCNA, MDC1, SMURF2 and REXO4 were repressed. ENSA and IER3 were transiently repressed at 3 h, whereas ACTL6A, DLX1 and KCNG1 were transiently induced. In bidirectional promoters, complex behaviors emerged. In some cases, only one gene varies: TBC1D17 is strongly induced whereas AKT1S1 does not change; SUFU is increased, ACTR1A does not change. In others, both mRNAs change in the same direction: WDFY2/AK05683 and FUT1/FGF21 are induced, FGF21 only transiently. Other genes displayed opposite behaviors: THAP8 is induced and WDR62 is repressed; BAD transiently repressed, whereas C11ORF4 is transiently induced. Overall, these data indicate that the identified targets are regulated during keratinocyte differentiation.
Figure 6.
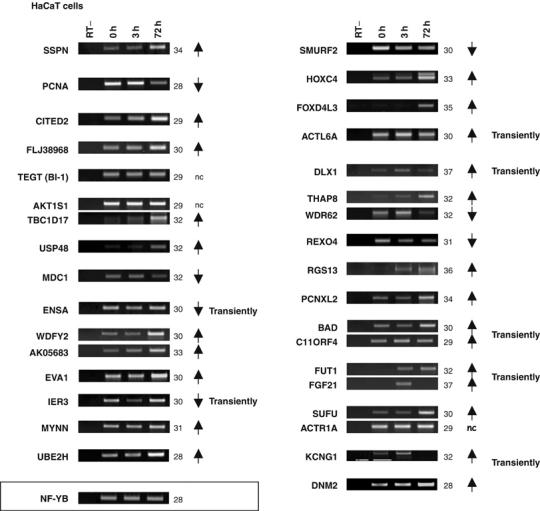
Expression analysis in HaCaT cells. RT–PCR of the target genes, displayed in the same order as in Figures 2 and 4, with RNA extracted from HaCaT cells, treated with 1.4 mM CaCl2 for the indicated times: 0 h (lane2), 3 h (lane3) and 72 h (lane 4). Lane 1 represents the control with RNA (0 h) without reverse transcriptase (RT−). For each gene, the PCR cycles are indicated; arrows indicate the direction of change; NC, no change. Genes belonging to the same locus are grouped together. The cDNAs were normalized to NF-YB expression.
Regulation of targets by Np63α
To further address the role of ΔNp63α in the regulation of the targets, we overexpressed ΔNp63α in the p63− U2OS cells and analyzed their endogenous mRNA levels by semiquantitative RT–PCR. Figure 7 shows that most of the targets are induced, with variable kinetics, with the exception of SMURF2, which is repressed after 30 h of ΔNp63α overexpression. Ten of the 30 genes tested do not significantly change and EVA1 is not expressed at all. In summary, the majority of the endogenous genes are indeed regulated at the transcription level by ΔNp63α.
Figure 7.
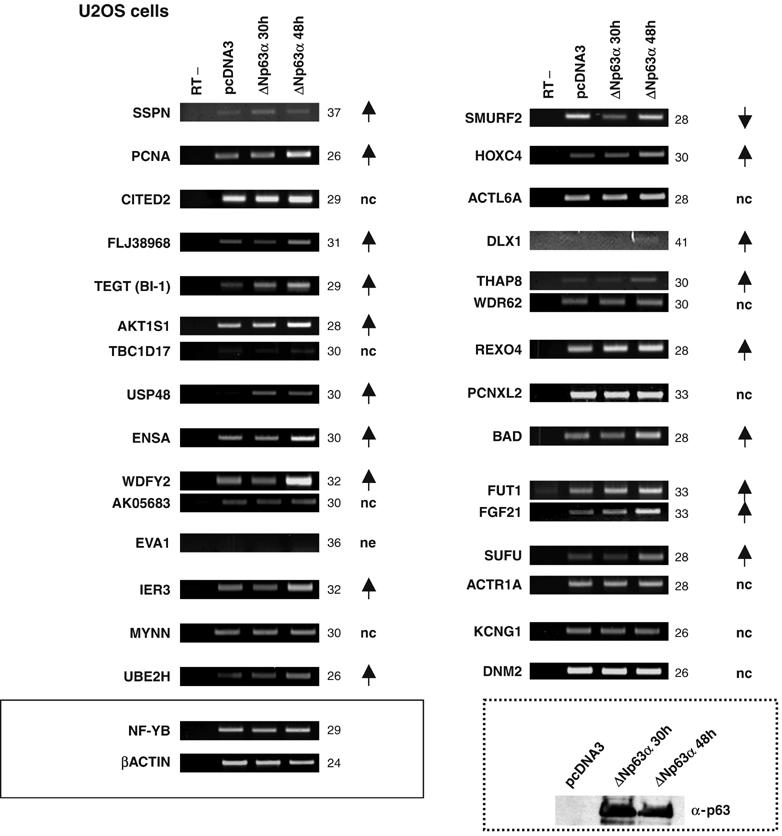
Expression of targets in U2OS cells. RT–PCR analysis of the target genes as in Figure 6, with RNA extracted from U2OS cells transiently transfected with 5 μg of ΔNp63α expression plasmid for the indicated times: 30 h (lane 3) and 48 h (lane 4). Lane 1 represents the control without reverse transcriptase (RT−) and lane 2 represents cells transfected with an empty expression plasmid (pcDNA3). The numbers and arrows are the same as in Figure 6. The normalization of the cDNAs was performed with both NF-YB and β-actin genes. The dashed box shows a Western blot with nuclear extracts from the transfected cells, probed with α-p63.
Expression of targets in normal tissues
We analyzed the expression of some of the targets in the skin tissue, performing p63 double immunofluorescence with SSPN, CITED2, ENSA, DNM2 and RGS13 antibodies, both in human adult skin sections (from thigh) and in 19.5-day-old mouse embryos. The choice of the tested targets was dictated by the availability of suitable antibodies. As shown in Figure 8, p63 is detected in the basal and suprabasal layers of human skin by both antibodies used. CITED2 displayed nuclear staining in most layers, especially in the subcorneum, where p63 is not expressed. In mouse embryonic skin, CITED2 expression is similar; note that stratification is less extended and p63 is definitely more basal and suprabasal. In mouse embryos, p63 is also well expressed in the nuclei of the hair follicles, where few cells are positive for CITED2. ENSA has a diffuse cytoplasmic staining in all layers of human skin and concentrates in nuclear/perinuclear locations in the external layers. The pattern is very similar in mouse skin. Both in human and mouse, DNM2 is cytoplasmic in all layers, although in the mouse the staining is more intense in the basal and suprabasal layers and, apparently, it accumulates in the subcorneum. A similar strong staining of the subcorneum is observed for SSPN in human sections, whereas in the mouse the staining is less evident, probably due to the low performance of the antibody. For RGS13, we did not observe differential staining in human skin and, if anything, it appears more expressed in the cytoplasm of the fibroblasts of the underlying derma. These data show that these targets are expressed in the skin, and most of them display differential expression, indeed suggesting their involvement in the developmental pathways regulated by p63.
Figure 8.
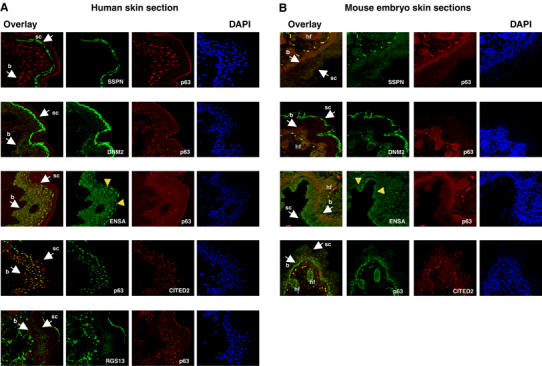
Immunostaining of human and mouse skin sections. Confocal images of adult human skin (A) and mouse 19.5-day-old embryo skin sections (B), immunostained with the indicated primary antibodies. For each target, costaining with p63, nuclear staining with DAPI and the merge (overlay) of the two images are indicated. b: basal layer; sc: subcorneum layer; hf: hair follicles (mouse only). Yellow arrowheads in the ENSA panels indicate the perinuclear accumulation of the protein in the external layers.
Discussion
p63 is a developmentally regulated TF that governs the differentiation process of the multilayered epithelia (Mills et al, 1999; Yang et al, 1999; Koster and Roop, 2004; Koster et al, 2004). Furthermore, p63 is responsible for the pathogenesis of the AEC, EEC and SHFM human syndromes, with a clear genotypic–phenotypic correlation (Brunner et al, 2002). To understand the developmental program sustained by p63 and the role of the dominant-negative mutations in patients, the identification of the transcriptional targets is necessary. We performed ChIP on chip in the HaCaT cell line, which predominantly expresses ΔNp63α and partially mimics basal KCs, and identified 183 new genes. The validation experiments (Figure 2) confirmed that 88% are effectively bound in vivo by ΔNp63α, proving the robustness of our approach. The different degrees of enrichment observed could be explained in different ways. (i) The selection of the region to be amplified might not be optimal, even if for some of the loci we scanned several subregions, and we were unable to precisely locate the in vivo binding site. (ii) The different in vivo affinity of p63 for specific targets. As ChIP experiments represent average binding within a cell population, which is heterogeneous with respect to cell-cycle phases and chromatin structures, enrichments can vary remarkably. (iii) Indirect binding of p63 to DNA, mediated by other DNA-binding proteins, may result in less enriched ChIPs. The screening was nevertheless very powerful, as we could identify low-affinity loci. Interestingly, we identified nine genomic loci devoid of annotated genes, mRNA or ESTs. It will be interesting to search for the presence of microRNAs, for example, in order to understand the role of p63 binding in these regions.
p63 targets
Several functional assays indicated that the genes were indeed direct functional targets. First the in vivo binding of p63 in human primary KCs: 68%(24/35) of the loci tested were bound. This number is significant and it likely reflects the similarity between HaCaT and KCs. The 11 negative loci could reflect different stages of skin development, because p63 might regulate different sets of genes depending on the differentiation status. Additionally, the p53 status is different, because HaCaT cells posses two mutant alleles—at positions 179 and 282—commonly found in human tumors (Lehman et al, 1993). Such mutated p53 have an increased affinity for p63 (Gaiddon et al, 2001), leading to the formation of heterotetramers that could bind different loci in HaCaT cells. We tested p53 binding to our targets in KCs and found an overlap for 14 targets (Figure 4). This is not surprising, as the consensus site for these two proteins is very similar (Osada et al, 2005) and many previously documented p63 targets were identified by similarity with p53 targets (Barbieri et al, 2005; Ellisen et al, 2002; Ihrie et al, 2005). Finally, there is experimental evidence for coregulation of the same genes by both proteins, often in opposing direction (Senoo et al, 2002; King et al, 2003). Interestingly, 11 loci were specific for p63 (Figure 4), suggesting that these may play a role in the developmental program of multilayered epithelia. Specifically, EVA1 is an epithelial marker; HOXC4 is a developmentally important gene implicated in the differentiation of the skin (Rieger et al, 1994; Stelnicki et al, 1998); SUFU is an intracellular component of the hedgehog pathway (Hooper and Scott, 2005) and it has recently been shown that sufu+/− mice present skin defects (Svard et al, 2006).
As a second functional assay, we analyzed targets expression levels in HaCaT cells induced to differentiate (Figure 6). We reasoned that the expression of genes involved in differentiation would alter during this process. Indeed, with one exception, the 33 genes tested were regulated, supporting a developmental role. The direct regulation of these genes by ΔNp63α was addressed by analyzing their endogenous mRNA levels in ΔNp63α overexpression conditions (Figure 7). Most of these genes were induced, confirming the direct positive role of ΔNp63α. Initially considered exclusively as a dominant negative of p53 activity, this isoform was later found to activate some genes, despite the lack of the N-terminal TA activation domain (King et al, 2003), a notion confirmed by evaluation of signalling pathways during ectodermal organogenesis (Laurikkala et al, 2006) and a large set of genes involved in adhesion and cell survival in mammary cells (Carroll et al, 2006). Given the different cellular environments of U2OS versus HaCaT cells, it was not surprising that ΔNp63α, when overexpressed, was unable to regulate 30% of our targets. The lack of tissue-specific coactivators or corepressors in this particular cell line might explain these results. Additionally, recent reports showed that binding of a TF to regulatory regions of a gene does not necessarily translate into direct regulation of that gene (Beima et al, 2006).
An involvement of some of the targets in development of the epidermis is suggested by the immunofluorescence experiments on both human and mouse skin sections. Both SSPN and DNM2 present a stronger staining in the subcorneum layer of the skin, suggesting a role in the formation of a thick membrane barrier in the last cellular layer. SSPN is a component of the dystrophin–glycoprotein complex (DGC), mainly expressed in muscles, where it provides a structural link between the extracellular matrix and the actin cytoskeleton (Crosbie et al, 2000). Despite the role of the DGC in muscular physiology, SSPN KO mice were shown to have normal muscle development, suggesting that this protein might have additional functions (Lebakken et al, 2000). Indeed, SSPN was recently reported to be expressed in the mouse retina (Fort et al, 2005). DNM2 is ubiquitously expressed and involved in basal cellular processes such as endocytosis, membrane trafficking, actin assembly and centrosome cohesion (Praefcke and McMahon, 2004; Bhattacharya et al, 2005). ENSA is an endogenous regulator of β-cells KATP channels and was shown to stimulate insulin secretion from β-cells (Heron et al, 1998). It has also been implicated in the function of mesangial cells (Yee et al, 2004) and the brain (Dou et al, 2003). Its expression is regulated in the skin, with a clear perinuclear accumulation in the external layers (Figure 8). CITED2 is a transcriptional coregulator, involved in the modulation of HIF-1a (Bhattacharya et al, 1999) and TFAP2 (Braganca et al, 2003) activity. It is also essential for cardiac and neural development, as KO mice are embryonic lethal, displaying severe cardiac malformation, adrenal agenesis and neural crest defects (Bamforth et al, 2001). Its distinct nuclear expression pattern in the skin suggests a different transcriptional role in the various layers, as both HIF-1a and TFAP2 are important for skin development (Vihanto et al, 2005; Koster et al, 2006; Wang et al, 2006).
Functional mining of targets
Functional analysis of the targets identified here highlighted novel categories of genes regulated by p63. The statistical test underlined two classes of terms: transcriptional regulation and RNA metabolism or structure (Figure 3B). As ΔNp63α is a master TF, it is not surprising that many of its targets are themselves TFs or coregulators. A transcriptional cascade, in fact, would be the basic event in activation of the developmental program regulated by p63. The control of global translational volume, highlighted by the enrichment in genes of the RNA metabolism/structure categories, is an important regulator of cell proliferation and, consequently, cancer progression, both processes regulated by p63 (Barbieri et al, 2006). The manual classification allowed us to uncover some new aspects of p63 regulation (Figure 3A). As expected from genes important for developmental and differentiation processes, the more represented classes of genes were cell adhesion/cytoskeleton, cell proliferation/cell cycle and TFs. Indeed, the few known p63 targets mostly belong to these classes (Flores et al, 2002; Westfall et al, 2003; Kurata et al, 2004; Barbieri et al, 2005; Ihrie et al, 2005; Sasaki et al, 2005). A clear involvement of p63 in the adhesion program of mammary epithelial cells was very recently demonstrated (Carroll et al, 2006). We identified 27 additional targets involved in cell adhesion/cytoskeleton, with only one—eva1—common with the above-mentioned study. Twenty-three genes are related to cell cycle/proliferation (Supplementary Tables 2 and 3), in line with another recent report listing several genes—none of which identified here—involved in cell migration and cancer invasion (Barbieri et al, 2006). Likewise, the most represented systemic processes of our list were development/morphogenesis and cancer. The unexpected functional representation was immunity and vascular processes. It will be interesting to further investigate the role of p63 in such fields, as p63 is also expressed in the immune system (Yang et al, 1998).
We also found several novel—and surprising—categories, worth a deeper investigation. (i) Eight genes carrying the WD40 domain—WDR62, WDR52, RAE1, PWP1, WDR18, WDFY2, WDR76, AHI1—revealing WD40 proteins as significantly enriched within the set (with P-value=1E-5). The WD40 domain is generally involved in signal transduction, pre-mRNA processing and cytoskeleton assembly (Li and Roberts, 2001). It is also a domain involved in protein–protein interactions at large, and it would be very interesting to study possible functional interactions between this class of proteins and p63. (ii) Six genes acting as MAPK modulators (DUSP4, PROC, MAP3K13, ANP32A, FGF21, BDNF). Many growth factors promote signalling pathways leading to MAPK activation, especially downstream of EGFR, one of the major player in epithelial differentiation; thus, p63 role in cell proliferation and cancer may be exerted also by modulating expression of some MAPK cascade regulators. (iii) Eight genes belonging to the ubiquitin-dependent protein processing pathways (ATG7, SMURF2, USP48, RNF157, PARK2, TRIM6, UBE2H and USP9X). The ubiquitin-dependent regulation of p53 has been widely documented, and similar mechanisms converge on other members of the family (Maisse et al, 2003). By analogy with p53/MDM2 feedback regulatory loop (reviewed by Brooks and Gu, 2006), it is tempting to speculate that many of these new targets are themselves regulators of p63 activity. The structural features of protein–protein interactors of both WD40 containing proteins, MAP kinases and ubiquitin processing regulators would definitively support such a hypothesis. Finally, our identification of NOTCH1 is in excellent agreement with (i) the genetic findings that it acts downstream of p63 in the differentiating ectoderm (Laurikkala et al, 2006) as part of a complex cross-talk with p63 in KCs differentiation (Nguyen et al, 2006) and (ii) the presence of the JAG1/2 ligands and NOTCH3 among the targets in p63 overexpressions (Wu et al, 2003; Osada et al, 2005). In summary, we generated a list of high confidence target genes for ΔNp63α, which uncovers new biological functions and will provide new fields of investigation in understanding the molecular mechanisms of this complex TF.
Materials and methods
Cell cultures and transfections
HaCaT, Cos-1 and U2OS cells were maintained in DMEM supplemented with 10% FCS. Transfections of Cos-1 cells were carried out with Lipofectamine (Invitrogen) in a 12-well plate with 2 μg of total DNA. For U2OS cells, 5 μg of ΔNp63α were used for a 100-mm plate. The p63-expressing and mdm2-CAT plasmids were described in Ghioni et al (2002). The human ensa promoter (from −733 to +141), the eva1 promoter (from −738 to +198) and the kcng1 promoter (from −713 to +223) were PCR generated from genomic DNA and cloned into Nhe1/Bgl2 sites of pGL3basic. The −1395tegt/BI-1-Luc rat promoter was kindly supplied by Dr Joyce-Brady (Boston, USA) and the −1265-PCNA-CAT was from Dr Morris (Tulane, USA).
For in vitro differentiation assays, HaCaT cells were grown in 0.1% FCS and CaCl2 was added to a final concentration of 1.4 mM. Cells were harvested at 0, 3 and 72 h after calcium induction. First passage primary human KCs were derived from thigh skin biopsies of healthy individuals and grown on a feeder-layer of lethally irradiated 3T3 cells, as described in Pellegrini et al (2001).
RNA extraction and RT–PCR analysis
Total RNA was extracted using the RNeasy kit (Qiagen) according to the manufacturer's instructions. For RT–PCR analysis, 1 or 2 μg of RNA were reverse-transcribed using SuperscriptII (Invitrogen) and cDNAs were normalized to NF-YB or β-actin levels. The list of the primers used is shown in Supplementary Table 1.
ChIP assay
The procedure for ChIP was essentially as described previously (Testa et al, 2005) with minor modifications. Briefly, 5 × 10⁶ cell equivalents of chromatin (2–2.5 kb in size) were immunoprecipitated with 30 μg of anti-p63 or anti-Flag control (Sigma) antibodies. After reversal of formaldehyde crosslinking, RNase A and Proteinase K treatments, IP-enriched DNAs were used to generate amplicons for hybridization experiments. Independently generated ChIPs were used to perform validation by semiquantitative PCR. The ChIP-PCR primers used for these experiments are reported in Supplementary Table 1. Rabbit polyclonal anti-p63 antibodies were derived by purification of the corresponding sera on affinity columns containing purified recombinant protein linked to CnBr-Sepharose (Beretta et al, 2005).
Generation of ChIP probe amplicons
The generation of amplicons from the individual ChIPs was performed following the protocol of LM-PCR described (Oberley and Farnham, 2003; Testa et al, 2005). Briefly, two unidirectional linkers were annealed and ligated to the chromatin IPs, previously blunted by T4 DNA polymerase. The first amplicons were generated by PCR (15 cycles). The reaction was purified using the GFX PCR purification kit (Amersham Biosciences) according to the manufacturer's instructions. A fraction of these initial reactions was used to generate more amplicons for 30 additional cycles. After purification, the DNAs were quantified and examined by gene-specific PCRs, to ensure that the initial enrichment was maintained.
Labelling and hybridization of the 12K CpG island array
Five micrograms of amplicons for α-p63, α-Flag and input DNA (subjected to the same number of PCR cycles) were labelled using the LabelIT Cy5/Cy3 Nucleic acid labelling kit (Mirus), following the manufacturer's instructions, with a reagent to DNA ratio of 2.5 for Cy5 (IPs) and 1.5 for Cy3 (input). The hybridization and washing conditions for these slides were described previously (Testa et al, 2005). The CpG 12K slides were purchased from the University Health Network (Toronto, Canada). The hybridized microarrays were scanned and analyzed using a ScanArray 4000 and QuantArray analysis software (Packard). Features of poor intensity (<500) and those that did not meet the quality control criteria (visual inspection, spot circularity, spot uniformity and background uniformity for both channels) were discarded. After the background subtraction for each spot, the data were normalized to median, that is, the ratio of the median value of all spots in the Cy5 channel (IP DNA) was normalized to the ratio of the median value of the control Cy3 channel (input). From a direct comparison of the arrays hybridized with the p63 and Flag IPs, only the spots that showed enrichment >2-fold in the p63 samples were further analyzed. Three independent experiments were performed, normalized to the same input DNA, and the commonly enriched spots were considered.
Construction of promoter microarrays and probe labelling and hybridization
A description of the production of the promoter array and the labelling and hybridization conditions is given in Supplementary Materials and methods. Arrays were scanned using a GenePix 4000A scanner (Axon Instruments, Inc.) and fluorescence ratio measurements were determined with the GenePix Pro 4.0 software. Spots were considered for analysis if more than 70% of the pixels fluoresced with intensity above the median fluorescence intensity of the background plus two standard deviations. Only the first 1000 promoter sequences corresponding to enriched IP/control ratio were considered. Sequences showing enriched IP/control ratio in 3/4 slides (two replicates in dye-swap) were considered as p63-specific signals.
Immunostainings
Frozen human adult thigh skin sections were fixed in 4% paraformaldehyde, blocked (PBS with 1% BSA and 5% normal goat serum) and incubated with primary antibodies overnight at 4°C in a wet chamber. Fluorescein or rhodamine-conjugated secondary antibodies (Sigma) were incubated at room temperature for 2 h, and DAPI (Sigma) staining was performed before mounting. 19.5-days-old mouse embryos were fixed in paraformaldehyde, embedded in paraffin wax and cut. After deparaffination in Histolemon (Carlo Erba) and dehydration in ethanol and distilled water, antigen retrieval was performed by microwave treatment in citrate buffer for 15′. A list of the antibodies used is given in Supplementary Table 1. Confocal images were obtained with a Leica TCS SP2 AOBS microscope (Cimaina, University of Milan) with a × 40 objective and × 1–2 zoom.
Supplementary Material
Supplementary Figure 1
Supplementary Figure 2
Supplementary Figure 3
Supplementary Table 2
Supplementary Table 3
Supplementary Materials and Methods
Supplementary Legends
Supplementary Table 1
Acknowledgments
We thank M J-Brady and G Morris for plasmids; K Campbell, M McNiven and J Kehrl for antibodies, D Olivadoti for generating the α-p63 antibody, S Rodighiero, F Guizzardi and U Fascio for brilliant technical assistance at the confocal microscope, F Amiot, and P Maltere for help with promoter microarrays experiments. RM is supported by PRIN, FIRB, Telethon and Fondazione Cariplo. MAV is supported by a FIRB Giovani Ricercatori contract.
References
- Bamforth SD, Braganca J, Eloranta JJ, Murdoch JN, Marques FI, Kranc KR, Farza H, Henderson DJ, Hurst HC, Bhattacharya S (2001) Cardiac malformations, adrenal agenesis, neural crest defects and exencephaly in mice lacking Cited2, a new Tfap2 co-activator. Nat Genet 29: 469–474 [DOI] [PubMed] [Google Scholar]
- Barbieri CE, Perez CA, Johnson KN, Ely KA, Billheimer D, Pietenpol JA (2005) IGFBP-3 is a direct target of transcriptional regulation by DeltaNp63alpha in squamous epithelium. Cancer Res 65: 2314–2320 [DOI] [PubMed] [Google Scholar]
- Barbieri CE, Pietenpol JA (2006) p63 and epithelial biology. Exp Cell Res 312: 695–706 [DOI] [PubMed] [Google Scholar]
- Barbieri CE, Tang LJ, Brown KA, Pietenpol JA (2006) Loss of p63 leads to increased cell migration and up-regulation of genes involved in invasion and metastasis. Cancer Res 66: 7589–7597 [DOI] [PubMed] [Google Scholar]
- Beima KM, Miazgowicz MM, Lewis MD, Yan PS, Huang TH, Weinmann AS (2006) T-bet binding to newly identified target gene promoters is cell-type independent, but results in variable context-dependent functional effects. J Biol Chem 281: 11992–12000 [DOI] [PubMed] [Google Scholar]
- Beretta C, Chiarelli A, Testoni B, Mantovani R, Guerrini L (2005) Regulation of the cyclin-dependent kinase inhibitor p57Kip2 expression by p63. Cell cycle 4: 1625–1631 [DOI] [PubMed] [Google Scholar]
- Bhattacharya R, Kang-Decker N, Hughes DA, Mukherjee P, Shah V, McNiven MA, Mukhopadhyay D (2005) Regulatory role of dynamin-2 in VEGFR-2/KDR-mediated endothelial signaling. FASEB J 19: 1692–1694 [DOI] [PubMed] [Google Scholar]
- Bhattacharya S, Michels CL, Leung MK, Arany ZP, Kung AL, Livingston DM (1999) Functional role of p35srj, a novel p300/CBP binding protein, during transactivation by HIF-1. Genes Dev 13: 64–75 [DOI] [PMC free article] [PubMed] [Google Scholar]
- Blais A, Dynlacht BD (2005) Devising transcriptional regulatory networks operating during the cell cycle and differentiation using ChIP-on-chip. Chromosome Res 13: 275–288 [DOI] [PubMed] [Google Scholar]
- Braganca J, Eloranta JJ, Bamforth SD, Ibbitt JC, Hurst HC, Bhattacharya S (2003) Physical and functional interactions among AP-2 transcription factors, p300/CREB-binding protein, and CITED2. J Biol Chem 278: 16021–16029 [DOI] [PubMed] [Google Scholar]
- Brooks CL, Gu W (2006) p53 ubiquitination: Mdm2 and beyond. Mol Cell 21: 307–315 [DOI] [PMC free article] [PubMed] [Google Scholar]
- Brunner HG, Hamel BC, Bokhoven Hv H (2002) P63 gene mutations and human developmental syndromes. Am J Med Genet 112: 284–290 [DOI] [PubMed] [Google Scholar]
- Carroll DK, Carroll JS, Leong CO, Cheng F, Brown M, Mills AA, Brugge JS, Ellisen LW (2006) p63 regulates an adhesion programme and cell survival in epithelial cells. Nat Cell Biol 8: 551–561 [DOI] [PubMed] [Google Scholar]
- Crosbie RH, Lim LE, Moore SA, Hirano M, Hays AP, Maybaum SW, Collin H, Dovico SA, Stolle CA, Fardeau M, Tome FM, Campbell KP (2000) Molecular and genetic characterization of sarcospan: insights into sarcoglycan–sarcospan interactions. Hum Mol Genet 9: 2019–2027 [DOI] [PubMed] [Google Scholar]
- Dou J, Cui C, Dufour F, Alkon DL, Zhao WQ (2003) Gene expression of alpha-endosulfine in the rat brain: correlative changes with aging, learning and stress. J Neurochem 87: 1086–1100 [DOI] [PubMed] [Google Scholar]
- Ellisen LW, Ramsayer KD, Johannessen CM, Yang A, Beppu H, Minda K, Oliner JD, McKeon F, Haber DA (2002) REDD1, a developmentally regulated transcriptional target of p63 and p53, links p63 to regulation of reactive oxygen species. Mol Cell 10: 995–1005 [DOI] [PubMed] [Google Scholar]
- Flores ER, Tsai KY, Crowley D, Sengupta S, Yang A, McKeon F, Jacks T (2002) p63 and p73 are required for p53-dependent apoptosis in response to DNA damage. Nature 416: 560–564 [DOI] [PubMed] [Google Scholar]
- Fort P, Estrada FJ, Bordais A, Mornet D, Sahel JA, Picaud S, Vargas HR, Coral-Vazquez RM, Rendon A (2005) The sarcoglycan–sarcospan complex localization in mouse retina is independent from dystrophins. Neurosci Res 53: 25–33 [DOI] [PMC free article] [PubMed] [Google Scholar]
- Gaiddon C, Lokshin M, Ahn J, Zhang T, Prives C (2001) A subset of tumor-derived mutant forms of p53 down-regulate p63 and p73 through a direct interaction with the p53 core domain. Mol Cell Biol 21: 1874–1887 [DOI] [PMC free article] [PubMed] [Google Scholar]
- Ghioni P, Bolognese F, Duijf PH, Van Bokhoven H, Mantovani R, Guerrini L (2002) Complex transcriptional effects of p63 isoforms: identification of novel activation and repression domains. Mol Cell Biol 22: 8659–8668 [DOI] [PMC free article] [PubMed] [Google Scholar]
- Gressner O, Schilling T, Lorenz K, Schulze Schleithoff E, Koch A, Schulze-Bergkamen H, Maria Lena A, Candi E, Terrinoni A, Valeria Catani M, Oren M, Melino G, Krammer PH, Stremmel W, Muller M (2005) TAp63alpha induces apoptosis by activating signaling via death receptors and mitochondria. EMBO J 24: 2458–2471 [DOI] [PMC free article] [PubMed] [Google Scholar]
- Harms K, Nozell S, Chen X (2004) The common and distinct target genes of the p53 family transcription factors. Cell Mol Life Sci 61: 822–842 [DOI] [PMC free article] [PubMed] [Google Scholar]
- Heisler LE, Torti D, Boutros PC, Watson J, Chan C, Winegarden N, Takahashi M, Yau P, Huang TH, Farnham PJ, Jurisica I, Woodgett JR, Bremner R, Penn LZ, Der SD (2005) CpG Island microarray probe sequences derived from a physical library are representative of CpG Islands annotated on the human genome. Nucleic Acids Res 33: 2952–2961 [DOI] [PMC free article] [PubMed] [Google Scholar]
- Heron L, Virsolvy A, Peyrollier K, Gribble FM, Le Cam A, Ashcroft FM, Bataille D (1998) Human alpha-endosulfine, a possible regulator of sulfonylurea-sensitive KATP channel: molecular cloning, expression and biological properties. Proc Natl Acad Sci USA 95: 8387–8391 [DOI] [PMC free article] [PubMed] [Google Scholar]
- Hooper JE, Scott MP (2005) Communicating with Hedgehogs. Nat Rev Mol Cell Biol 6: 306–317 [DOI] [PubMed] [Google Scholar]
- Ihrie RA, Marques MR, Nguyen BT, Horner JS, Papazoglu C, Bronson RT, Mills AA, Attardi LD (2005) Perp is a p63-regulated gene essential for epithelial integrity. Cell 120: 843–856 [DOI] [PubMed] [Google Scholar]
- King KE, Ponnamperuma RM, Yamashita T, Tokino T, Lee LA, Young MF, Weinberg WC (2003) deltaNp63alpha functions as both a positive and a negative transcriptional regulator and blocks in vitro differentiation of murine keratinocytes. Oncogene 22: 3635–3644 [DOI] [PubMed] [Google Scholar]
- Kirmizis A, Farnham PJ (2004) Genomic approaches that aid in the identification of transcription factor target genes. Exp Biol Med (Maywood) 229: 705–721 [DOI] [PubMed] [Google Scholar]
- Koster MI, Kim S, Huang J, Williams T, Roop DR (2006) TAp63alpha induces AP-2gamma as an early event in epidermal morphogenesis. Dev Biol 289: 253–261 [DOI] [PubMed] [Google Scholar]
- Koster MI, Kim S, Mills AA, DeMayo FJ, Roop DR (2004) p63 is the molecular switch for initiation of an epithelial stratification program. Genes Dev 18: 126–131 [DOI] [PMC free article] [PubMed] [Google Scholar]
- Koster MI, Roop DR (2004) The role of p63 in development and differentiation of the epidermis. J Dermatol Sci 34: 3–9 [DOI] [PubMed] [Google Scholar]
- Kurata S, Okuyama T, Osada M, Watanabe T, Tomimori Y, Sato S, Iwai A, Tsuji T, Ikawa Y, Katoh I (2004) p51/p63 controls subunit alpha3 of the major epidermis integrin anchoring the stem cells to the niche. J Biol Chem 279: 50069–50077 [DOI] [PubMed] [Google Scholar]
- Laurikkala J, Mikkola ML, James M, Tummers M, Mills AA, Thesleff I (2006) p63 regulates multiple signalling pathways required for ectodermal organogenesis and differentiation. Development 133: 1553–1563 [DOI] [PubMed] [Google Scholar]
- Lebakken CS, Venzke DP, Hrstka RF, Consolino CM, Faulkner JA, Williamson RA, Campbell KP (2000) Sarcospan-deficient mice maintain normal muscle function. Mol Cell Biol 20: 1669–1677 [DOI] [PMC free article] [PubMed] [Google Scholar]
- Lee H, Kimelman D (2002) A dominant-negative form of p63 is required for epidermal proliferation in zebrafish. Dev Cell 2: 607–616 [DOI] [PubMed] [Google Scholar]
- Lehman TA, Modali R, Boukamp P, Stanek J, Bennett WP, Welsh JA, Metcalf RA, Stampfer MR, Fusenig N, Rogan EM, Harris CC (1993) p53 mutations in human immortalized epithelial cell lines. Carcinogenesis 14: 833–839 [DOI] [PubMed] [Google Scholar]
- Li D, Roberts R (2001) WD-repeat proteins: structure characteristics, biological function, and their involvement in human diseases. Cell Mol Life Sci 58: 2085–2097 [DOI] [PMC free article] [PubMed] [Google Scholar]
- Liu G, Chen X (2002) The ferredoxin reductase gene is regulated by the p53 family and sensitizes cells to oxidative stress-induced apoptosis. Oncogene 21: 7195–7204 [DOI] [PubMed] [Google Scholar]
- Maisse C, Guerrieri P, Melino G (2003) p73 and p63 protein stability: the way to regulate function? Biochem Pharmacol 66: 1555–1561 [DOI] [PubMed] [Google Scholar]
- Mills AA, Zheng B, Wang XJ, Vogel H, Roop DR, Bradley A (1999) p63 is a p53 homologue required for limb and epidermal morphogenesis. Nature 398: 708–713 [DOI] [PubMed] [Google Scholar]
- Nguyen BC, Lefort K, Mandinova A, Antonini D, Devgan V, Della Gatta G, Koster MI, Zhang Z, Wang J, di Vignano AT, Kitajewski J, Chiorino G, Roop DR, Missero C, Dotto GP (2006) Cross-regulation between Notch and p63 in keratinocyte commitment to differentiation. Genes Dev 20: 1028–1042 [DOI] [PMC free article] [PubMed] [Google Scholar]
- Oberley MJ, Farnham PJ (2003) Probing chromatin immunoprecipitates with CpG-island microarrays to identify genomic sites occupied by DNA-binding proteins. Methods Enzymol 371: 577–596 [DOI] [PubMed] [Google Scholar]
- Osada M, Park HL, Nagakawa Y, Begum S, Yamashita K, Wu G, Kim MS, Trink B, Sidransky D (2006) A novel response element confers p63- and p73-specific activation of the WNT4 promoter. Biochem Biophys Res Commun 339: 1120–1128 [DOI] [PubMed] [Google Scholar]
- Osada M, Park HL, Nagakawa Y, Yamashita K, Fomenkov A, Kim MS, Wu G, Nomoto S, Trink B, Sidransky D (2005) Differential recognition of response elements determines target gene specificity for p53 and p63. Mol Cell Biol 25: 6077–6089 [DOI] [PMC free article] [PubMed] [Google Scholar]
- Pellegrini G, Dellambra E, Golisano O, Martinelli E, Fantozzi I, Bondanza S, Ponzin D, McKeon F, De Luca M (2001) p63 identifies keratinocyte stem cells. Proc Natl Acad Sci USA 98: 3156–3161 [DOI] [PMC free article] [PubMed] [Google Scholar]
- Praefcke GJ, McMahon HT (2004) The dynamin superfamily: universal membrane tubulation and fission molecules? Nat Rev Mol Cell Biol 5: 133–147 [DOI] [PubMed] [Google Scholar]
- Rieger E, Bijl JJ, van Oostveen JW, Soyer HP, Oudejans CB, Jiwa NM, Walboomers JM, Meijer CJ (1994) Expression of the homeobox gene HOXC4 in keratinocytes of normal skin and epithelial skin tumors is correlated with differentiation. J Invest Dermatol 103: 341–346 [DOI] [PubMed] [Google Scholar]
- Sasaki Y, Ishida S, Morimoto I, Yamashita T, Kojima T, Kihara C, Tanaka T, Imai K, Nakamura Y, Tokino T (2002) The p53 family member genes are involved in the Notch signal pathway. J Biol Chem 277: 719–724 [DOI] [PubMed] [Google Scholar]
- Sasaki Y, Naishiro Y, Oshima Y, Imai K, Nakamura Y, Tokino T (2005) Identification of pigment epithelium-derived factor as a direct target of the p53 family member genes. Oncogene 24: 5131–5136 [DOI] [PubMed] [Google Scholar]
- Senoo M, Matsumura Y, Habu S (2002) TAp63gamma (p51A) and dNp63alpha (p73L), two major isoforms of the p63 gene, exert opposite effects on the vascular endothelial growth factor (VEGF) gene expression. Oncogene 21: 2455–2465 [DOI] [PubMed] [Google Scholar]
- Stelnicki EJ, Komuves LG, Kwong AO, Holmes D, Klein P, Rozenfeld S, Lawrence HJ, Adzick NS, Harrison M, Largman C (1998) HOX homeobox genes exhibit spatial and temporal changes in expression during human skin development. J Invest Dermatol 110: 110–115 [DOI] [PubMed] [Google Scholar]
- Svard J, Henricson KH, Persson-Lek M, Rozell B, Lauth M, Bergstrom A, Ericson J, Toftgard R, Teglund S (2006) Genetic elimination of suppressor of fused reveals an essential repressor function in the mammalian hedgehog signaling pathway. Dev Cell 10: 187–197 [DOI] [PubMed] [Google Scholar]
- Testa A, Donati G, Yan P, Romani F, Huang TH, Vigano MA, Mantovani R (2005) Chromatin immunoprecipitation (ChIP) on chip experiments uncover a widespread distribution of NF-Y binding CCAAT sites outside of core promoters. J Biol Chem 280: 13606–13615 [DOI] [PubMed] [Google Scholar]
- Vihanto MM, Plock J, Erni D, Frey BM, Frey FJ, Huynh-Do U (2005) Hypoxia up-regulates expression of Eph receptors and ephrins in mouse skin. FASEB J 19: 1689–1691 [DOI] [PubMed] [Google Scholar]
- Wang X, Bolotin D, Chu DH, Polak L, Williams T, Fuchs E (2006) AP-2alpha: a regulator of EGF receptor signaling and proliferation in skin epidermis. J Cell Biol 172: 409–421 [DOI] [PMC free article] [PubMed] [Google Scholar]
- Westfall MD, Mays DJ, Sniezek JC, Pietenpol JA (2003) The Delta Np63 alpha phosphoprotein binds the p21 and 14-3-3 sigma promoters in vivo and has transcriptional repressor activity that is reduced by Hay-Wells syndrome-derived mutations. Mol Cell Biol 23: 2264–2276 [DOI] [PMC free article] [PubMed] [Google Scholar]
- Wu G, Nomoto S, Hoque MO, Dracheva T, Osada M, Lee CC, Dong SM, Guo Z, Benoit N, Cohen Y, Rechthand P, Califano J, Moon CS, Ratovitski E, Jen J, Sidransky D, Trink B (2003) DeltaNp63alpha and TAp63alpha regulate transcription of genes with distinct biological functions in cancer and development. Cancer Res 63: 2351–2357 [PubMed] [Google Scholar]
- Yang A, Kaghad M, Wang Y, Gillett E, Fleming MD, Dotsch V, Andrews NC, Caput D, McKeon F (1998) p63, a p53 homolog at 3q27–29, encodes multiple products with transactivating, death-inducing, and dominant-negative activities. Mol Cell 2: 305–316 [DOI] [PubMed] [Google Scholar]
- Yang A, Schweitzer R, Sun D, Kaghad M, Walker N, Bronson RT, Tabin C, Sharpe A, Caput D, Crum C, McKeon F (1999) p63 is essential for regenerative proliferation in limb, craniofacial and epithelial development. Nature 398: 714–718 [DOI] [PubMed] [Google Scholar]
- Yee J, Cortes P, Barnes JL, Alviani R, Biederman JI, Szamosfalvi B (2004) Rat mesangial alpha-endosulfine. Kidney Int 65: 1731–1739 [DOI] [PubMed] [Google Scholar]
Associated Data
This section collects any data citations, data availability statements, or supplementary materials included in this article.
Supplementary Materials
Supplementary Figure 1
Supplementary Figure 2
Supplementary Figure 3
Supplementary Table 2
Supplementary Table 3
Supplementary Materials and Methods
Supplementary Legends
Supplementary Table 1