

Abstract
The dental follicle regulates the alveolar bone resorption needed for tooth eruption. In the rat first mandibular molar, a decrease in the expression of osteoprotegerin (OPG) in the dental follicle at day 3 enables the osteoclastogenesis needed for eruption to occur. Because colony-stimulating factor-1 (CSF-1) is maximally expressed in the dental follicle at day 3, it was hypothesized that CSF-1 down-regulates OPG gene expression in the dental follicle in vivo. To test this, we compared the expression of OPG in osteopetrotic toothless (tl/tl) rats deficient in CSF-1 with expression in their normal littermates for given ages. OPG gene expression was found to be higher in the dental follicle of the tl/tl mutants than in normals. Transfecting short interfering RNA specific for CSF-1 mRNA into dental follicle cells resulted in an up-regulation of OPG expression. Thus, these studies support our hypothesis that the down-regulation of OPG needed for tooth eruption is mediated by CSF-1.
Keywords: osteoprotegerin, tooth eruption, colony-stimulating factor-1, osteopetrotic rats, dental follicle
INTRODUCTION
One of the requirements for tooth eruption is alveolar bone resorption, such that the tooth can exit its bony crypt (e.g., see review by Wise et al., 2002a). For this resorption to occur, in the rat first mandibular molar there is a maximal influx of mononuclear cells into the dental follicle at day 3 post-natally, an influx that culminates with a maximal number of osteoclasts on the alveolar bone at this time (Wise and Fan, 1989; Cielinski et al., 1994). A secondary, minor burst of osteoclastogenesis also occurs around day 9 post-natally (Cielinski et al., 1994).
Osteoclastogenesis is promoted by the receptor activator of nuclear factor-kappa B ligand (RANKL) and colony-stimulating factor-1 (CSF-1). RANKL is a membrane-bound protein that binds to the receptor activator of nuclear factor-kappa (RANK) on osteoclast precursors (mononuclear cells) to stimulate their differentiation and fusion into osteoclasts (e.g., see Yasuda et al., 1998). CSF-1 can act on the osteoclast precursors to induce the expression of RANK (Arai et al., 1999). In contrast to the stimulatory effects of RANKL and CSF-1 on osteoclastogenesis, osteoprotegerin (OPG) is a secreted glycoprotein that inhibits osteoclastogenesis by acting as a decoy receptor for RANKL (e.g., see Simonet et al., 1997; Tsuda et al., 1997).
We have proposed that the major burst of osteoclastogenesis required for eruption occurs as the result of a decrease in osteoprotegerin (OPG) levels in the dental follicle at day 3 post-natally in the rat first molar (Wise et al., 2000, 2002b). Equally important, colony-stimulating factor-1 (CSF-1) is maximally expressed in the follicle at day 3 post-natally (Wise et al., 1995), and CSF-1 reduces gene expression of OPG in cultured dental follicle cells (Wise et al., 2000), as well as reduces the amount of OPG secreted (Wise et al., 2004). Thus, we have hypothesized that, in vivo, the increased expression of CSF-1 at day 3 reduces the expression of OPG such that osteoclastogenesis can occur.
One approach to testing the hypothesis that CSF-1 down-regulates OPG gene expression in vivo is to examine OPG gene expression in the dental follicle of the toothless (tl/tl) rat. The toothless rat is an osteopetrotic mutant in which the teeth do not erupt because of the scarcity of osteoclasts, despite the fact that the teeth develop normally (Cotton and Gaines, 1974). The molecular basis of this mutation is a loss-of-function frameshift mutation in the Csf1 gene (Van Wesenbeeck et al., 2002).
Given the above, the absence of a functional Csf1 gene, and the absence of CSF-1 protein, should result in a higher level of OPG in the dental follicle of the tl/tl mutant than in its age-matched littermate. If so, this would support our hypothesis that CSF-1 is responsible for down-regulating OPG gene expression to promote osteoclastogenesis. Thus, laser capture microdissection (LCM) techniques were used to dissect out the dental follicle in frozen sections of the first mandibular molars of tl/tl mutants and their age-matched normal littermates (+/+ or +/−). Reverse-transcription/polymerase chain-reaction (RT-PCR) studies were then conducted to evaluate OPG gene expression in the tl/tl vs. the normals.
In conjunction with this in vivo analysis, silencing of the CSF-1 gene in vitro in the dental follicle cells was undertaken by the use of a short interfering RNA (siRNA) specific for CSF-1 mRNA. We then analyzed these ‘knock-out’ cells to determine if down-regulation of CSF-1 gene expression in the follicle cells resulted in up-regulation of OPG gene expression.
MATERIALS & METHODS
Animals
The tl mutation (Csf1 mutation) is autosomal-recessive. Thus, in crosses between heterozygotes, 25% of the offspring are tl/tl mutants. Homozygous mutants (tl/tl) were identified by neonatal x-ray. Normal littermates of the (+/+) and (tl/+) genotypes are indistinguishable phenotypically, so the normal animals in these studies were (+/?). Animals were obtained from the inbred colony maintained under SPF conditions at the University of Massachusetts. All procedures involving animals were approved by the institutional IACUC.
Dental Follicle Isolation
The toothless rat pups and their normal littermates were killed at post-natal days 1, 3, 5, 7, 9, and 11, and mandibles were surgically removed and immediately frozen in liquid nitrogen and stored at −80°C. From 3 to 5 littermate pairs (mutant vs. normal) for each age from a total of 12 litters were used in the experiments.
The frozen mandibles were embedded in 6% carboxymethyl cellulose. Sections of 20-μm thickness were then cut and mounted onto RNase-free PEM membrane slides (P.A.L.M. Microlaser Technologies AG, Bernried, Germany). The slides were processed according to our previously established procedures (Yao et al., 2004).
With the PALM laser capture microdissection system (P.A.L.M. Microlaser Technologies AG, Bernried, Germany), the dental follicles of the first mandibular molars were marked in sections of the slides, cut by the laser beam, and captured into microtube caps. The samples were transferred from the caps into microtubes by centrifugation.
Short Interfering RNA (siRNA)
The siRNA (sense strand: 5′AACAUGCCUGAUCGAAUAUAA) targeting rat CSF-1 mRNA was designed based on the sequence of rat CSF-1 mRNA, with Deharmcon siRNA design software (Deharmcon, Inc., Lafayette, CO, USA). Concentration of the siRNA was measured at an absorbance of 260 nm.
Dental Follicle Cells and Transfection
Dental follicle cell cultures were established as described previously (Wise et al., 1992). Cells of passages 6 to 10 were used for the experiments. One day prior to transfection, cells were passed to new T-25 flasks (or plates with coverslips) with culture medium minus antibiotics. The siRNA was mixed with Lipofectamine 2000 and opti-MEM (Invitrogen Life Technologies, Carlsbad, CA, USA) to form siRNA-lipid complexes that were then added to the dental follicle cell cultures. For concentration studies, siRNA of 0, 20, 40, 60, 80, 100, 120, and 140 nM was tested by transfection for 48 hrs. In the time-course study, dental follicle cell cultures were transfected with a predetermined siRNA concentration of 80 nM for 24, 48, 72, and 96 hrs. After the designated time of transfection, the cells were collected into TRI REAGENT (Molecular Research Center, Cincinnati, OH, USA) for RNA extraction.
RNA Extraction
For laser capture microdissection samples, RNA was extracted with a PicoPure RNA extraction kit (Arcturus, Mountain View, CA, USA) according to the manufacturer's protocol, with modifications as previously published (Yao et al., 2004). The RNA samples were treated with DNase I to remove any possible contaminant DNA. We established RNA concentration by staining the samples with SYBR green II against a standard curve generated by staining RNA of known concentrations. For siRNA-transfected dental follicle cells, total RNA was isolated from the cells according to the TRI REAGENT protocol (Molecular Research Center, Cincinnati, OH, USA). The RNA concentration was measured by means of a spectrophotometer at A260, with A260/A280 greater than 1.9.
RT-PCR to Determine Gene Expression
For each RNA sample, either 1 or 2 μg RNA from siRNA-transfected dental follicle cells or 5 to 15 ng RNA from laser-captured dental follicle was reverse-transcribed into 20 μL cDNA, with oligo dT as primer. We examined CSF-1 gene expression by semi-quantitative PCR by mixing 2 μL of the cDNA, gene-specific primers, buffer, and Taq DNA polymerase in 25 μL vol, followed by 30 cycles of amplification. The PCR product was subjected to electrophoresis on an agarose gel. OPG gene expression in laser-captured dental follicle samples also was examined by semi-quantitative PCR.
For real-time PCR analysis of OPG gene expression, 3 μL of cDNA from laser-captured dental follicle or 2 μL of cDNA from the time-course study of CSF-1 siRNA transfection was mixed with 200 nM OPG gene-specific Taqman probe (sequence: 5′-FAM-ATTTTTCCCTCTGAAGATTTGATTCGAGTTGC-BHQ-3′), 400- to 600-nM forward primer (5′TTCTAGGCAAGTTGACCGTTAGC) and reverse primer (5′TACCCCTGCTTGTCTAGCCAA), and Taqman PCR mix (Applied Biosystems, Foster City, CA, USA), at a total reaction volume of 25 μL. cDNA was also mixed with 200 nM β-actin gene-specific Taqman probe, 200-600 nM of primers, and PCR mix in the same manner in each of the plates. The real-time PCR was carried out with an ABI 7900 or 7700 sequence detector. The CT value of each sample was acquired, and the relative gene expression was calculated by the Delta CT method, which was normalized to the endogenous control of β-actin.
Immunostaining
Dental follicle cell cultures were grown on coverslips to about 50% confluence, and then were transfected with 80 nM siRNA targeting CSF-1 for 48 hrs. Mock transfection of the cells was used as the control. After the designated time of transfection, the cells were fixed in cold methanol for 10 min, and immunostained for the detection of CSF-1 by the ABC staining procedures (Vector Laboratories, Inc., Burlingame, CA, USA). Briefly, the cells were incubated overnight with goat anti-human CSF-1 (Santa Cruz Biotechnology, Santa Cruz, CA, USA) at a concentration of 7 μg/mL PBS in the presence of BSA and normal blocking serum. Next, the cells were incubated with biotinylated anti-goat IgG, followed by incubation with avidin-biotinylated peroxidase. Staining controls included deletion of the primary antibody from the procedure.
RESULTS
RT-PCR results of LCM samples indicated that the Csf1 mutants (tl/tl) had a higher level of OPG gene expression in the dental follicle than did their normal age-matched littermates. This was true for all post-natal days tested except for day 5, in which the expression was similar (Fig. 1). Of particular interest was the fact that OPG expression in the Csf1 mutant was statistically higher at day 3 than its normal counterpart (Figs. 1A, 1B). Relative gene expression was acquired by the Taqman real-time RT-PCR for comparison of OPG expression in the dental follicle of normal vs. tl mutant rats. The results agreed with those from conventional RT-PCR (Fig. 1C).
Figure 1.
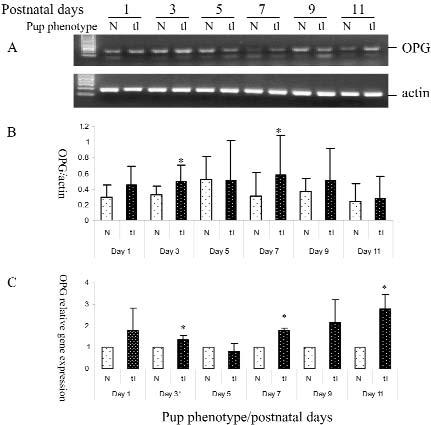
OPG gene expression in the dental follicle of the first mandibular molar, showing the comparison of normals (N) vs. tl/tl mutants at different post-natal days. Comparisons are within a given day, because pups at different days are not littermates. For a given day, 3-4 pairs of littermates were analyzed. (A) Agarose gel picture from electrophoresis of semi-quantitative RT-PCR. (B) OPG gene expression ratio from semi-quantitative RT-PCR as normalized to their actin controls. (C) Real-time PCR showing gene expression of the mutants relative to that of their littermate controls, which was set as 1. Note that at all days except day 5, OPG gene expression is higher in the tl/tl mutants, and that for days 3, 7, and 11, this expression is significantly different (*) from the controls at P ≤ 0.05 by Student's t test. Relative gene expression was calculated by the Delta CT method, which was normalized to the endogenous control of β-actin. Error bars in both B and C represent standard deviations (SDs).
As seen from the RT-PCR, CSF-1 expression was suppressed by siRNA, and suppression was significant at siRNA concentrations of 20 nM or higher. The maximum inhibition was seen at 80 nM, although higher concentrations showed reductions in CSF-1 gene expression (Fig. 2A). In terms of the effect of transfection duration, inhibition was seen at 24 hrs, with the maximum effect seen at 72 hrs of transfection (Fig. 2B), as compared with their mock controls. The suppression effect of CSF-1 can last up to 96 hrs (Fig. 2B). Suppressing CSF-1 mRNA, in turn, reduced the CSF-1 protein levels in the cells, as seen by immunostaining (Fig. 3).
Figure 2.
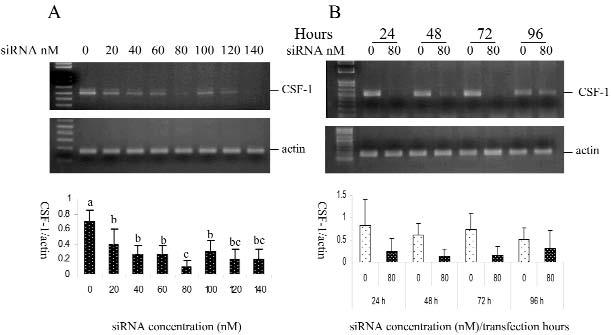
CSF-1 gene expression in dental follicle cells transfected with siRNA targeting CSF-1. Results in each panel are the mean of 3 separate experiments and were compared statistically by analysis of variance and separation of means, with least significant difference at P ≤ 0.05. (Panel A) siRNA concentration effect on reduction of gene expression of CSF-l after 48 hrs of transfection. Maximum inhibition of expression is seen with 80 nM CSF-1 siRNA. (Panel B) Time-course effect of siRNA on suppression of CSF-1 gene expression, showing suppression at all times, with maximal suppression at 72 hrs. Error bars in both panels represent SDs.
Figure 3.
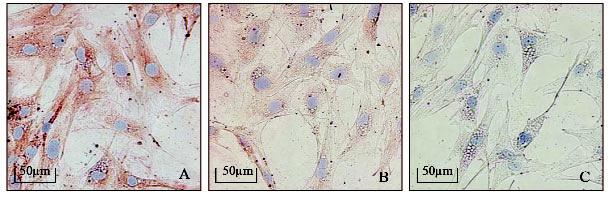
Immunostaining of CSF-1 in dental follicle cells after 48 hrs of transfection with 80 nM of siRNA targeting the CSF-1 gene. Note that CSF-1 staining was reduced after siRNA treatment (B) as compared with the control (A). Controls for immunostaining in which the primary antibody was omitted did not stain (C).
OPG expression was enhanced when the gene expression of CSF-1 was knocked down. Increased OPG gene expression was seen after 48 hrs of transfection, with a maximum increase of OPG seen after 72 hrs of transfection (Figs. 4A, 4B).
Figure 4.
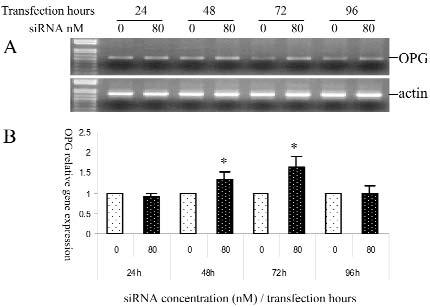
OPG expression in dental follicle cells transfected with CSF-1 targeting siRNA. Result in Panel B is the mean of 3 separate experiments. (Panel A) Semi-quantitative RT-PCR showing greater OPG expression after 48 and 72 hrs of transfection, in comparison with the controls at those times. (Panel B) Real-time RT-PCR results showing relative gene expression with controls (0 nM) set to 1 at each time point indicated. At both 48 and 72 hrs, the OPG gene expression is significantly increased (*) after transfection with 80 nM of CSF-1 siRNA (P ≤ 0.05), by Student's t test. Relative gene expression was calculated by the Delta CT method, which was normalized to the endogenous control of β-actin. Error bars represent SDs.
DISCUSSION
This study demonstrates that the gene expression of OPG in the dental follicle of the first mandibular molar of the homozygous mutant (tl/tl) rat is greater than that in its normal littermate (+/+ or +/−). The absence of a functional Csf1 gene in the tl/tl rats suggests that, indeed, CSF-1 in vivo normally acts to down-regulate OPG gene expression. This is supported by the fact that the time of maximal expression of CSF-1 in the dental follicle (day 3) is the time of maximal down-regulation of OPG in the dental follicle (Wise et al., 2000). Moreover, CSF-1 reduces OPG gene expression in vitro in cultured dental follicle cells (Wise et al., 2000), as well as reducing secretion of OPG by these cells (Wise et al., 2004).
Post-natal day 3 is the time of maximal osteoclastogenesis in the first mandibular molar of the rat (Wise and Fan, 1989; Cielinski et al., 1994). Thus, not only is the pro-osteoclastogenic factor, CSF-1, missing in the mutants, but also the inhibitor of osteoclastogenesis, OPG, remains elevated in its absence. This doubly ensures that the osteoclastogenesis needed for eruption will not occur.
The only age at which OPG expression in the tl/tl mutants did not appear to surpass that of their normal littermates was at day 5. A possible explanation for this is that at day 5, the expression of OPG sharply rebounds from its low at day 3 in the normal rat, and it is possible that its high level at this age eliminates any major difference between the normal and tl/tl rats. It is important to note that constitutive expression and secretion of OPG are the norm (except for day 3) in both the dental follicle (Wise et al., 2000) and in its derivative, the periodontal ligament (Sakata et al., 1999; Wada et al., 2001).
Although unlikely, another possible explanation for the lack of difference in OPG expression at day 5 could be that, by chance, the day 5 normals in each study were always heterozygotes (+/−) and never wild-type (+/+). Heterozygotes and wild-types are phenotypically indistinguishable, and obviously enough CSF-1 is made by the heterozygotes such that eruption times are normal. However, it is conceivable that the heterozygotes produce a lesser amount of CSF-1 than do the wild-types. This could be tested in the future by genotyping normal animals of the tl strain, something now made possible by the identification of the genetic lesion in the tl rat (Van Wesenbeeck et al., 2002).
Regardless of the day 5 anomaly, it is apparent that the absence of functional CSF-1 protein results in greater OPG gene expression at all other ages examined. Consequently, the increased density of bone and the resultant lack of marrow cavities seen in tl/tl rats (Seifert et al., 1993) could be due both to the lack of CSF-1 and to increased levels of OPG. This is consistent with the finding that transgenic mice that overexpress OPG become osteopetrotic, with increased bone density (Simonet et al., 1997).
The in vitro results based on the use of siRNA techniques to ‘knock-out’ CSF-1 gene expression corroborates the in vivo results—namely, down-regulation of CSF-1 expression in the dental follicle cells (Fig. 2) leads to up-regulation of OPG gene expression (Fig. 4). Conversely, incubation of dental follicle cells with CSF-1 down-regulates OPG gene expression (Wise et al., 2000) and protein secretion (Wise et al., 2004).
In conclusion, this study with tl/tl rats suggests that CSF-1 is required to reduce the OPG gene expression seen at day 3 in the dental follicle of the rat first mandibular molar. In vitro studies with siRNA support this conclusion. This reduction in OPG expression would enable the maximal osteoclastogenesis seen at day 3 to occur such that subsequent alveolar bone resorption and tooth eruption can occur.
ACKNOWLEDGMENTS
This work was supported by NIH grant DE08911-13 to G.E.W. The authors thank Ms. Cindy Daigle for processing the manuscript.
REFERENCES
- Arai F, Miyamoto T, Ohneda O, Inada T, Sudo T, Brasel K, et al. Commitment and differentiation of osteoclast precursor cells by the sequential expression of c-Fms and receptor activator of nuclear factor κB (RANK) receptors. J Exp Med. 1999;190:1741–1754. doi: 10.1084/jem.190.12.1741. [DOI] [PMC free article] [PubMed] [Google Scholar]
- Cielinski MJ, Jolie M, Wise GE, Ando DG, Marks SC., Jr . Colony-stimulating factor-1 (CSF-1) is a potent stimulator of tooth eruption in the rat. In: Davidovitch Z, editor. The biological mechanisms of tooth eruption, resorption and replacement by implants. EBSCO Media; Birmingham, AL: 1994. pp. 429–436. [Google Scholar]
- Cotton WR, Gaines JF. Unerupted dentition secondary to congenital osteopetrosis in the Osborne-Mendel rat. Proc Soc Exp Biol Med. 1974;146:554–561. doi: 10.3181/00379727-146-38146. [DOI] [PubMed] [Google Scholar]
- Sakata M, Shiba H, Komatsuzawa H, Fujita T, Ohta K, Sugai M, et al. Expression of osteoprotegerin (osteoclastogenesis inhibitory factor) in cultures of human dental mesenchymal cells and epithelial cells. J Bone Miner Res. 1999;14:1486–1492. doi: 10.1359/jbmr.1999.14.9.1486. [DOI] [PubMed] [Google Scholar]
- Seifert MF, Popoff SN, Jackson ME, MacKay CA, Cielinski M, Marks SC., Jr Experimental studies of osteopetrosis in laboratory animals. Clin Orthop. 1993;294:23–33. [PubMed] [Google Scholar]
- Simonet WS, Lacey DL, Dunstan CR, Kelley M, Chang MS, Lüthy R, et al. Osteoprotegerin: a novel secreted protein involved in the regulation of bone density. Cell. 1997;89:309–319. doi: 10.1016/s0092-8674(00)80209-3. [DOI] [PubMed] [Google Scholar]
- Tsuda E, Goto M, Mochizuki SI, Yano K, Kobayashi F, Morinaga T, et al. Isolation of a novel cytokine from human fibroblasts that specifically inhibits osteoclastogenesis. Biochem Biophys Res Commun. 1997;234:137–142. doi: 10.1006/bbrc.1997.6603. [DOI] [PubMed] [Google Scholar]
- Van Wesenbeeck L, Odgren PR, MacKay CA, D'Angelo M, Safadi FF, Popoff SN, et al. The osteopetrotic mutation toothless (t1) is a loss-of-function frameshift mutation in the rat Csf1 gene: evidence of a crucial role for CSF-1 in osteoclastogenesis and endochondral ossification. Proc Natl Acad Sci USA. 2002;99:14303–14308. doi: 10.1073/pnas.202332999. [DOI] [PMC free article] [PubMed] [Google Scholar]
- Wada N, Maeda H, Tanabe K, Tsuda E, Yano K, Nakamuta H, et al. Periodontal ligament cells secrete the factor that inhibits osteoclastic differentiation and function: the factor is osteoprotegerin/osteoclastogenesis inhibitory factor. J Periodontal Res. 2001;36:56–63. doi: 10.1034/j.1600-0765.2001.00604.x. [DOI] [PubMed] [Google Scholar]
- Wise GE, Fan W. Changes in the tartrate-resistant acid phosphatase cell population in dental follicles and bony crypts of rat molars during tooth eruption. J Dent Res. 1989;68:150–156. doi: 10.1177/00220345890680021001. [DOI] [PubMed] [Google Scholar]
- Wise GE, Lin F, Fan W. Culture and characterization of dental follicle cells from rat molars. Cell Tissue Res. 1992;267:483–492. doi: 10.1007/BF00319370. [DOI] [PubMed] [Google Scholar]
- Wise GE, Lin F, Zhao L. Transcription and translation of CSF-1 in the dental follicle. J Dent Res. 1995;74:1551–1557. doi: 10.1177/00220345950740090801. [DOI] [PubMed] [Google Scholar]
- Wise GE, Lumpkin SJ, Huang H, Zhang Q. Osteoprotegerin and osteoclast differentiation factor in tooth eruption. J Dent Res. 2000;79:1937–1942. doi: 10.1177/00220345000790120301. [DOI] [PubMed] [Google Scholar]
- Wise GE, Frazier-Bowers S, D'Souza RN. Cellular, molecular, and genetic determinants of tooth eruption. Crit Rev Oral Biol Med. 2002a;13:323–334. doi: 10.1177/154411130201300403. [DOI] [PubMed] [Google Scholar]
- Wise GE, Yao S, Zhang Q, Ren Y. Inhibition of osteoclastogenesis by the secretion of osteoprotegerin in vitro by rat dental follicle cells and its implications for tooth eruption. Arch Oral Biol. 2002b;47:247–254. doi: 10.1016/s0003-9969(01)00109-1. [DOI] [PubMed] [Google Scholar]
- Wise GE, Ding D, Yao S. Regulation of secretion of osteoprotegerin in rat dental follicle cells. Eur J Oral Sci. 2004;112:439–444. doi: 10.1111/j.1600-0722.2004.00156.x. [DOI] [PubMed] [Google Scholar]
- Yasuda H, Shima N, Nakagawa N, Yamaguchi K, Kinosaki M, Mochizuki SI, et al. Osteoclast differentiation factor is a ligand for osteoprotegerin/osteoclastogenesis-inhibitory factor and is identical to TRANCE/RANKL. Proc Natl Acad Sci USA. 1998;95:3597–3602. doi: 10.1073/pnas.95.7.3597. [DOI] [PMC free article] [PubMed] [Google Scholar]
- Yao S, Ring S, Henk WG, Wise GE. In vivo expression of RANKL in the rat dental follicle as determined by laser capture microdissection. Arch Oral Biol. 2004;49:451–456. doi: 10.1016/j.archoralbio.2004.01.009. [DOI] [PubMed] [Google Scholar]