Abstract
In Arabidopsis, the MADS-box protein encoded by FLOWERING LOCUS C (FLC) is a repressor of flowering. Vernalization, which promotes flowering in the late-flowering ecotypes and many late-flowering mutants, decreases the level of FLC transcript and protein in the plant. This vernalization-induced reduction in FLC transcript levels is mitotically stable and occurs in all tissues. FLC activity is restored in each generation, as is the requirement of a low-temperature exposure for the promotion of flowering. The level of FLC determines the extent of the vernalization response in the promotion of flowering, and there is a quantitative relationship between the duration of cold treatment and the extent of down-regulation of FLC activity. We conclude that FLC is the central regulator of the induction of flowering by vernalization. Other vernalization-responsive late-flowering mutants, which are disrupted in genes that encode regulators of FLC, are late-flowering as a consequence of their elevated levels of FLC.
Recently, we reported on a gene, FLOWERING LOCUS F (FLF), from Arabidopsis whose activity, as determined by steady-state mRNA levels, is correlated quantitatively with the period taken to initiate flowering (1). The FLF gene encodes a putative transcription factor of the MADS-box class, which, we concluded, acts as a repressor of floral induction. Genetic analyses of Arabidopsis ecotypes previously identified FLOWERING LOCUS C (FLC) as a semidominant repressor of floral induction (2–4). Because FLF has similar properties to FLC and maps to the same chromosomal region, the possibility arose that FLF and FLC are one and the same gene; this hypothesis has been confirmed by Michaels and Amasino (5). We suggest that the gene be referred to as FLC and the mutants flf-1 to flf-9 now be referred to as flc-11 to flc-19.
In many plant species, flowering is promoted by a period of exposure to low temperature through a process known as vernalization. A number of the late-flowering mutants and ecotypes of Arabidopsis have a vernalization response. We found that the vernalization-responsive late-flowering mutants had a higher level of FLC transcript than was present in the wild types and, importantly, that the non-vernalization-responsive late-flowering mutants did not have increased FLC transcript levels. The vernalization-responsive ecotype C24, which is somewhat late-flowering, also has a high level of FLC transcript that is reduced by the low-temperature treatment (1). These observations suggested to us that FLC must be directly involved in the vernalization response.
We have shown that reduction in the level of genomic methylation largely substitutes for the low-temperature treatment in promoting flowering (6–8), implicating a reduction in DNA methylation level as a component in the vernalization response. Early-flowering METHYLTRANSFERASE1 antisense plants, with a decreased level of genomic methylation, have a reduced level of FLC activity as compared with the nontransformed control (1). The correlation between FLC transcription and methylation levels implies that FLC is regulated by methylation status, but we are not able to say whether this is through an alteration of the methylation status of the FLC gene itself, or whether it involves other genes that regulate FLC expression.
In this paper, we demonstrate that the FLC gene is involved directly in controlling the response to vernalization and more generally in the timing of the transition to the reproductive phase of development. We find that a reduction in FLC activity is a key component of the vernalization response in six late-flowering vernalization-responsive mutants and in the C24 and Pitztal ecotypes. The late-flowering mutants are mutated in genes that regulate the activity of the FLC gene. We further show that the quantitative responses in the promotion of flowering to various periods of exposure to low temperature are paralleled by the levels of FLC transcript, and that the changes observed at the transcriptional level are reflected in the level of the FLC protein.
One of the key properties of vernalization, the resetting of the requirement for low-temperature induction in each generation, is mirrored in the resetting of FLC transcript levels.
Materials and Methods
Plant Material and Growth Conditions.
Arabidopsis seeds sown aseptically in Petri dishes containing a modified Murashige and Skoog medium (9) were cold-treated in the dark (at 5°C ± 1°C) for the stated period before growth under cool-white fluorescent lights with a 16-h photoperiod at 21°C to 23°C. Plates for flowering-time experiments contained 21 seeds, evenly spaced, in a 90-mm or 140-mm plate, whereas plates for RNA extraction contained ≈100–150 seeds per 90-mm plate. Unless indicated, seedlings were harvested for RNA or protein extraction at 14 days for 1-day cold-treated plates, or at a comparable developmental stage (5–6 rosette leaves visible) for plates that were cold-treated for longer periods. Flowering time was recorded as the number of rosette leaves when the floral bolt was 1 cm high.
Mutant seed stocks were obtained from the Arabidopsis Biological Resource Center (ABRC, Ohio State University, Columbus) or from C. Dean (John Innes Centre, Norwich, U.K.).
The Pitztal line used by Sheldon et al. (CS1454; ref. 1) and another Pitztal line (CS1456), both obtained from the ABRC, flower after ≈30 days, in contrast to the reported late-flowering of ≈100 days (10, 11). The line used in the experiments described in this paper is a late-flowering glabrous Pitztal line from our archive stocks, designated Pitztal-1 (Ptz-1).
The flc-13 mutant contains an Ac element in intron I (1), which excises in ≈1 in 20 plants to give a revertant late-flowering heterozygote. Such revertants were identified in flowering-time experiments by their much later flowering time (more than 20 leaves at flowering) and were excluded from the data presented.
Generation of FLC Antisense Transgenic Plants.
The 35S∷FLC antisense binary vector (1) was introduced into the fca-1 mutant by the floral-dip method (12). T1 plants were selected by using glufosinate ammonium (Basta; Riedel-deHaen, Germany), and individuals flowering considerably earlier than fca-1 control plants were identified. The flowering time of three lines was examined in the T2 generation.
RNA Extraction and RNA Gel Blot Analysis.
Total RNA was extracted from ≈0.5 g of tissue as described (13), or from smaller quantities of tissue by using the RNeasy Plant Mini Kit (Qiagen). RNA gel blot analysis was performed as described in ref. 1.
Reverse Transcription–PCR Amplification and Sequencing of FLC-Ler.
First-strand cDNA, generated from 5 μg of fca-1 [in Landsberg erecta (Ler)] total RNA by using Superscript II according to the manufacturer's instructions (GIBCO/BRL), was used as template in a PCR with primers 5′-CCGCTCGAGCTTAGTATCTCCGGCG-3′ and 5′-GGACTAGTCGCCCTTATCAGCGGA-3′, as described (1). The product was purified by using the QIAquick PCR purification kit (Qiagen) and sequenced with the two primers above and internal primers as described (1). The Wisconsin Package, Version 10.0 (Genetics Computer Group, Madison, WI), was used for sequence analysis.
Immunodetection of FLC Protein.
A rabbit polyclonal antibody was raised against a bacterially expressed histidine-tagged FLC protein lacking the first 80 N-terminal amino acids, which was purified by using Talon metal-affinity resin (CLONTECH). The apex and developing leaves of Arabidopsis seedlings were ground in liquid nitrogen and homogenized in extraction buffer (0.1 M sodium phosphate, pH 7.2/1 mM EDTA), and the insoluble material was pelleted by centrifugation. The supernatant was boiled immediately in one-third volume of 6× SDS sample buffer (0.5 M Tris, pH 6.8/10% SDS/0.6 M DTT/0.012% bromophenol blue) for 5 min before being separated on a denaturing 12% polyacrylamide gel and blotted onto Protran nitrocellulose (Schleicher & Schuell). Blots were amido black-stained (Sigma) and incubated with either preimmune serum diluted 1:1000 (vol/vol) or FLC polyclonal antibody serum diluted 1:3000 (vol/vol). The immunoreactive proteins were visualized by using the enhanced chemiluminescence Western blotting analysis system (Amersham), with the secondary antibody diluted 1:2000 (vol/vol), and by exposure to x-ray film (Fuji) for 1 to 10 min.
Results and Discussion
FLC Is Central to the Vernalization Response.
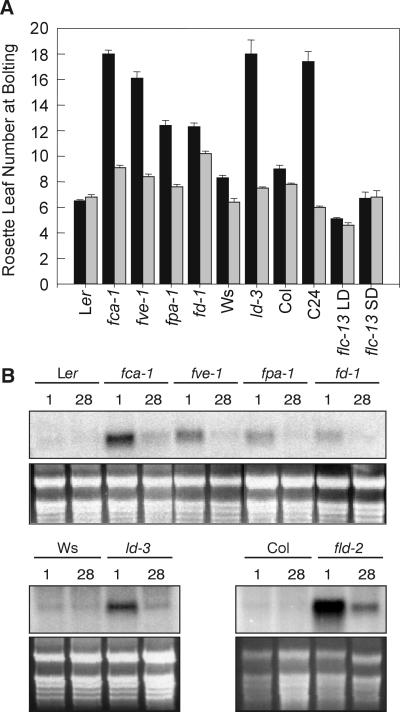
Ler is an early-flowering ecotype with little response to vernalization under long-day growth conditions. However, mutants at a number of loci (e.g., fca-1, fve-1, and fpa-1) in the Ler background are late-flowering and respond strongly to vernalization (ref. 14; Fig. 1A). This finding suggests that either the loci that are mutated in these mutants all independently control flowering time and independently confer an ability to respond to vernalization, or, more likely, that these loci act through a common target gene, which is responsible for the vernalization-responsive late-flowering phenotype. All three mutants have an increased level of FLC mRNA (ref. 1; Fig. 1B) relative to Ler, implicating FLC as the common target. This conclusion is supported by observations of late-flowering vernalization-responsive mutants in two other ecotypes, fld-2 in Columbia (Col) (15) and ld-3 in Wassilewskija-2 (Ws-2) (16). As with Ler, Col and Ws-2 display only a small vernalization response and have a low level of FLC transcript, whereas fld-2 and ld-3 have a higher level of FLC transcript (Fig. 1) and respond to vernalization with a decreased time to flower.
Figure 1.
Vernalization decreases both flowering time and FLC transcript level in vernalization-responsive late-flowering mutants. (A) Flowering time expressed as rosette leaf number for mutants and their corresponding wild types, fca-1, fve-1, fpa-1, and fd-1 in Ler; ld-3 in Ws-2; and flc-13 in C24, cold-treated for either 1 (black bars) or 28 (gray bars) days. The flc-13 mutant was grown under both a 16-h photoperiod (LD) and an 8-h photoperiod (SD). One-day cold-treated fld-2 plants remained vegetative throughout the experiment (terminated on day 90); fld-2 plants that had been cold-treated for 28 days flowered with an average of 14.7 ± 0.4 rosette leaves. These data are not included, but the data for the wild-type Col are. The error bars represent the SE. (B) FLC expression in seedlings of Ler, fca-1, fve-1, fpa-1, fd-1, Ws-2, ld-3, Col, and fld-2, cold-treated for either 1 or 28 days, as indicated above the figure. The ethidium bromide-stained ribosomal bands are shown below the blots as loading controls.
In the C24 ecotype, which has a high level of FLC transcript, the level of the transcript is reduced by vernalization (1), as is the time to flower. If the late-flowering phenotype of mutants of these five different genes is caused by the elevated level of FLC transcript, then we might expect that, after vernalization, each of the mutants would have substantially reduced levels of FLC transcript. This is the case (Fig. 1B). Thus, cold treatment is able to overcome the up-regulation of the FLC gene caused by mutations of these loci and to overcome the delay in flowering.
The late-flowering mutant fd-1 has been reported to lack a vernalization response (14). Under our growing conditions, however, it shows a modest decrease in flowering time in response to cold treatment (Fig. 1A), paralleled in the nonvernalized plant by a slightly elevated FLC transcript, which is reduced by the cold treatment (Fig. 1B). Other late-flowering mutants that do not respond to vernalization and that do not have elevated FLC levels (co, gi, fha, fe, ft, and fwa) (1) presumably contain lesions in the flowering pathway that are downstream of FLC, or the lesions may be in alternative flowering pathways, such as the photoperiod-responsive pathway.
In every ecotype or mutant that we have examined, there is a correlation between the level of FLC transcript and the response to vernalization. The ecotypes Ler, Col, and Ws-2, which have only slight vernalization responses under the conditions used, have a low level of FLC, even in the absence of vernalization (Fig. 1). The flc-13 mutant, which has an undetectable level of FLC transcript (1), has a minimal response to vernalization, in contrast to the strong vernalization response of the C24 wild type (Fig. 1A).
Our data indicate that in order for a plant to flower earlier in response to vernalization, FLC transcript in the nonvernalized plant is required, and that the magnitude of this response depends on the level of FLC transcript in the nonvernalized plant.
The fca-1 Mutant Is Late-Flowering Because of an Elevated Level of FLC.
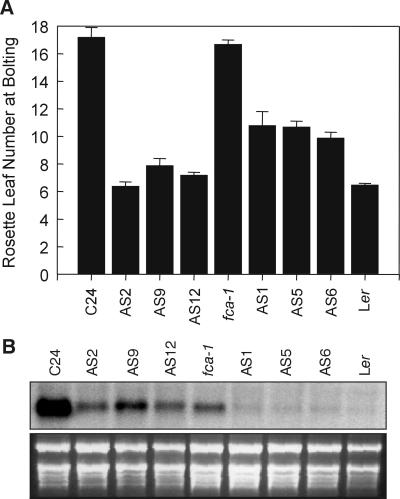
The correlation between high FLC transcript in the late-flowering nonvernalized mutants and low FLC transcript in the vernalized mutants that flower earlier (Fig. 1A) suggests that the cause of the late-flowering in the nonvernalized mutants is the elevated level of FLC. However, because the expression of other genes may also be altered by vernalization, we have tested whether a change in FLC activity is sufficient for the response. A construct containing an FLC antisense gene under the control of the cauliflower mosaic virus 35S promoter, which reduced FLC transcript levels and promoted flowering in T2 C24-transgenic lines (Fig. 2), was introduced into one of the mutants, fca-1. Fig. 2 shows the analysis of three T2 families, segregating for glufosinate ammonium (Basta) resistance, the selectable marker in the transgene construct. Resistant T2 plants from all three lines showed marked reductions in the levels of FLC transcript and flowered earlier than the nontransformed fca-1 mutant. The flowering time of the T2 plants was comparable to the flowering time of 28-day cold-treated fca-1 (Fig. 1A), indicating that much of the late-flowering phenotype of the fca-1 mutant can be overcome by reducing FLC transcript levels. When the same lines were sown in the absence of herbicide selection and scored for flowering time, the segregation was 3:1 for early flowering (as in Fig. 2A) and late flowering (equivalent to fca-1), indicating that the transgenic lines were in the fca-1 background. We conclude that a large proportion of the delay in flowering in the fca-1 mutant, and presumably in the other late-flowering vernalization-responsive mutants, is caused by their elevated level of FLC transcript.
Figure 2.
Reduction in FLC transcript level caused by a 35S∷FLC antisense construct results in early-flowering in C24 and in the fca-1 mutant. (A) Flowering time of untransformed C24 and three C24 T2 lines (AS2, AS9, and AS12) containing the 35S∷FLC antisense construct, and of untransformed fca-1, three fca-1 T2 lines (AS1, AS5, and AS6), and Ler, expressed as rosette leaf number. Error bars represent the SE. (B) FLC expression in bolting, early-flowering T2 segregants and from bolting C24, fca-1, and Ler plants. The ethidium bromide-stained ribosomal bands are shown below the blots as loading controls.
The Difference in Activities of FLC Alleles in Ecotypes Is Not Caused by Differences in Their Coding Sequences.
Genetic studies with ecotypes of Arabidopsis have led to the conclusion that C24 and Ler contain alleles of the FLC locus that suppress the late-flowering phenotype caused by dominant alleles of the FRIGIDA (FRI) locus, whereas Col contains an allele of FLC that does not suppress the late-flowering caused by dominant FRI alleles (2–4). The nucleotide sequence of the coding region of the C24 FLC locus is identical to the allele present in the Col ecotype (1). We have isolated the FLC cDNA from the Ler ecotype (by using the fca-1 mutant), and this allele has the same predicted amino acid sequence as the C24 and Col alleles. Clearly, the difference in FLC activity between ecotypes is not caused by changes in the coding sequence, because all three are identical. It is likely, therefore, that the FLC alleles in these ecotypes differ in some aspect of their regulation, perhaps as a result of sequence differences in the promoter region of the FLC gene. We have shown that a number of genes regulate FLC expression, and this regulation may depend on the allele of FLC present in any given line. For example, the expression of FLC in a Ler line containing the functional FRI allele from the San-Feliu-2 ecotype is markedly lower (1) than is FLC expression in the Ptz-1 ecotype, which also has a functional FRI allele (ref. 11; see Fig. 4 A and B), suggesting that the FLC-Ler allele may have a reduced capacity to be up-regulated. Similarly, the difference in the FLC expression levels between C24 and Ptz-1, both possessing functional FRI alleles (4, 11), may be because of their different FLC alleles. The low level of FLC expression in the Ler ecotype is likely to be because of a deletion in the FRI-Ler allele (17).
Figure 4.
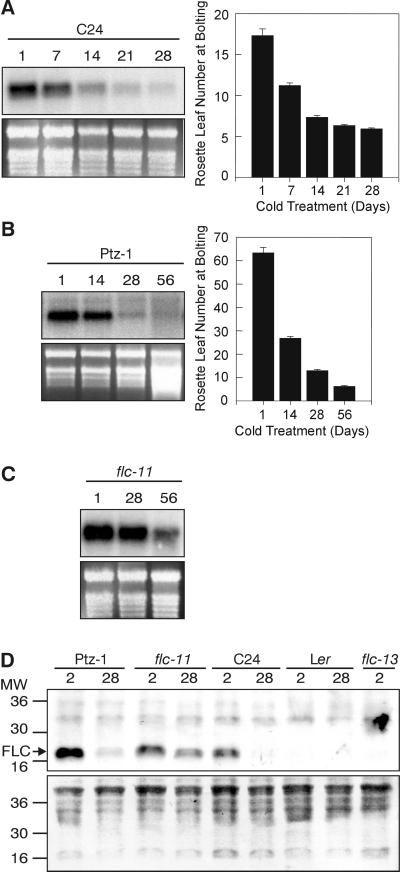
The down-regulation of FLC and the decrease in flowering time is proportional to the duration of the cold treatment. (A) FLC expression and flowering time, expressed as rosette leaf number, in C24 seedlings that were subjected to a cold pretreatment of 1, 7, 14, 21, or 28 days, as indicated, before growth at 21°C. Error bars represent the SE in A and B, and the ethidium bromide-stained ribosomal bands are shown as loading controls in A–C. (B) FLC expression and flowering time, expressed as rosette leaf number, in Ptz-1 seedlings that were subjected to a cold pretreatment of 1, 14, 28, or 56 days, as indicated, before growth at 21°C. (C) FLC expression in flc-11 seedlings that were subjected to a cold pretreatment of 1, 28, or 56 days, as indicated, before growth at 21°C. (D) FLC protein levels in the soluble fraction from Ptz-1, flc-11, C24, Ler, and flc-13 seedlings, cold-treated for either 2 or 28 days, as indicated. The amido black-stained filter is shown below as a loading control. The migration of the molecular weight markers (×1000) is shown to the left. A band detectable with the FLC antibody, but not with the preimmune serum, is indicated as FLC.
vrn1 and vrn2 Block the Vernalization-Induced Down-Regulation of FLC.
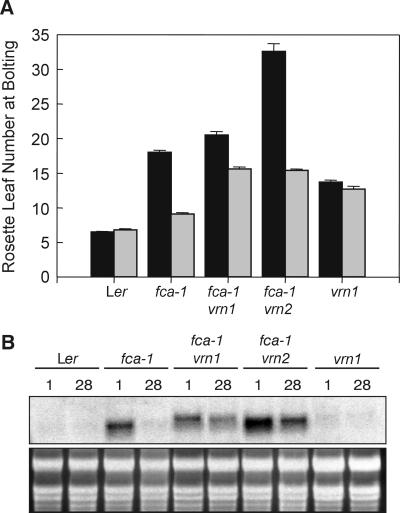
vrn1 and vrn2, two mutants with reduced responses to vernalization, have been isolated in the fca-1 mutant background (in Ler) (18). fca-1 vrn2 is later-flowering than fca-1 (ref. 18; Fig. 3A) and has a higher FLC transcript level than fca-1 (ref. 1; Fig. 3B), suggesting that apart from any role in the vernalization response, the wild-type VRN2 gene acts to repress FLC expression and thereby to promote flowering. fca-1 vrn1 has a similar flowering time to fca-1 (ref. 18; Fig. 3A) and a level of FLC transcript similar to fca-1 (Fig. 3B). Both fca-1 vrn1 and fca-1 vrn2 have less reduction in flowering time in response to vernalization than does fca-1 (ref. 18; Fig. 3A), which is matched by a smaller vernalization-induced reduction in FLC transcript level (Fig. 3B). This result indicates that the wild-type VRN1 and VRN2 genes are involved in mediating the vernalization-induced down-regulation of the FLC gene.
Figure 3.
Mutants with reduced responses to vernalization maintain a high FLC transcript level after cold treatment. (A) Flowering time expressed as rosette leaf number for Ler, fca-1, fca-1 vrn1–1, fca-1 vrn2–1, and vrn1–1, cold-treated for either 1 (black bars) or 28 (gray bars) days. Error bars represent the SE. (B) FLC expression in seedlings of Ler and the mutants in A, cold-treated for either 1 or 28 days, as indicated above the figure. The ethidium bromide-stained ribosomal bands are shown below the blots as loading controls.
vrn1, segregated away from the fca mutation and placed in an FCA background (18), is late-flowering in our growth conditions, although it does not have an up-regulated FLC transcript level (Fig. 3). This finding suggests that the VRN1 gene may be active in an FLC-independent flowering pathway as well as in the FLC-dependent pathway. vrn1 shows little vernalization response, presumably because of the low level of FLC transcript level.
The Down-Regulation of FLC Is Proportional to the Duration of Cold Treatment.
In a number of plant species, including Arabidopsis thaliana the magnitude of the promotion of flowering by cold treatment is proportional to the duration of the cold treatment (10, 19). In the C24 ecotype, we found correlations between the duration of the cold treatment, the promotion of flowering, and the decrease in FLC transcript levels (Fig. 4A). In Ptz-1, a late-flowering ecotype, the same correlation exists between the length of the vernalization period and the decrease in FLC transcript level and time to flower (Fig. 4B). However, the period of cold treatment required to saturate the vernalization response of Ptz-1 is greater than that required for C24.
The late-flowering overexpression mutant flc-11 requires a 56-day cold treatment to effect a substantial reduction in flowering time, whereas C24 has a saturated vernalization response with a 28-day cold treatment (1). Consistent with this finding, the flc-11 mutant also requires a longer period of cold treatment to decrease FLC transcript levels as compared with C24 (Fig. 4C).
Vernalization Reduces the Level of FLC Protein.
FLC protein was detected on Western blots by using antibodies raised to a bacterially expressed protein lacking the MADS domain (Fig. 4D). The amount of FLC protein decreased dramatically after 28 days of cold treatment in C24 and Ptz-1. Consistent with both the flowering-time data and the RNA-expression data, the decrease in the flc-11 mutant was not as great as in the two ecotypes. There was no detectable FLC protein in either the Ler ecotype or the flc-13 loss-of-function mutant, again consistent with the RNA data. Thus, the level of protein expression follows that of the mRNA, indicating that the regulation of FLC occurs predominantly at the transcriptional level.
The Down-Regulation of FLC Transcript by Cold Treatment Is Mitotically Stable, but Is Reset in Progeny.
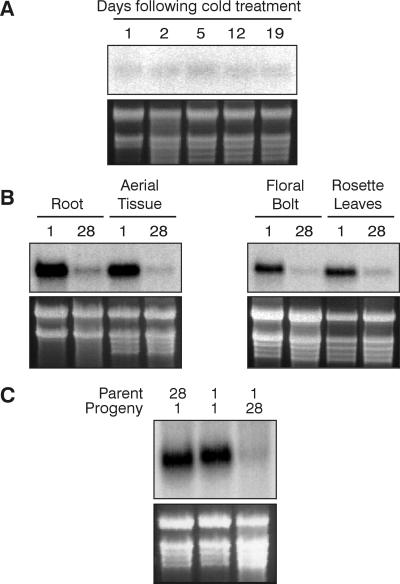
The exposure to low temperature often occurs early in a plant's development, and flowering may occur after many weeks or months of growth in warmer temperatures. This situation indicates that the vernalization signal is maintained through a number of cell divisions after the cessation of the low temperature (20). We investigated FLC transcript levels in C24 plants during growth at 21°C after a 4-week cold treatment. Fig. 5A shows the same low level of FLC transcript is present in vernalized plants harvested at 1, 2, 5, 12, and 19 days after transfer to 21°C growth conditions. These data indicate that the decrease in FLC transcript is mitotically stable; once transcript levels are decreased by vernalization, they remain low during the subsequent growth of the plant. The FLC transcript in both roots and floral bolts is decreased by cold treatment in a manner similar to that in rosette leaves (Fig. 5B). This result indicates that the cold treatment affects the meristems giving rise to both shoots and roots, and that the vernalization-induced reduction in FLC transcript is mitotically stable even after the transition to flowering is effected.
Figure 5.
The down-regulation of FLC transcript by cold treatment is mitotically stable, but is reset in progeny. (A) FLC expression in 28-day cold-treated C24, harvested after 1, 2, 5, 12, or 19 days of growth at 21°C, as indicated above the figure. The majority of the plants were bolting at 19 days. (B) FLC expression in tissues of 1- and 28-day cold-treated C24 plants. Root and aerial tissue were from one set of seedlings, and floral bolts (2–3 cm in height) and rosette leaves were derived from another set of plants. (C) FLC expression in C24 seedlings that were the progeny of plants that were either cold-treated for 28 days (lane 1) or for 1 day (lanes 2 and 3), which, in turn, themselves were either cold-treated for 1 day (lanes 1 and 2) or for 28 days (lane 3). The ethidium bromide-stained ribosomal bands are shown below the blots as loading controls.
The vernalized state is not transmitted to the progeny, and each generation of plants must be exposed to low temperature for early-flowering to occur (20). This finding is paralleled by the activity of the FLC gene (Fig. 5C). Progeny of both vernalized and nonvernalized plants have the same level of FLC transcript, which means that the FLC transcript level, as well as the vernalization requirement, is reestablished to the ground state in the progeny of a vernalized plant.
Conclusion: The Key Role of FLC in the Initiation of Flowering.
We have demonstrated a number of parallels between the reduction in flowering time in response to vernalization and the reduction in the level of FLC expression, including the proportionality between the duration of cold treatment and the reduction in both flowering time and FLC activity, and the mitotically stable inheritance and the need for cold treatment each generation. We conclude that FLC is central to both the control of the transition to flowering and the response to vernalization.
We have shown previously that the mutants of the photoperiod-responsive pathway do not have altered levels of FLC mRNA (1), and alteration of the photoperiod does not affect FLC expression (ref. 5 and data not shown). In support of this, the flc-13 mutant, which lacks FLC expression, maintains a photoperiod response (Fig. 1A) with the time-to-flower in a 16-h photoperiod being ≈75% of that in an 8-h photoperiod (about the same ratio as for the wild-type C24). Although FLC has a central role in the initiation of flowering in response to a low-temperature treatment, the change in photoperiod from 8 h to 16 h appears to induce flowering independently of FLC.
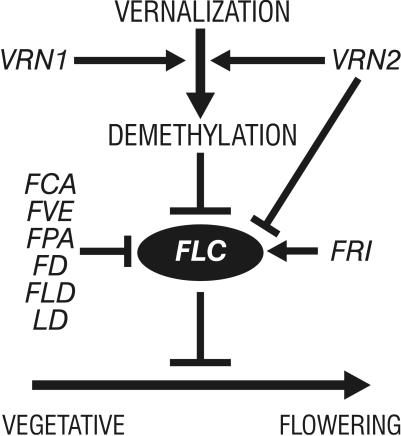
We have identified at least eight genes that regulate FLC expression, acting to either increase or decrease transcript levels. Together with low temperature-induced down-regulation of FLC, these genes serve to fine-tune the expression of FLC (Fig. 6). This regulation of FLC expression results in the sensitive control of flowering time in wild populations, allowing the matching of the time of flowering to the environmental conditions and the developmental state of the plant. Two of the genes that regulate FLC expression have been characterized. LD encodes a putative transcription factor (16) and may act directly to regulate FLC transcription. FCA encodes an RNA binding protein (21), which may regulate FLC at a posttranscriptional level. The identification of many genes that regulate FLC expression (Fig. 6) suggests that they may not all act directly on the FLC gene, but rather that some may act within the same regulatory cascade.
Figure 6.
Model indicating the role of FLC in the transition to flowering and its regulation by vernalization, methylation, and genes involved in controlling flowering time, based on data presented here and in refs. 1 and 7. The down-regulation of FLC expression by demethylation may be direct or may be through a regulator of FLC.
Vernalization can override the up-regulation of FLC transcript that occurs when FCA, FVE, FPA, FLD, or LD are mutated. We have proposed previously (6, 7) that vernalization acts through demethylation of specific sites of genomic DNA. FLC expression is reduced in transgenic plants that have a reduced level of DNA methylation (1), indicating that either FLC or a regulator of FLC is controlled by the DNA methylation status. If the FLC gene were regulated directly by its methylation status, for example, if a transcriptional activator bound to a motif only within a methylated promoter, then the reduction of DNA methylation by vernalization could prevent transcription and override control by other regulators.
FLC encodes a member of the MADS-box class of transcription factors, so it is likely to effect its repression of reproductive development by regulating the transcription of genes whose products are operative in the pathway to flowering. Gibberellins can promote flowering in Arabidopsis (22), but have no effect on FLC expression (1), suggesting that they may act downstream of FLC. We have proposed previously that FLC may act by antagonizing the promotive effect of gibberellins on flowering (1). We need to identify which, if any, of the gibberellin biosynthetic or signal-transduction genes is involved in mediating the action of FLC in the pathway to flowering.
Acknowledgments
We thank Chong-Xin Zhao for excellent technical assistance and Dr. Danny Llewellyn for his help in raising the FLC antibody.
Abbreviations
- Col
Columbia
- Ler
Landsberg erecta
- Ptz-1
Pitztal-1
- Ws-2
Wassilewskija-2
Footnotes
Article published online before print: Proc. Natl. Acad. Sci. USA, 10.1073/pnas.060023597.
Article and publication date are at www.pnas.org/cgi/doi/10.1073/pnas.060023597
References
- 1.Sheldon C C, Burn J E, Perez P P, Metzger J, Edwards J A, Peacock W J, Dennis E S. Plant Cell. 1999;11:445–458. doi: 10.1105/tpc.11.3.445. [DOI] [PMC free article] [PubMed] [Google Scholar]
- 2.Koornneef M, Blankestijn-de Vries H, Hanhart C, Soppe W, Peeters T. Plant J. 1994;6:911–919. [Google Scholar]
- 3.Lee I, Michaels S D, Masshardt A S, Amasino R M. Plant J. 1994;6:903–909. [Google Scholar]
- 4.Sanda S, Amasino R M. Weeds World. 1995;2:2–8. [Google Scholar]
- 5.Michaels S D, Amasino R M. Plant Cell. 1999;11:949–956. doi: 10.1105/tpc.11.5.949. [DOI] [PMC free article] [PubMed] [Google Scholar]
- 6.Burn J E, Bagnall D J, Metzger J D, Dennis E S, Peacock W J. Proc Natl Acad Sci USA. 1993;90:287–291. doi: 10.1073/pnas.90.1.287. [DOI] [PMC free article] [PubMed] [Google Scholar]
- 7.Finnegan E J, Genger R G, Kovac K, Peacock W J, Dennis E S. Proc Natl Acad Sci USA. 1998;95:5824–5829. doi: 10.1073/pnas.95.10.5824. [DOI] [PMC free article] [PubMed] [Google Scholar]
- 8.Dennis E S, Bilodeau P, Burn J, Finnegan E J, Genger R, Helliwell C, Kang B J, Sheldon C C, Peacock W J. In: Control of Plant Development: Genes and Signals, Symposia of the Society for Experimental Biology. Greenland A J, Meyerowitz E M, Steer M, editors. Vol. 51. Cambridge, U.K.: Company of Biologists; 1997. pp. 97–103. [PubMed] [Google Scholar]
- 9.Langridge J. Aust J Biol Sci. 1957;10:243–252. [Google Scholar]
- 10.Bagnall D J. Ann Bot (London) 1993;71:75–83. [Google Scholar]
- 11.Burn J E, Smyth D R, Peacock W J, Dennis E S. Genetica (The Hague) 1993;90:147–155. [Google Scholar]
- 12.Clough S J, Bent A F. Plant J. 1998;16:735–743. doi: 10.1046/j.1365-313x.1998.00343.x. [DOI] [PubMed] [Google Scholar]
- 13.Logemann J, Schell J, Willmitzer L. Anal Biochem. 1987;163:16–20. doi: 10.1016/0003-2697(87)90086-8. [DOI] [PubMed] [Google Scholar]
- 14.Koornneef M, Hanhart C J, Van der Veen J H. Mol Gen Genet. 1991;229:57–66. doi: 10.1007/BF00264213. [DOI] [PubMed] [Google Scholar]
- 15.Chou M-L, Yang C-H. Plant J. 1998;15:231–242. doi: 10.1046/j.1365-313x.1998.00204.x. [DOI] [PubMed] [Google Scholar]
- 16.Lee I, Aukerman M J, Gore S L, Lohman K N, Michaels S D, Weaver L M, John M M, Feldmann K A, Amasino R M. Plant Cell. 1994;6:75–83. doi: 10.1105/tpc.6.1.75. [DOI] [PMC free article] [PubMed] [Google Scholar]
- 17.Levy Y Y, Dean C. Plant Cell. 1998;10:1973–1990. doi: 10.1105/tpc.10.12.1973. [DOI] [PMC free article] [PubMed] [Google Scholar]
- 18.Chandler J, Wilson A, Dean C. Plant J. 1996;10:637–644. doi: 10.1046/j.1365-313x.1996.10040637.x. [DOI] [PubMed] [Google Scholar]
- 19.Purvis O N, Gregory F G. Ann Bot (London) 1937;1:569–591. [Google Scholar]
- 20.Lang A. In: Encyclopedia of Plant Physiology. Ruhland W, editor. Berlin: Springer; 1965. pp. pp.1489–1536. [Google Scholar]
- 21.Macknight R, Bancroft I, Page T, Lister C, Schmidt R, Love K, Westphal L, Murphy G, Sherson S, Cobbett C, Dean C. Cell. 1997;89:737–745. doi: 10.1016/s0092-8674(00)80256-1. [DOI] [PubMed] [Google Scholar]
- 22.Bagnall D J. Aust J Plant Physiol. 1992;19:401–409. [Google Scholar]


