Abstract
Formation of fluorescent proteins was explored after incubation of recombinant apo-subunits of phycobiliprotein R-phycoerythrin with phycoerythrobilin chromophore. Alpha and beta apo-subunit genes of R-phycoerythrin from red algae Polisiphonia boldii were cloned in plasmids pET-21d (+). Hexa-histidine tagged apo-alpha and apo-beta subunits were expressed in Escherichia coli. Although expressed apo-subunits formed inclusion bodies, fluorescent holo-subunits were constituted after incubation of Escherichia coli cells with phycoerythrobilin. Subunits contained both phycoerythrobilin and urobilin chromophores. Fluorescence and differential interference contrast microscopy showed polar location of holo-subunit inclusion bodies in bacterial cells. Cells containing fluorescent holo-subunits were several times brighter than control cells as found by fluorescence microscopy and flow cytometry. Addition of phycoerythrobilin to cells did not show cytotoxic effects in contrast to expression of proteins in inclusion bodies. In an attempt to improve solubility, R-phycoerythrin apo-subunits were fused to maltose binding protein and incubated with phycoerythrobilin both in vitro and in vivo. Highly-fluorescent soluble fusion proteins were formed containing phycoerythrobilin as the sole chromophore. Fusion proteins were localized by fluorescence microscopy either throughout Escherichia coli cells or at cell poles. Flow cytometry showed that cells containing fluorescent fusion proteins were up to ten times brighter than control cells. Results indicate that fluorescent proteins formed by attachment of phycoerythrobilin to expressed apo-subunits of phycobiliproteins can be used as fluorescent probes for analysis of cells by microscopy and flow cytometry. A unique property of these fluorescent reporters is their utility in both properly folded (soluble) subunits and subunits aggregated in inclusion bodies.
INTRODUCTION
Fluorescent proteins with useful spectroscopic properties in the visible region of the spectrum are widely used for analysis of cells and molecules in numerous fluorescence assays [1]. For example, green fluorescent protein (GFP) and its variants have made a significant impact on cell biology as in vivo reporters of protein localization and gene expression [1, 2]. Continued development of novel and improved fluorescent protein probes will increase the repertoire of available fluorescent probes, and contribute to new discoveries about cell structure and function [3].
Phycobiliproteins, including R-phycoerythrin (R-PE), are highly fluorescent proteins with absorption coefficients and quantum yields that are superior compared to other fluorescent proteins [1, 4]. These proteins are found in nature as components of the photosynthetic apparatus in cyanobacteria, red algae, and cryptomonads. They have proven valuable fluorescent probes in flow cytometry and immunofluorescence microscopy [4, 5]. Subunits of phycobiliproteins are also highly fluorescent [6, 7]. The fluorescence of phycobiliproteins and their subunits results from covalently bound phycobilin chromophores. Phycobilins are tetrapyrrole compounds bound to specific cysteins of phycobiliproteins by either single or double thioether bonds [1, 4]. For example, subunits of R-PE, whose structure has been described as (αβ)6γ, are highly fluorescent due to covalently bound phycoerythrobilin (PEB) and phycourobilin (PUB) chromophores [1, 4, 7].
Recombinant proteins that retain the excellent fluorescence properties of phycobiliproteins are highly desirable fluorescent probes [8–10]. Although phycobilins are not genetically encoded as is the chromophore of GFP, there are ways to form phycobilin chromophores and attach them to apo-subunits of phycobiliproteins in vivo. The first approach is based on the use of enzymes that form and attach phycobilins to recombinant apo-subunits [8, 9, 11–13]. Expression of these enzymes, including heme oxygenase, phycocyanobilin (PCB) ferredoxin reductase and heterodimeric lyases/isomerases, in Escherichia coli (E. coli) along with apo-alpha subunits of C-phycocyanin (C-PC) and phycoerythrocyanin (PEC) lead respectively to complete biosynthesis of fluorescent holo-alpha subunits of C-PC and PEC in vivo [8, 9]. Another enzymatic approach included expression of fusion proteins between C-phycocyanin apo-subunits and specific tags in cyanobacterium Anabaena sp. PCC7120 [10]. Chromophore attachment happened in vivo and yielded fluorescent proteins that were readily purified and usable as fluorescence labels. Both of these enzymatic approaches yielded fluorescent recombinant phycobiliprotein subunits in vivo.
Non-enzymatic (autocatalytic) attachment of phycobilins to genetically expressed apo-subunits of phycobiliproteins is also possible since phycobilins can be isolated and purified from phycobiliproteins after reflux in methanol [14, 15]. Attachment of phycobilins to recombinant apo-phycobiliproteins from cyanobacteria has been investigated in vitro. This process yielded fluorescent isomeric products with distinct spectral characteristics, and did not show specificity of enzymatic binding in vivo [14]. PCB binds in vitro to expressed apo-subunits (αβ monomer) of C-PC and forms phycobilin mesobiliverdin (MBV) [16, 17]. PEB also binds to αβ monomer of C-PC and forms not only PEB adduct but also transforms during attachment into 15, 16-dihydrobiliverdin (DBV) [18]. Products of in vitro attachment of PEB to apo-alpha subunit of C-phycoerythrin (C-PE) include covalently bound PEB, DBV, and urobilin (UB) [19]. After prolonged sonication of apo-subunits located in inclusion bodies, incubation of apo-alpha subunit of phycoerythrocyanin with PCB and PEB yielded PCB and PEB adducts, respectively [15].
In contrast to binding of PEB to recombinant phycobiliproteins from cyanobacteria, PEB can bind to plant phytochrome apoproteins both in vitro and in vivo (in Arabidopsis thaliana) without change in the conformation of the chromophore [20]. Phytochromes are photoreceptor proteins responsible for light–induced morphogenesis in plants, and originally contain low-fluorescent phytochromobilin chromophore [1]. PEB attachment to phytochrome apoproteins yields highly fluorescent phytofluors [20]. PEB, which is a low fluorescent compound, showed roughly 500–1500-fold increase in brightness after binding to apophytochrome protein. These results indicate that it will be of great interest to find recombinant apo-phycobiliproteins such as phytochromes that will be able to bind PEB chromophore and form highly fluorescent proteins.
The attachment of phycobilins to recombinant subunits of R-PE has not been explored thus far. A study that involves non-enzymatic attachment of PEB and/or PUB to apo-subunits of R-PE from red algae would lead to the characterization of enzymes important for formation and binding of these chromophores to R-PE apo-subunits in red algae. It is believed that mechanisms of PEB and PUB formation and attachment to apo-subunits of phycobiliproteins in vivo are enzymatic as supported by discovery of lyases involved in PEB attachment to the apo-alpha subunit of cyanobacterial C-PE [21]. Moreover, fluorescent phycobiliproteins formed by external addition of phycobilins to genetically expressed apo-phycobiliproteins could represent useful new fluorescent probes. To test the possibility that fluorescent proteins could be formed upon incubation of recombinant apo-subunits of R-PE with PEB chromophore, we cloned and expressed the genes encoding α and β apo-subunits of R-PE from the red algae P. boldii [22] in E. coli. R-PE apo-subunits were also fused to periplasmic and cytoplasmic versions of E. coli maltose binding protein (MBP). After expression of the proteins in E. coli, we characterized the binding specificity of PEB to apo-subunits and apo-subunit fusions both in vitro and in vivo.
MATERIALS AND METHODS
Cloning of apo-subunit genes and expression of His-tagged R-PE apo-subunits
Red algae P. boldii was grown in ES-enriched seawater medium (UTEX the Culture Collection of Algae, University of Texas, Austin, TX). P. boldii DNA was isolated from algae by DNeasy Plant Mini Kit (Qiagen INC., Valencia, CA) using the manufacturer’s protocol. Hot Start Taq DNA Polymerase PCR kit (Qiagen) was used for polymerase chain reaction (PCR). Primers used to amplify alpha subunit gene were: 5′-ATG AAA TCA GTT ATT ACT ACA ACA ATA AGT GC-3′ and 5′-GCT TAA AGA GTT AAT TAA GTA ATC TAG TGC-3′. Primers used to amplify beta subunit gene were: 5′-ATG CTT GAC GCA TTT TCT AGA GTT GTA GT-3′ and 5′-ACT AAC AGC AGC AAC AAC TCT ATC GCA-3′. Thirty PCR cycles were conducted by using the following program: 95 °C for 30 s, 55 °C for 30 sec, and 72 °C during 1min. In the end, samples were heated at 72 °C during 10 min, and cooled down at 4 °C. PCR products were analyzed by electrophoresis on 0.8 % agarose gel using a standard procedure. Products were ligated separately in pBAD-TOPO plasmid using pBAD-TOPO TA Expression Kit (Invitrogen, Carlsbad, CA). These plasmids were further transformed in E. coli strain DH5α and LMG194. Plasmids were isolated, and their sequences were confirmed by DNA sequencing (DNA Facility, Iowa State University, Ames, IA). His-tagged subunits were expressed in E. coli cells by L-arabinose according to manufacturer’s procedure. E. coli cells were lysed and lysates were analyzed by SDS-PAGE. The expression yielded a small amount of His-tagged subunits detected only by Western blotting using Opti-4CN colorimetric detection kit (Bio-Rad, Richmond, CA). Subunit genes (including His tags) were cut from pBAD-TOPO plasmids by Sca I and Nco I enzymes, and ligated separately in plasmids pET – 21d (+) (Novagen, Madison, WI). Resulting plasmids were transformed in E. coli strain BL21(DE3) (Novagen). Plasmids were isolated, and their sequences confirmed by DNA sequencing. Apo-subunit expressions were induced with 1 mM isopropyl β-D-thiogalactopyranoside (IPTG) according to the manufacturer’s protocol (Novagen). Induction was omitted in control cells. Cells were further incubated with PEB or used for protein isolation according to procedures described below.
Expression of MBP-R-PE subunit fusions
Genes for R-PE alpha and beta apo-subunits were cut from pET plasmids using enzymes BamHI and ScaI, and ligated separately into pMAL-p2X and pMAL-c2X vectors that contain genes for cytoplasmic and periplasmic versions of MBP, respectively (New England Biolabs, Beverly, MA). Fusion proteins under control of pTAC promoter were expressed in E. coli strain DH5α after induction with IPTG. Cells were further incubated with PEB or used for isolation of fusion proteins according to procedures shown below.
Apo-subunit purification
Either mini Bead Beater and glass beads (BioSpec Products INC, Bartlesville, OK) or guanidinium lysis buffer and an ultrasonic processor (Sonics, Newton, CT) were used for lysis of E. coli cells. His-tagged R-PE apo-subunits were isolated from bacterial cells under denaturing conditions using ProBond™ Protein Purification System and the manufacturer’s protocol (Invitrogen). Subunits were eluted in denaturing elution buffer (8 M Urea, 500 mM NaCl, 20 mM sodium phosphate, pH 4.0). Expressions of subunits were checked by SDS-PAGE on a mini gel (Bio-Rad). Isolations under native conditions using both ProBond Protein Purification System (Invitrogen) and Qiagen “super flow” Ni2+-nitrilotriacetic acid agarose [8] were tried as well.
PEB purification
PEB was the generous gift of Dr. Hugo Scheer and Dr. Max Storf (University of Munich, Germany) [15].
Holo-subunit reconstitution in vitro
Apo-subunit solutions in denaturing elution buffer (500 μl) were incubated with 25 μl of 27.0 μM PEB solution in DMSO at room temperature overnight. Incubations of cell lysates in Tris-HCl buffer (pH 8.2) were also tried. Holo-subunit presence in samples was checked as described in the following section.
Holo-subunit reconstitution in vivo
E. coli cells were washed in PBS buffer and incubated with shaking in 10 ml of the same buffer containing 100 μl of 33.7 μM PEB solution in DMSO at 25 °C overnight. Control cells were treated in the same way. After cell lysis, holo-subunit formation was checked by SDS-PAGE using fluorescence gel imaging (Typhoon, Amersham Pharmacia Biotech, Piscataway, NJ) and Coomassie staining [7]. A 532 nm laser and 580 nm band pass filter were used during fluorescence imaging. R-PE (Invitrogen Molecular Probes, Eugene, OR) was loaded on the gel as a standard fluorescent sample. Visible fluorescence of samples was observed and photographed after illumination through the UV transilluminator FOTO/UV 21 (Fotodyne, Hartland, WI).
Holo-subunit purification
His-tagged R-PE holo-subunits were isolated from bacterial cells under denaturing conditions using ProBond Protein Purification System (Invitrogen). Holo-subunits were eluted in denaturing elution buffer. In addition, fluorescent inclusion bodies were isolated using B-PER Bacterial Protein Extraction Reagent (Pierce Biotechnology, Rockford, IL). Inclusion Body Solubilization Reagent (Pierce) was used for solubilization and refolding of inclusion bodies.
Purification of MBP-R-PE subunit fusions
Purification of fusion proteins was done by affinity chromatography on amylose resin using the manufacturer’s protocol (New England Biolabs). Proteins were eluted in maltose elution buffer (10 mM maltose, 1 mM EDTA, 20 mM NaCl, 20 mM Tris-HCl buffer, pH 7.4).
PEB attachment to MBP-R-PE subunit fusions in vitro
MBP-fusion solutions (500 μl) in maltose elution buffer were incubated with 25 μl of 27.0 μM PEB solution in DMSO at room temperature overnight. Control solution contained 500 μl of maltose elution buffer and 25 μl of 27.0 μM PEB solution in DMSO. Solutions were incubated with shaking at room temperature overnight.
PEB attachment to MBP-R-PE subunit fusions in vivo
The procedure was as same as the procedure described for in vivo reconstitution of holo-subunits.
Digital photography
Images of protein solutions and cells containing recombinant proteins were recorded by Nikon COOLPIX 5000 digital camera (Nikon, INC., Tokyo, Japan).
Preparation of microscope slides
Cells were washed three times and appropriately diluted with PBS buffer. 75 μl of the cell suspension was spread on poly-L-Lysine treated cover glasses and incubated for 45 min. Cells were fixed immediately in 4% paraformaldehyde for 30 minutes. Cover slips were washed three times five-minute each in PBS buffer, and mounted on a glass microscope slides using n–propyl gallate mounting medium. The cover slip was sealed around the edges with a nail polish.
Microscopy
Differential interference contrast (DIC) and fluorescence imaging of cells containing holo-subunits was done by Zeiss Axioplan 2 upright microscope (Carl Zeiss, INC., Thornwood, NY). A 100 × PlanFluor immersion oil objective with numerical aperture (NA) of 1.3 was used in both imaging modes. A dry turret condenser (NA = 0.9) was used for DIC microscopy. DAPI, FITC, TRITC and triple DAPI/FITC/TRITC filter sets were used for fluorescence microscopy. Images were acquired by Axiocam HRc CCD camera with Axiovision software (Carl Zeiss).
DIC and fluorescence imaging of cells containing MBP-R-PE subunit fusions was done by Nikon Eclipse 80i upright microscope. 100× PlanApo oil objective with numerical aperture (NA) of 1.4 was used in both imaging modes. An oil condenser (NA = 1.4) was used in DIC microscopy. A TRITC filter set was used for fluorescence microscopy. Magnification was optionally increased with 2× zoom lens in front of the CCD camera. Images were acquired by Micromax CCD camera and WinView 32 imaging software (Roper Scientific, Trenton, NJ).
Flow cytometry
E. coli cells were washed three times and appropriately diluted with PBS buffer. Cell suspensions were measured for fluorescence on a Guava PCA flow cytometer (Guava Technologies, Hayward, CA) equipped with a single 532 nm diode laser. Fluorescence was detected using PMT1 in conjunction with a 580 nm band-pass filter. An electronic gate was set around E. coli cells based on their forward scatter properties. Up to 10,000 gated events per sample were collected and stored in list mode files. Analysis was performed with FlowJo software (Tree Star, Ashland, OR), displaying forward scatter-gated data in single parameter histograms of logarithmic fluorescence.
Cell viability assay
Cell viability test was done by flow cytometer EPICS ALTRA (Beckman Coulter INC, Fullerton, CA). Two sets of samples were prepared. First set contained cells with and without expressed apo-subunits incubated with the PEB. Second set contained cells with and without apo-subunits not incubated with PEB. Cells were stained with dyes propidium iodide (PI) and Syto-9 (Invitrogen Molecular probes). In the case of cells stained with PI fluorescence was excited with 488 nm laser and detected by 580 nm band pass filter. Fluorescence of the cells stained with Syto-9 was excited at 488 nm and detected by a 520 nm band pass filter. In addition cells fixed with 2% paraformaldehyde were stained and analyzed as above.
Fluorescence spectroscopy
A luminescence spectrometer LS50B (Perkin-Elmer, Beakonsfield, UK) was used to measure fluorescence spectra of protein and PEB solutions in increments of 0.5 nm. Widths of the excitation and emission slits were set at 10 nm.
RESULTS
Cloning and expression of R-PE apo-subunits
DNA from red algae P. boldii was isolated and used as the PCR template to amplify genes that encode the alpha and beta apo-subunits of R-PE. PCR fragments obtained were similar in length to their predicted lengths of 492 bp and 531 bp respectively [22], as confirmed by agarose gel electrophoresis. Genes cloned in pBAD-TOPO plasmids were transformed in E. coli strains DH5α and LMG194. Expression from cells harboring pBAD-TOPO plasmids yielded a low amount of apo-subunits that were detected only by Western blotting. Much higher amounts of apo-subunits were expressed using the plasmid pET - 21d (+) in E. coli strain BL21(DE3) as shown by SDS-PAGE (Fig. 1A). The higher expression from T7lac promoter was consistent with the higher rate of transcriptional initiation in comparison to the araBAD promoter. Sequences of the inserts in the pET plasmids showed no differences to that reported by Roell et al [22] for the apo-beta subunit, while a change resulting in an alanine residue in place of threonine at position 124 of the apo-alpha subunit was found [22]. From the predicted amino-acid sequences His-tagged apo-subunits should have molecular weights of approximately 22.3 kDa and 23.2 kDa. The molecular weights of the subunits analyzed by SDS-PAGE were close to these values (Fig. 1A).
Figure 1.
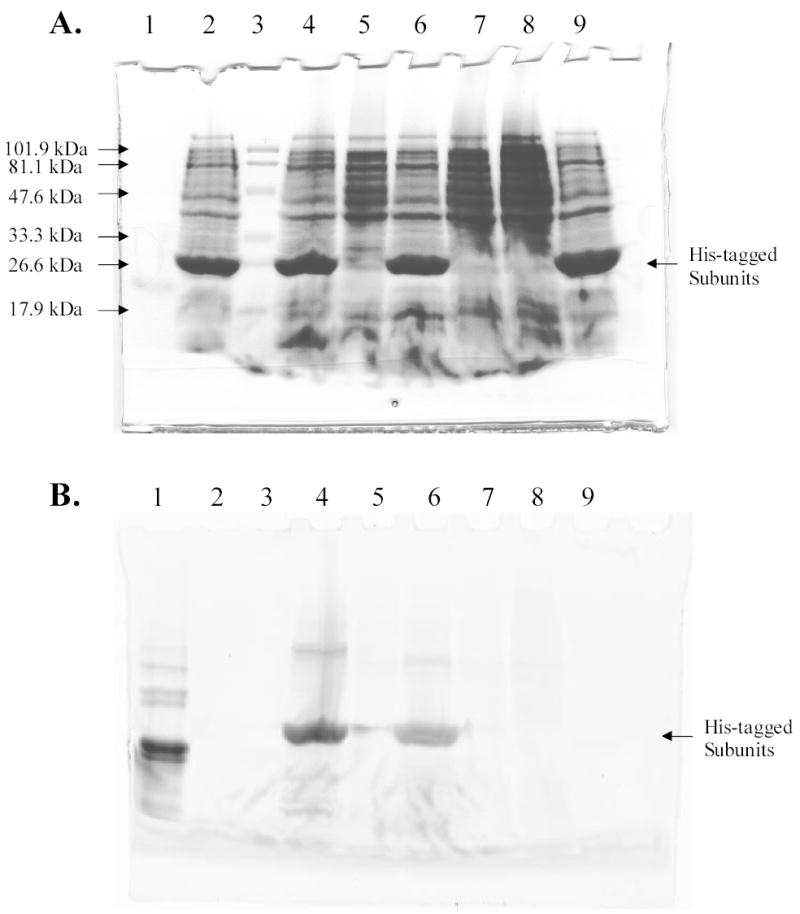
Analysis of His-tagged R-PE apo-subunits and holo-subunits by SDS-PAGE. A, Detection of proteins by Coomassie staining. B, Detection of proteins by fluorescence imaging (excitation wavelength 532 nm; emission filter 580BP30). Lane 1, R-PE subunits; lane 2, lysate of cells that expressed apo-alpha subunit of R-PE; lane 3, prestained MW standards, low range 18–106 kDa (Bio-Rad); lane 4, lysate of cells that expressed apo-alpha subunit of R-PE and were incubated with PEB. Holo-alpha subunit was formed; lane 5, lysate of cells that were not induced for expression of apo-alpha subunit of R-PE but were incubated with PEB; lane 6, lysate of cells that expressed apo-beta subunit of R-PE and were incubated with PEB. Holo-beta subunit was formed; lane 7, lysate of cells that were not induced for expression of apo-beta subunit of R-PE but were incubated with PEB; lane 8, lysate of BL21(DE3) cells. Cells were incubated with PEB, but neither contained plasmids bearing subunit genes nor were treated with IPTG; lane 9, lysate of cells that expressed apo-beta subunit of R-PE.
Attachment of PEB to R-PE apo-subunits
Very low amounts of His-tagged R-PE apo-subunits were isolated under native conditions because subunits precipitated in the pellet after cell lysis. It was possible to isolate high amounts of apo-subunits, however, under denaturing conditions suggesting the subunits were aggregating into inclusion bodies. After incubation of isolated apo-subunits with PEB in vitro, very low levels of fluorescent subunits were detected by SDS-PAGE and fluorescence imaging. Deposition of apo-subunits in inclusion bodies and their low solubility under native conditions prevented an assay of PEB binding to R-PE apo-subunits in vitro. However, fluorescent holo-subunits were formed in vivo upon incubation of cells expressing the apo-subunits with PEB. Fluorescence of holo-subunits was shown by fluorescence imaging after SDS-PAGE (Fig. 1B, lanes 4 and 6). Control cells grown without inducer showed very low amounts of fluorescent holo-subunits after incubation with PEB (Fig. 1B, lanes 5 and 7). The low level of fluorescence could be attributed to the autocatalytic induction of the T7lac promoter. Cells that were not incubated with PEB did not show the presence of fluorescent proteins (Fig. 1B, lanes 2 and 9). Furthermore, the color of the E. coli cells expressing the apo-subunits was pink after incubation of cells with PEB chromophore indicating the formation of holo-subunits in vivo (Supplementary Fig. 1A). In addition, intense orange fluorescence was observed from these cells under exposure to UV irradiation. The holo-subunits isolated from E. coli cells were pink (Supplementary Fig. 1B), however, chromophore binding did not increase the solubility of the apo-subunits.
Supplementary Figure 1.
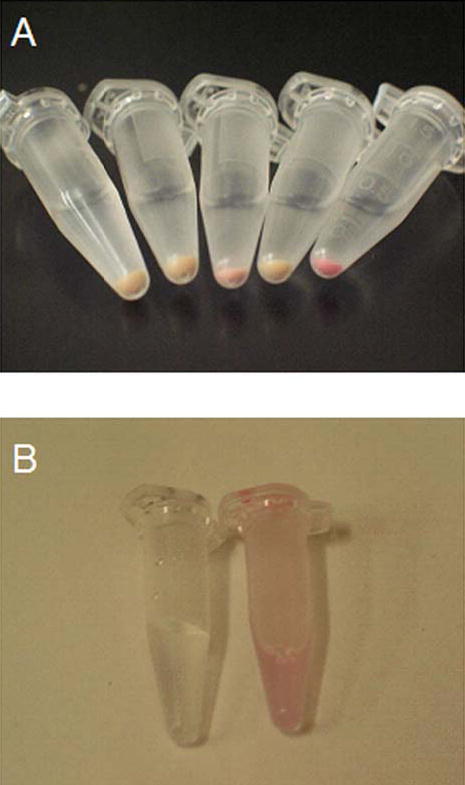
A, Photograph of E. coli cells from left to right: 1. BL21(DE3) cells that neither contained plasmids bearing subunit genes nor were treated with IPTG, 2. Control cells that were not induced for expression of apo-beta subunit of R-PE, 3. Cells that were induced for expression of apo-beta subunit of R-PE, 4. Control cells that were not induced for expression of apo-alpha subunit of R-PE, and 5. Cells that were induced for expression of apo-alpha subunit of R-PE; B, Photograph of holo-alpha subunit solution isolated in the denaturing buffer (right) compared to the pure denaturing buffer (left). Pink color of holo-subunits in cells and after isolation in denaturing buffer can be seen.
Spectroscopic characterization of holo-subunits
We have previously reported the spectroscopic characteristics of the various R-PE subunits with and without phycoerythrobilin and phycourobilin chromophores (inset to Figure 2, Table 1, Figure 3 and Table 2 in Ref. 7). Fluorescent spectra of R-PE holo-subunits have also been recorded in cells and after isolation of holo-subunits under denaturing conditions [23]. In Figures 3, 5 and 6 there we showed the fluorescence and excitation spectra of the various forms as well as spectra of GFP. Fluorescence and absorption maxima of holo-subunits are shown in Table 1, and were identical for both alpha and beta holo-subunits. Excitation maximum at 495.0 nm and emission maximum at 506.5 nm show that holo-subunits contain urobilinoid chromophore that could be either UB or PUB. Excitation maxima at 542.5 nm and 573.0 nm and emission maxima at 569.5 nm and 581.5 nm correspond to holo-subunits containing PEB. Absorption spectrum of isolated holo-subunits showed a maximum at 496.0 nm corresponding to UB and another maximum at 552.0 nm corresponding to PEB. UV induced orange fluorescence of cells might be attributed to an excitation peak of covalently bound PEB at 308 nm. This peak was overlapped in excitation fluorescence spectrum with a more intensive excitation peak of proteins at 280 nm.
Figure 2.
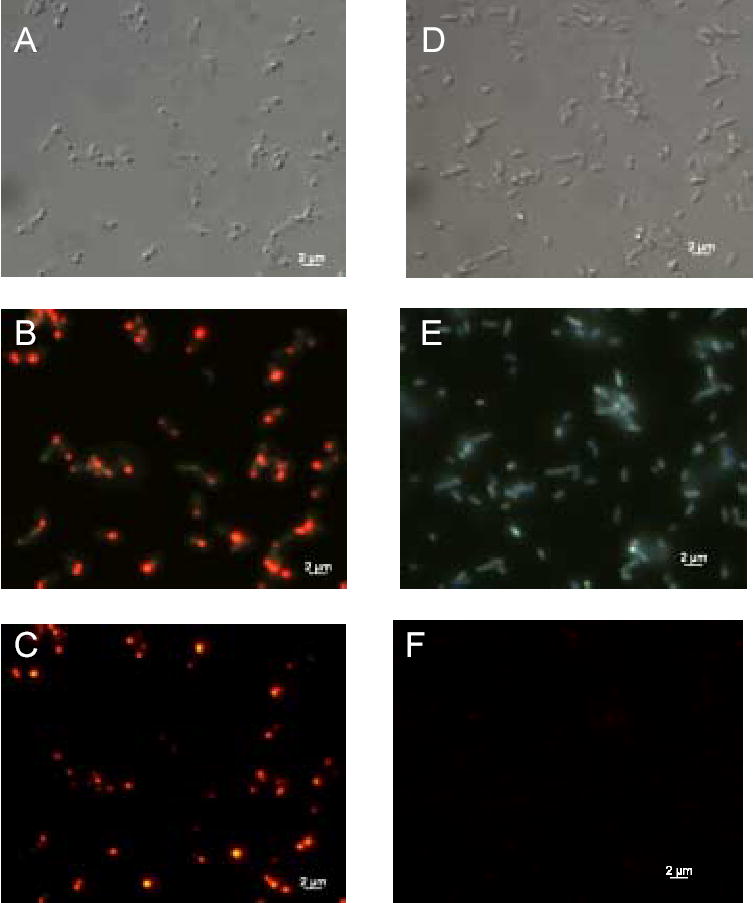
Subcellular localization of holo-alpha subunit. E. coli cells expressing R-PE apo-alpha subunit and control cells were fixed on microscope slides after incubation with PEB. Panels A, D: DIC images of induced and control cells. Panels B, E: Fluorescence images of induced and control cells detected by triple DAPI/FITC/TRITC filter cube. Images show merged native fluorescence and fluorescence from PEB attachment to cell components. Panels C, F: Fluorescence images of induced and control cells recorded by TRITC filter cube. These images confirm that fluorescent holo-alpha subunit is located in inclusion bodies at the poles of induced E. coli cells.
Table 1.
Spectroscopic characteristics of holo-subunits formed after attachment of PEB to recombinant R-PE apo-subunits in vivo. From these values and referenced literature [23] it was concluded that attachment of PEB to cells containing R-PE apo-subunits yields holo-subunits containing both urobilin (UB) and PEB.
| Phycobilin present in holo-subunit | UB | PEB | |
|---|---|---|---|
| Absorption maximum (nm) | 496.0 | 552.0 | |
| Excitation fluorescence maximum (nm) | 495.0 | 542.5 | 569.5 |
| Emission fluorescence maximum (nm) | 506.5 | 573.0 | 581.5 |
Figure 3.
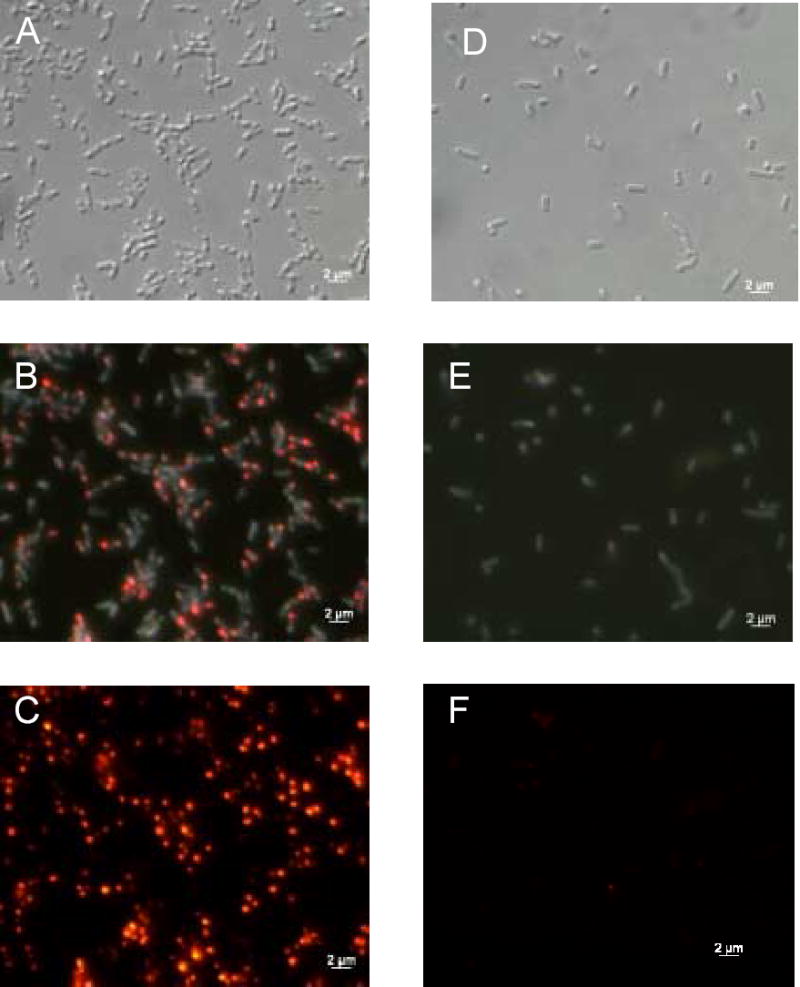
Subcellular localization of holo-beta subunit. E. coli cells expressing R-PE apo-beta subunit and control cells were fixed on microscope slides after incubation with PEB. These images confirm that fluorescent holo-beta subunit is located in inclusion bodies at the poles of induced E. coli cells. Labels are identical to Fig. 2.
Table 2.
Fluorescence maxima of MBP-R-PE apo-subunit fusion proteins after attachment of PEB in vivo. Proteins were isolated from E. coli cells containing MBP-R-PE apo-subunit fusions after incubation of cells with PEB. Spectra of fusion proteins were recorded in maltose elution buffer by a fluorescence spectrometer (λexc = 530 nm, λem = 610 nm). From these values and referenced literature it was concluded that attachment of PEB to cells containing MBP-R-PE apo-subunit fusion proteins yields holo-subunit fusion proteins containing PEB as the sole chromophore.
| Excitation fluorescence maximum (nm) | 577.5 |
| Emission fluorescence maximum (nm) | 584.0 |
| Phycobilin present in fusion protein | PEB |
Figure 5.
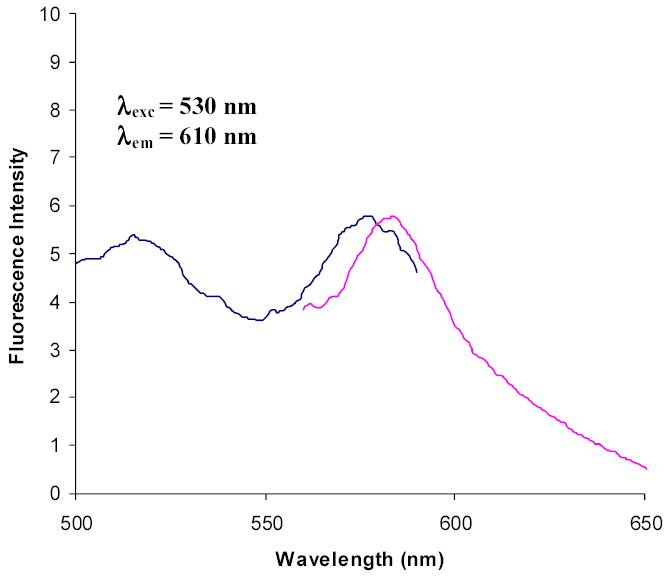
Normalized excitation and emission fluorescence spectra of cytoplasmic MBP-R-PE alpha subunit fusion protein after attachment of PEB in vivo. Emission wavelength used to record excitation spectrum was 610 nm. Excitation wavelength used to record emission spectrum was 530 nm. Spectra show excitation peak at 577.5 nm and emission peaks at 584.0 nm, and indicate formation of fluorescent fusions containing PEB. Fusion protein between cytoplasmic MBP and R-PE beta subunit showed the same fluorescence spectra after PEB attachment. Excitation peak at 517 nm comes from the solvent (maltose elution buffer).
Figure 6.
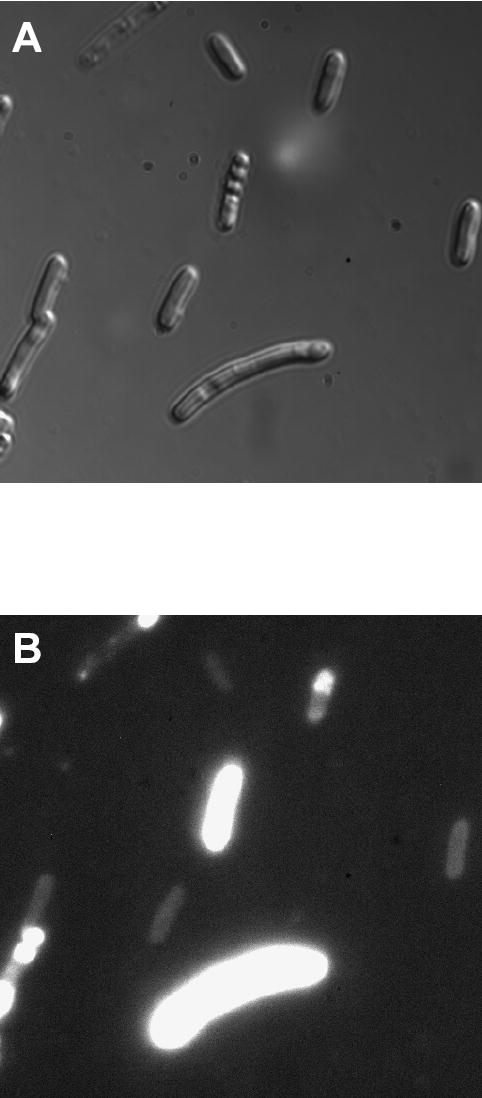
Subcellular localization of fusion protein consisting of periplasmic MBP and R-PE apo-alpha subunit after incubation of cells with PEB. Elongated cells were much brighter than normal cells probably because they expressed more of the fusion protein. Fluorescent fusions were localized throughout cells in normal cells indicating that fusion proteins are soluble in the cell cytoplasm, and probably partially exported to periplasmic space. In elongated cells, fluorescent fusions were localized both in cell cytoplasm and at cell poles revealing the presence of both soluble and insoluble fusion proteins. Elongation of cells was not noticed in control cells and fluorescence of these cells was less bright than fluorescence of induced cells (images not shown).
Localization of holo-subunits in E. coli
We used DIC and epi-fluorescence microscopy to investigate the E. coli cells expressing the holo-subunits. Figure 2 represents expression pattern of holo-alpha subunit and Figure 3 represents expression pattern of holo-beta subunit. As predicted, cells with holo-subunits contained inclusion bodies usually at one of their poles, as shown by DIC (Fig. 2A and 3A). Polar location of inclusion bodies is also shown by superposition of native fluorescence of cells and fluorescence from holo-subunits by using the triple DAPI/FITC/TRITC filter cube (Fig. 2B and 3B). The inclusion bodies fluoresced intensively orange as shown by fluorescence microscopy using a TRITC filter cube (Fig. 2C and 3C). Holo-subunit fluorescence was also detected with filters specific for FITC and phycoerythrins that is in agreement with fluorescence spectra of holo-subunits. Control cells did not show evidence of inclusion bodies when analyzed by DIC and fluorescence microscopy (Fig. 2D–F and Fig. 3D–F). Low fluorescence was noticeable from control cells, but the intensity of fluorescence from control cells was much lower than fluorescence of cells containing holo-subunits (Fig. 2 and Fig. 3, panels C and F).
Flow Cytometry
Flow cytometry was used to measure quantitatively the fluorescence ratio between cells containing holo-subunits and control cells. Distribution of fluorescence intensities for 10,000 cells showed noticeably higher fluorescence of induced cells. As shown in Supplementary Table 1, cells containing holo-α and holo-β subunits were on average 5.2 and 2.6 times brighter than control cells. Control cells showed fluorescence that was on average 1.3 times higher than fluorescence of cells that were not incubated with PEB (data not shown).
Supplementary Table 1.
Spectroscopic characteristics of holo-subunits formed after attachment of PEB to recombinant R-PE apo-subunits in vivo. From these values and referenced literature [23] it was concluded that attachment of PEB to cells containing R-PE apo-subunits yields holo-subunits containing both urobilin (UB) and PEB.
| Phycobilin present in holo-subunit | UB | PEB | |
|---|---|---|---|
| Absorption maximum (nm) | 496.0 | 552.0 | |
| Excitation fluorescence maximum (nm) | 495.0 | 542.5 | 569.5 |
| Emission fluorescence maximum (nm) | 506.5 | 573.0 | 581.5 |
In a flow cytometry viability assay, each sample showed increased green fluorescence in the case of cell staining with the dye Syto-9, which labeled both dead and live cells (Supplementary Fig. 2A). After staining with PI, cells without expressed subunits showed a fraction of live cells and a fraction of dead cells (Supplementary Fig. 2B). When these cells were killed by fixation in para-formaldehyde they did not show any fluorescence (Supplementary Fig. 2C). Even without fixation in para-formaldehyde, cells expressing apo or holo-subunits failed to show any fluorescence after incubation with PI (Supplementary Fig. 2D). From these results we concluded that cells containing apo or holo-subunits overexpressed in inclusion bodies were inviable, while cells not expressing the subunits remained alive. Addition of PEB was not toxic to cells.
Supplementary Figure 2.
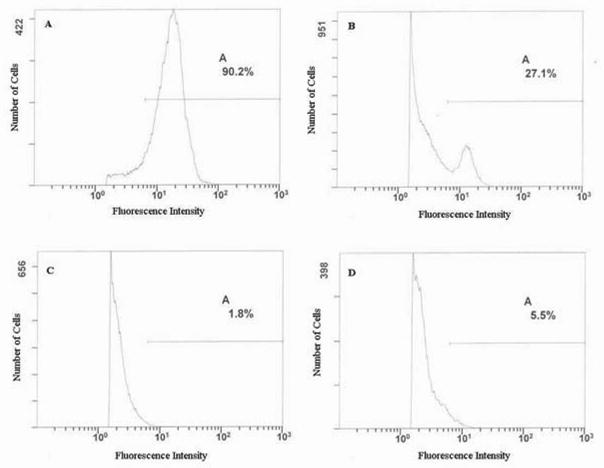
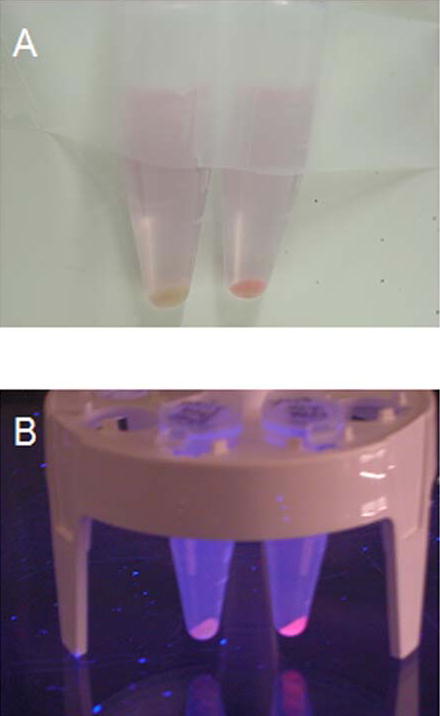
Photographs comparing E. coli cells expressing periplasmic MBP-R-PE alpha subunit fusion protein and control cells after incubation of cells with PEB chromophore. Vials from left to right contained the following cells incubated with PEB: 1. Control cells that were not induced for expression of periplasmic MBP-R-PE alpha subunit fusion, 2. Cells that were induced for expression of periplasmic MBP-R-PE alpha subunit fusion. A, Daylight colors of cells. Pink color of induced cells can be seen. B, Colors of cells under UV illumination. Orange fluorescence of induced cells can be seen. Results indicate formation of fluorescent fusion proteins that are pink in color and show orange fluorescence.
Attachment of PEB to MBP-R-PE apo-subunit fusion proteins in vivo
In an attempt to increase their solubility, R-PE apo-subunits were fused to both cytoplasmic and periplasmic variants of MBP forming fusion proteins with molecular weights of ~ 65 kDa. In contrast to our previous results, expression of fusions between cytoplasmic MBP and R-PE subunits produced high yields of soluble fusion proteins that were isolated in several fractions by affinity chromatography under native conditions. SDS-PAGE analysis of collected fractions confirmed that fusion proteins with molecular weight of ~ 65 kDa were found in both cells that were not incubated with PEB (Fig. 4A, lanes 1–4) and cells that were incubated with PEB ((Fig. 4A, lanes 6–10). As expected, fluorescent fusion proteins were isolated only from cells that were incubated with PEB in vivo (Fig. 4B, lanes 6–10). Isolated fluorescent subunits showed fluorescence excitation maximum at 577.5 nm and emission maximum at 584.0 nm (Fig. 5 and Table 2), indicating formation of PEB-containing fusion proteins. Cells containing fluorescent fusions were differentiated from control cells by pink color (Supplementary Fig. 3A) and intense fluorescence under UV illumination (Supplementary Fig. 3B). After induction, a heterogeneous population of bacterial cells, with both normal rod-shaped and elongated morphologies, was observed by DIC microscopy (Fig. 6A). The normal, rod-shaped cells, expressing periplasmic MBP-R-PE subunit fusion proteins displayed fluorescence throughout the cytoplasm (Fig. 6B). DIC microscopy did not reveal the presence of inclusion bodies in these cells. Elongated cells in the same population, showed fluorescence throughout cells as well as at cell poles revealing presence of both soluble fusion proteins located in the cytoplasm and insoluble fusion proteins located in inclusion bodies (Fig. 6B). These cells were brighter than the rod-shaped cells, as shown by fluorescence microscopy (Fig. 6B). Cytoplasmic MBP was fused to apo-subunits of R-PE and also yielded highly fluorescent proteins with heterogeneous morphologies. The presence of two subpopulations among cells containing periplasmic MBP fusions was also observed by flow cytometry indicating good correlation between single-cell microscopy and population-based flow cytometry analysis (Fig. 7). Flow cytometry also revealed that cells containing periplasmic MBP-alpha subunit fusions were up to 10 times brighter than control cells (Supplementary Table 2)
Figure 4.
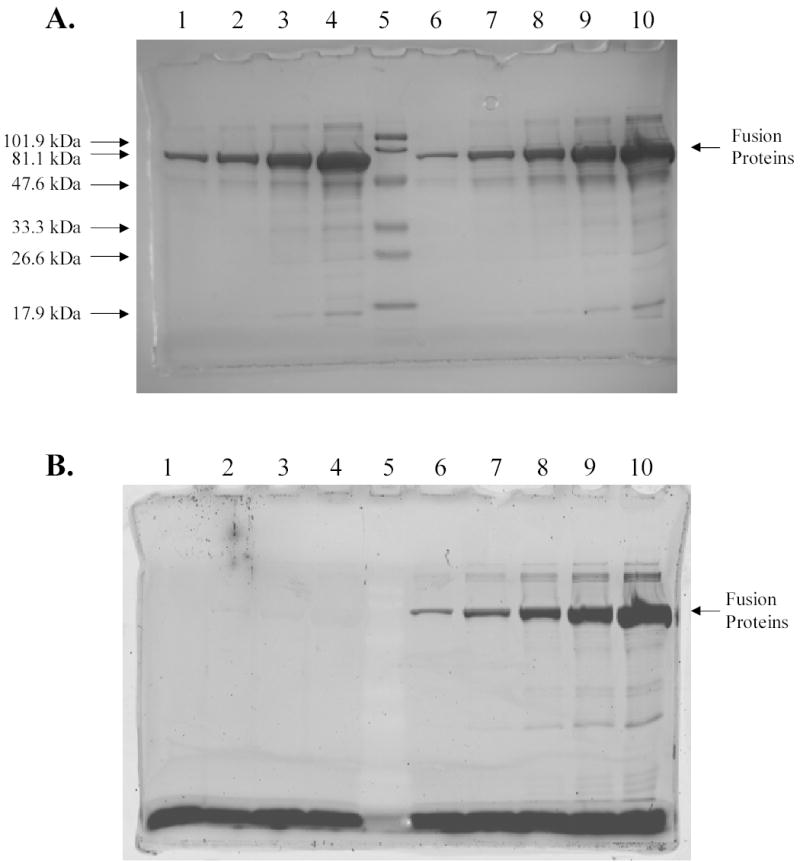
Analysis of fusion proteins between cytoplasmic MBP and R-PE apo-alpha subunit by SDS-PAGE. A, Detection of proteins by Coomassie staining. B, Detection of proteins by fluorescence imaging (excitation wavelength 532 nm; emission filter 580BP30). Lanes 1–4, the fourth, the third, the second, and the first purification fractions of MBP-R-PE alpha subunit fusions without PEB; lane 5, prestained MW standards, low range 18–106 kDa (Bio-Rad); lane 6–10, the fifth, the fourth, the third, the second, and the first purification fractions of MBP-R-PE alpha subunit fusions with PEB. Results show that MBP-R-PE fusion protein with molecular weight of ~ 65 kDa was successfully purified under native conditions. Fusion proteins isolated from cells incubated with PEB were fluorescent in contrast to fusion proteins isolated from cells that were not incubated with PEB. The highest amount of fusion proteins was found in the first elution fractions. The same conclusions were obtained after isolation of cytoplasmic MBP-R-PE beta subunit fusions.
Supplementary Figure 3.
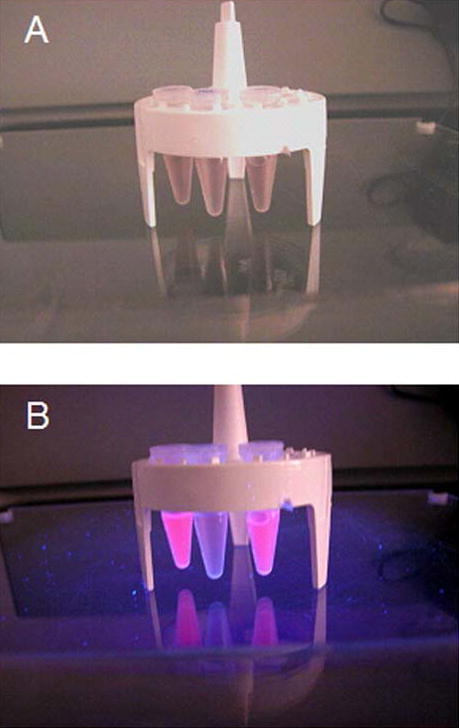
MBP-R-PE subunit solutions after attachment of PEB compared to solution of free PEB. Vials from left to right contained the following solutions: 1. cytoplasmic MBP-R-PE alpha subunit and PEB in maltose elution buffer, 2. PEB in maltose elution buffer. 3. cytoplasmic MBP-R-PE beta subunit fusion and PEB in maltose elution buffer, A, Daylight color of solutions. Solutions are pink in color due to the same color of free PEB and PEB bound to fusion proteins. B, Color of solutions under UV illumination. Orange fluorescence from solutions containing fluorescent subunit fusions is seen. These images demonstrate the large increase in fluorescence of PEB chromophore after attachment to soluble apo-subunit fusion proteins.
Figure 7.
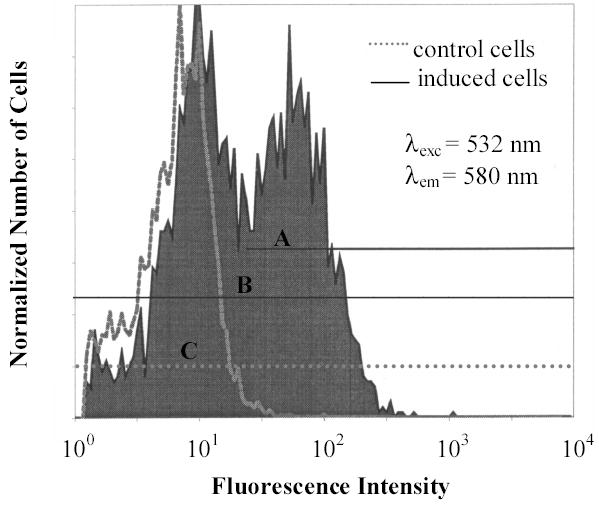
Fluorescence intensities of cells expressing periplasmic MBP-R-PE apo-alpha subunit fusion and control cells after incubation of cells with PEB. Numbers of cells shown on Y-axis were normalized for the purpose of graphical presentation. Fluorescence of cells was analyzed in regions A, B, and C. Region A corresponds to highly fluorescent induced cells, while regions B and C correspond respectively to all induced and control cells. The results show that cells containing periplasmic MBP-R-PE subunit fusions are much brighter than control cells. As in fluorescence microscopy, two subpopulations are noticed among induced cells corresponding to less bright cells that are normal in size and more bright elongated cells.
Supplementary Table 2.
Average fluorescence intensities of cells containing holo-subunits and control cells measured by flow cytometry. Fluorescence intensities of 10,000 cells were analyzed. All cells were incubated with PEB under the same conditions, but only αind and βind cells expressed apo-alpha and apo-beta subunits of R-PE, respectively. These cells had, on average, several times higher fluorescence compared to cells without expressed apo-subunits (αcon, βcon, BL21(DE3)).
| Cells | αind | αcon | βind | βcon | BL21(DE3) |
|---|---|---|---|---|---|
| If | 15.1 | 2.9 | 7.9 | 3.0 | 3.1 |
Attachment of PEB to MBP-R-PE apo-subunit fusion proteins in vitro
MBP-R-PE subunit fusions also bound PEB chromophore in vitro and formed highly fluorescent adducts. Fluorescence spectra of solution containing PEB showed the excitation maximum around 525 nm, the emission maximum at 579.0 and emission shoulder around 625 nm (Fig. 8A and Table 3). Solutions containing MBP-R-PE subunit fusions and PEB also showed an excitation maximum around 525 nm and another intensive excitation maximum at 574.5 nm (Fig. 8B and Table 3). Fluorescence emission spectrum of MBP-subunit fusions showed a peak at 585.5 nm and a shoulder around 625 nm (Fig. 8B and Table 3). These results confirmed that attachment of PEB to MBP-R-PE subunit fusions both in vitro and in vivo yielded fluorescent proteins that contained PEB chromophore with the excitation fluorescence maximum around 575 nm and emission fluorescence maximum around 585 nm. Although the same settings were used for fluorescence spectra measurement, the intensity of emission from MBP-subunit fusion (Fig. 8B) was much higher than in the case of PEB solution (Fig. 8B). While solutions of fluorescent fusion proteins and free chromophore had the same color (Supplementary Fig. 4A), the strong orange fluorescence of solutions containing subunit fusions was visualized while the fluorescence of solutions containing PEB was unnoticeable under UV illumination (Supplementary Fig. 4B), In this way, the large increase in fluorescence of PEB chromophore after attachment to soluble apo-subunit fusion proteins was demonstrated.
Figure 8.
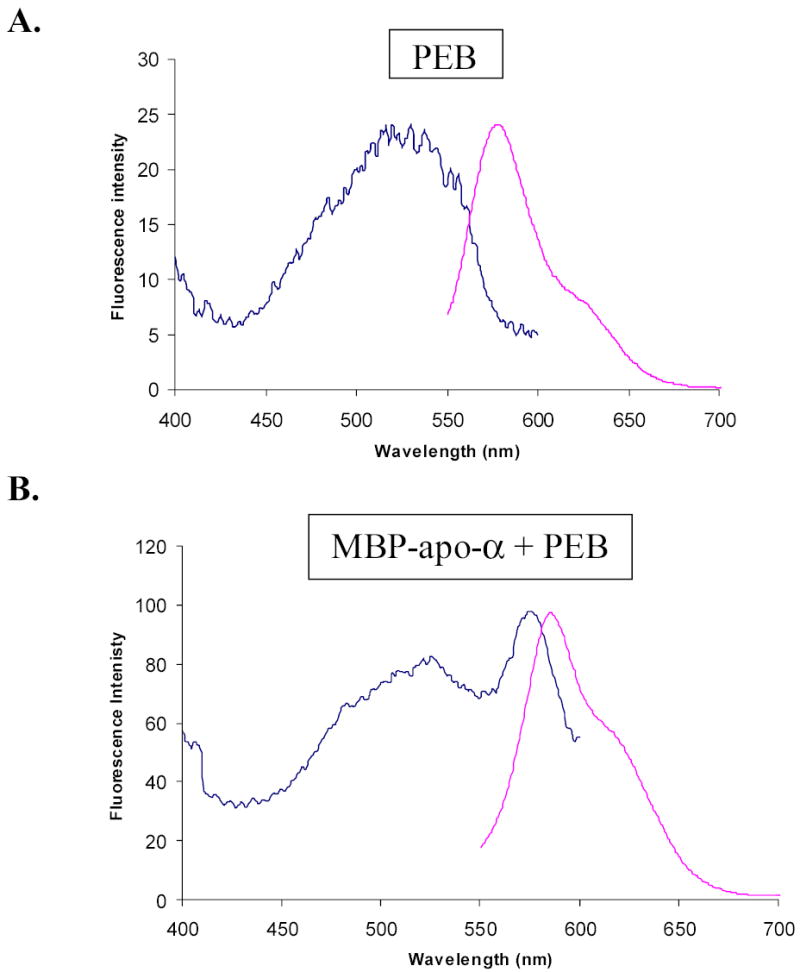
Normalized excitation and emission fluorescence spectra of PEB, and cytoplasmic MBP-alpha subunit fusion protein after attachment of PEB in vitro. Emission wavelength used to record excitation spectrum was 620 nm. Excitation wavelength used to record emission spectrum was 530 nm. Slit widths were 10 nm. Spectra were normalized by multiplication of fluorescence intensities in excitation spectra. A, Fluorescence spectra of PEB in maltose elution buffer. B, Fluorescence spectra of MBP-alpha subunit fusion in maltose elution buffer after attachment of PEB. Comparison of the spectra shows an excitation peak at 574.5 nm, which is characteristic for PEB attached to MBP-subunit fusions, and much higher fluorescence intensity of fluorescent fusions than fluorescence intensity of free PEB. The same conclusion was reached from fluorescence spectra of MBP-beta subunit fusions.
Table 3.
Excitation and emission fluorescence maxima of PEB, and MBP-R-PE apo-subunit fusion proteins after attachment of PEB in vitro. Spectra of free PEB and fusion proteins were recorded in maltose elution buffer by a fluorescence spectrometer (λexc = 530 nm, λem = 620 nm). From values of fluorescence maxima and shoulders (sh), and referenced literature, it was concluded that attachment of PEB to MBP-R-PE apo-subunit fusion proteins in vitro yields holo-subunits containing PEB.
| Phycobilin | Free PEB | Bound and Free PEB |
|---|---|---|
| Excitation fluorescence maximum (nm) | 528.0 | 576.0, 525.0 (sh), |
| Emisssion fluorescence maximum (nm) | 579.0, 625.0 (sh) | 586.5, 625.0 (sh) |
DISCUSSION
Here we report on the cloning and expression of fluorescent proteins that are formed by highly specific attachment of PEB to recombinant apo-subunits of R-PE and their fusions with MBP. Although R-phycoerythrin is highly fluorescent protein that has proven extremely useful in many bioanalytical applications, the large size of this 240-kDa trimeric protein restricts its use for labeling of cells and molecules. The cloning and expression of such a complex protein in cells, and its use as a fluorescent reporter in protein fusions would be problematic. Our approach to overcome these difficulties is to deal with individual R-PE subunits.
We cloned the apo-subunit genes of R-PE from red algae P. boldii into E. coli. Expression of R-PE alpha and beta apo-subunits in E. coli lead to the formation of inclusion bodies, insoluble aggregates that are made of partially folded or misfolded proteins [24–26]. Inclusion body formation also was observed after expression of C-PE alpha and beta apo-subunits in E. coli [19] consistent with the similar structures of C-PE and R-PE alpha and beta apo-subunits. The formation of inclusion bodies often yields nonfunctional proteins and causes a major problem for production of biologically active proteins. In vitro attachment of PEB chromophore did not work because inclusion bodies were soluble only in 8 M urea at pH 4, that is under conditions that were not favorable for chromophore attachment. Surprisingly, despite the localization of apo-subunits in inclusion bodies at the cell poles, fluorescent holo-subunits were formed after incubation of E. coli cells with PEB. PEB, which is a charged and partially hydrophilic compound with MW of 586.68 Da, was able to cross bacterial outer and inner membranes as well as cell wall and bind to R-PE apo-subunits [27]. Several analytical methods including SDS-PAGE, fluorescence spectroscopy, microscopy, and flow cytometry showed that PEB attached very specifically to apo-subunits of R-PE located in inclusion bodies and formed fluorescent holo-subunits [28]. Non-specific binding of PEB to other cellular structures was negligible since fluorescence of cells was only slightly higher than native fluorescence of cells.
Spectroscopic characterization of isolated holo-subunits showed that they contained not only PEB but also its isomer urobilin. Interestingly, incubation of cells containing apo-subunits with an urobilinoid chromophore also yielded holo-subunits containing both PEB and UB chromophores [29]. PEB and UB chromophores did not show binding specificity to R-PE apo-subunits characteristic for formation of holo-subunits in red algae since the spectral properties of holo-subunits are different than the spectroscopic properties of subunits of native R-PE. This is likely not only due to misfolding of subunits in inclusion bodies but also because the enzymes that are involved in chromophore attachment in red algae are missing in the E. coli expression system. Isomerization between PEB and UB chromophores might also be facilitated by the reducing environment of E. coli cytoplasm and by oxygen from air. PEB, UB and DBV adducts were detected after incubation of renatured C-PE alpha subunit with PEB in vitro [19]. We ruled out the presence of DBV in holo-subunits since its absorption maxima at 308 nm and 562 nm as well as fluorescence excitation and emission maxima at 592 nm and 605 nm [19, 30] were absent from the spectra.
Previously, inclusion bodies of cytoplasmic proteins have been observed in the cytoplasm, while inclusion bodies of secreted proteins were located in the cytoplasm as well as in the periplasm [31, 32]. Polar location of R-PE subunit inclusion bodies in bacterial cells was unambiguously confirmed by high-resolution and high-contrast images acquired by DIC and fluorescence microscopy. Inclusion bodies can be imaged with other transmission light microscopy techniques such as phase contrast if they are large in size [24, 33]. Otherwise they are observed by transmission electron microscopy (TEM) [31, 32]. A fluorescent reporter of inclusion bodies based on attachment of PEB to R-PE apo-subunits could be a less expensive and less time consuming alternative for TEM. Since 70 to 80 % of all recombinant proteins form inclusion bodies [34] such a fluorescent reporter could be a sensitive and selective marker of protein aggregation.
Fluorescent proteins were also formed after attachment of PEB chromophore to fusions of E. coli maltose binding protein (MBP) and R-PE apo-subunits in vitro and in vivo. Both cytoplasmic and periplasmic MBP formed fusions with apo-alpha and apo-beta subunits that were more soluble than native apo-subunits alone. Attachment of PEB to fusion proteins occurred without isomerization of the PEB chromophore and led to a significant increase in the brightness of the fluorophore. Fluorescence microscopy revealed that fusion proteins are localized either throughout cells or at cell poles, while expression was accompanied by morphological changes in cells containing high amount of overexpressed proteins. Morphological changes in cells are probably due to toxicity of fusion proteins. The use of the exported version of MBP also allowed us to explore the possibility of developing a fluorescent reporter for proteins localized to the periplasmic space. While GFP worked as reporter of protein export in the TAT secretion pathway, it did not work as reporter of protein transport in Sec pathway [35, 36]. Although a fluorescent reporter of protein localization that could function in the Sec export pathway would be valuable to answer important questions related to protein localization in bacteria, our results indicated that the MBP-R-PE subunit fusion proteins were not faithfully targeted to the periplasmic space. This result is consistent with the need for loosely folded proteins to successfully cross the bacterial cytoplasmic membrane via the Sec pathway.
Fluorescent subunits were successfully used in flow cytometry and fluorescence microscopy. They also show promise for use in photodynamic therapy of cancer [37, 38]. Possibilities are open for use of recombinant R-PE apo-subunits as reporters of gene expression and protein localization after incubation of cells with PEB chromophore. Valuable properties of R-PE apo-subunit fluorescent fusions include: broad excitation and emission fluorescence spectra, high fluorescence in the orange region of the electromagnetic spectrum (away from cellular autofluorescence), and functioning both in vitro and in vivo. The unique property of such a reporter is that it might work despite the way R-PE apo-subunits are folded. There is still much room for improvement of fluorescent properties of holo-subunits through mutagenesis and molecular evolution, as well as the attachment of other phycobilins. The need for exogenous supply of PEB chromophore could be overcome if the complete biosynthetic pathway for formation and attachment of PEB to apo-subunits of R-PE is expressed. Such a project would yield both to new and improved recombinant phycobiliproteins and reveal details of their biogenesis in nature.
Supplementary Material
Acknowledgments
We thank Hugo Scheer and Max Storf for the gift of PEB, Bob Doyle and Tracey Pepper for help with microscopy experiments, Shawn Rigby for work on flow cytometry experiments, and Slavica Isailovic for recording digital photos. E.S.Y. thanks the Robert Allen Wright Endowment for Excellence for support. Ames Laboratory is operated for the US Department of Energy by Iowa State University under Contract No. W-7405-Eng-82. This work was supported by the Director of Science, Office of Basic Energy Sciences, Division of Chemical Sciences.
References
- 1.Lakowicz JR. Principles of Fluorescence Spectroscopy. Plenum Press; New York: 1999. [Google Scholar]
- 2.Tsien RY. The green fluorescent protein. Annu Rev Biochem. 1998;67:509–544. doi: 10.1146/annurev.biochem.67.1.509. [DOI] [PubMed] [Google Scholar]
- 3.Zhang J, Campbell RE, Thing AY, Tsien RY. Creating new fluorescent probes for cell biology. Nat Rev Mol Cell Biol. 2002;3:906–918. doi: 10.1038/nrm976. [DOI] [PubMed] [Google Scholar]
- 4.Glazer AN, Stryer L. Phycofluor probes. Trends Biochem Soc. 1984;9:423–427. [Google Scholar]
- 5.Mullins JM. Phycobilliproteins. In: Javois LC, editor. Immunocytochemical Methods and Protocols, Methods in Molecular Biology 34. Humana Press; Totowa, NJ: 1994. pp. 112–113. [Google Scholar]
- 6.Zickendraht-Wendelstadt B, Friedrich J, Rudiger W. Spectral characterization of monomeric C-phycoerythrin from Pseudanabaena W 1173 and its α and β subunits: Energy transfer in isolated subunits and C-phycoerythrin. Photochem Photobiol. 1980;31:367–376. [Google Scholar]
- 7.Isailovic D, Li HW, Yeung ES. Isolation and characterization of R-phycoerythrin subunits and enzymatic digests. J Chromatogr A. 2004;1051:119–130. [PubMed] [Google Scholar]
- 8.Tooley AJ, Cai YA, Glazer AN. Biosynthesis of a fluorescent cyanobacterial C-phycocyanin holo-α subunit in a heterologous host. Proc Natl Acad Sci (USA) 2001;98:10560–10565. doi: 10.1073/pnas.181340998. [DOI] [PMC free article] [PubMed] [Google Scholar]
- 9.Tooley AJ, Glazer AN. Biosynthesis of the cyanobacterial light-harvesting polypeptide phycoerythrocyanin holo-α subunit in a heterologous host. J Bacteriol. 2002;184:4666–4671. doi: 10.1128/JB.184.17.4666-4671.2002. [DOI] [PMC free article] [PubMed] [Google Scholar]
- 10.Cai YA, Murphy JT, Wedemayer GJ, Glazer AN. Recombinant phycobiliproteins. Anal Biochem. 2001;290:186–204. doi: 10.1006/abio.2000.4979. [DOI] [PubMed] [Google Scholar]
- 11.Beale SI, Cornejo J. Biosynthesis of phycobilins: Ferredoxin-mediated reduction of biliverdin catalyzed by extracts of Cyanidium caldarium. J Biol Chem. 1991;266:22328–22332. [PubMed] [Google Scholar]
- 12.Beale SI, Cornejo J. Biosynthesis of phycobilins: 3(Z)-phycoerythrobilin and 3(Z)-phycocyanobilin are intermediates in the formation of 3(E)-phycocyanobilin from biliverdin IXα. J Biol Chem. 1991;266:22333–22340. [PubMed] [Google Scholar]
- 13.Beale SI, Cornejo J. Biosynthesis of phycobilins: 15, 16-dihydrobiliverdin IXα is a partially reduced intermediate in the formation of phycobilins from biliverdin IXα. J Biol Chem. 1991;266:22341–22345. [PubMed] [Google Scholar]
- 14.Schluchter MW, Glazer AN. Biosynthesis of phycobiliproteins in cyanobacteria. In: Peschek GA, Löffelhardt W, Schmetterer G, editors. The Phototrophic Prokaryotes. Kluwer Academic/Plenum Publishers, Kluwer Academic/Plenum Publishers; New York: 1999. pp. 83–95. [Google Scholar]
- 15.Storf M, Parbel A, Meyer M, Strohmann B, Scheer H, Deng M, Zheng M, Zhou M, Zhao K. Chromophore attachment to biliproteins: Specificity of PecE/PecF, a lyase-isomerase for the photoactive 31-Cys-α84-phycoviolobilin chromophore of phycoerythrocyanin. Biochemistry. 2001;40:12444–12456. doi: 10.1021/bi010776s. [DOI] [PubMed] [Google Scholar]
- 16.Arciero DM, Bryant DA, Glazer AN. In vitro attachment of bilins to apophycocyanin I. Specific covalent adduct formation at cysteinyl residues involved in phycocyanobilin binding in C-phycocyanin. J Biol Chem. 1988;263:18343–18349. [PubMed] [Google Scholar]
- 17.Arciero DM, Dallas JL, Glazer AN. In vitro attachment of bilins to apophycocyanin II. Determination of the structures of tryptic bilin peptides derived from the phycocyanobilin adduct. J Biol Chem. 1988;263:18350–18357. [PubMed] [Google Scholar]
- 18.Arciero DM, Dallas JL, Glazer AN. In vitro attachment of bilins to apophycocyanin III. Properties of the phycoerythrobilin adduct. J Biol Chem. 1988;263:18358–18363. [PubMed] [Google Scholar]
- 19.Fairchild CD, Glazer AN. Nonenzymatic bilin addition to the α subunit of an apophycoerythrin. J Biol Chem. 1994;269:28988–28996. [PubMed] [Google Scholar]
- 20.Murphy JT, Lagarias JC. The phytofluors: a new class of fluorescent protein probes. Curr Biol. 1997;7:870–876. doi: 10.1016/s0960-9822(06)00375-7. [DOI] [PubMed] [Google Scholar]
- 21.Kahn K, Mazel D, Houmard J, Tandeau de Marsac N, Schaefer MR. A role for cpeYZ in cyanobacterial phycoerythrin biosynthesis. J Bacteriol. 1997;179:998–1006. doi: 10.1128/jb.179.4.998-1006.1997. [DOI] [PMC free article] [PubMed] [Google Scholar]
- 22.Roell MK, Morse DE. Organization, expression and nucleotide sequence of the operon encoding R-phycoerythrin α and β subunits from the red alga Polysiphonia boldii. Plant Mol Biol. 1993;21:47–58. doi: 10.1007/BF00039617. [DOI] [PubMed] [Google Scholar]
- 23.Isailovic D, Li HW, Phillips GJ, Yeung ES. High-throughput single-cell fluorescence spectroscopy. Appl Spectrosc. 2005;59:221–226. doi: 10.1366/0003702053085124. [DOI] [PubMed] [Google Scholar]
- 24.Mitraki A, King J. Protein folding intermediates and inclusion body formation. Biotechnology. 1989;7:690–697. [Google Scholar]
- 25.Kane JF, Hartley DL. Formation of recombinant protein inclusion bodies in Escherichia coli. Trends in Biotechnology. 1988;6:95–101. [Google Scholar]
- 26.Villaverde A, Carrió MM. Protein aggregation in recombinant bacteria: biological role of inclusion bodies. Biotechnol Lett. 2003;25:1385–1395. doi: 10.1023/a:1025024104862. [DOI] [PubMed] [Google Scholar]
- 27.Chromophore transfer in the bacterial cell is a critical step disturbed by the structure of cell wall and efflux mechanisms present in the cell. Fortunately hydrophilic compounds with MW less than approximately 800 Da are delivered through outer bacterial membrane by protein channels embedded in the membrane (porins). PEB also crossed bacterial cell wall and inner membrane toward its way to the cytoplasm.
- 28.PEB attachment to apo-subunits in cells immediately after protein expression might be possible due to presence of partially folded intermediates in inclusion bodies. Attachment of PEB to apo-subunits in cells that were frozen was not possible. It seems maturation of inclusion bodies at low temperatures prevents the access of the chomophores to the cysteines responsible for chromophore binding. Previous studies and the fact that chromophore remained attached even after denaturing electrophoresis supports formation of thioether bonds between phycobilins and cysteine residues. Another scenario for chromophore binding might be its incorporation into inclusion body by inclusion, or binding as a ligand. Determination of chromophore binding sites would give the answers on these uncertainties.
- 29.PUB-like chromophore was isolated from B-phycoerythrin. In the case of incubation with this chromophore induced and control cells were washed, suspended in 5 ml of PBS buffer, incubated with 50 ml of 200 nM PUB solution in DMSO, and shaked overnight at 25 °C. Fluorescence spectra of isolated holosubunits showed the same maxima as in the case of attachment of PEB to apo-alpha subunit.
- 30.Wedemayer GJ, Kidd DG, Wemmer DE, Glazer AN. Phycobilins of cryptophycean algae. Occurrence of dihydrobiliverdin and mesobiliverdin in cryptomonad biliproteins. J Biol Chem. 1992;267:7315–7331. [PubMed] [Google Scholar]
- 31.Bowden GA, Paredes AM, Georgiou G. Structure and morphology of protein inclusion bodies in Escherichia coli. Biotechnology. 1991;9:725–730. doi: 10.1038/nbt0891-725. [DOI] [PubMed] [Google Scholar]
- 32.Sriubolmas N, Panbangred W, Sriurairatana S, Meevootisom V. Localization and characterization of inclusion bodies in recombinant Escherichia coli cells overproducing penicillin G acylase. Appl Microbiol Biotechnol. 1997;47:373–378. doi: 10.1007/s002530050943. [DOI] [PubMed] [Google Scholar]
- 33.Carrió MM, Corchero JL, Villaverde A. Dynamics of in vivo protein aggregation: building inclusion bodies in recombinant proteins. FEMS Microbiol Lett. 1998;169:9–15. doi: 10.1111/j.1574-6968.1998.tb13292.x. [DOI] [PubMed] [Google Scholar]
- 34.2003–2004 Applications Handbook and Catalog. Pierce Biotechnology, Inc.; Rockford, IL: Inclusion body solubilization reagent; p. 162. [Google Scholar]
- 35.Thomas JD, Daniel RA, Errington J, Robinson C. Export of active green fluorescent protein to the periplasm by the twin-arginine translocase (Tat) pathway in Escherichia coli. Mol Microbiol. 2001;39:47–53. doi: 10.1046/j.1365-2958.2001.02253.x. [DOI] [PubMed] [Google Scholar]
- 36.Feilmeier BJ, Iseminger G, Schroeder D, Webber H, Phillips GJ. Green fluorescent protein functions as a reporter for protein localization in Escherichia coli. J Bacteriol. 2000;182:4068–4076. doi: 10.1128/jb.182.14.4068-4076.2000. [DOI] [PMC free article] [PubMed] [Google Scholar]
- 37.Huang B, Wang GC, Zeng CK, Li ZG. The experimental research of R-phycoerythrin on cancer treatment: a new photosensitizer in PDT. Cancer Biother Radio. 2002;17:35–42. doi: 10.1089/10849780252824055. [DOI] [PubMed] [Google Scholar]
- 38.Photodynamic therapy relates on treatment of cancer cells by combination of chemical photo-sensitization and light radiation that are in combination lethal to cells. Photosensitizers should have good absorption properties with multiple peaks in the visible region, be well absorbed by cells, and show low phototoxicity. Huang et al [37] have shown that R-phycoerythrin subunits isolated from red algae can be used as photosensitizer in PDT of carcinoma cells. Since PEB shows low phototoxicity and could be absorbed by cells, holo-subunits formed after attachment of PEB or other phycobilins to genetically expressed apo-subunits in a target organ could be potential candidates for photosensitizers.
Associated Data
This section collects any data citations, data availability statements, or supplementary materials included in this article.


