Abstract
The annual cycle of phytoplankton cell abundance is coherent across diverse ecosystems in the temperate North Atlantic Ocean. In Bedford Basin, on the Scotian Shelf and in the Labrador Sea, the numerical abundance of phytoplankton is low in spring and high in autumn, thus in phase with the temperature cycle. Temperature aligns abundance on a common basis, effectively adjusting apparent cell discrepancies in waters that are colder or warmer than the regional norm. As an example of holistic simplicity arising from underlying complexity, the variance in a community variable (total abundance) is explained by a single predictor (temperature) to the extent of 75% in the marginal seas. In the estuarine basin, weekly averages of phytoplankton and temperature computed from a 13 year time-series yield a predictive relationship with 91% explained variance. Temperature-directed assembly of individual phytoplankton cells to form communities is statistically robust, consistent with observed biomass changes, amenable to theoretical analysis, and a sentinel for long-term change. Since cell abundance is a community property in the same units for all marine microbes at any trophic level and at any phylogenetic position, it promises to integrate biological oceanography into general ecology and evolution.
Keywords: annual cycle, climate, macroecology, monitoring, phytoplankton, temperature
1. Introduction
The study of the annual cycle of phytoplankton was a strong impetus for the birth of biological oceanography in the early twentieth century (Mills 1989). In temperate waters of the North Atlantic, the sequence of events recurs so regularly that it is regarded as the canonical pattern (Longhurst 1995). In spring, a bloom is induced when the nutrient-rich water column is stabilized; in summer, phytoplankton are maintained at lower levels by regenerated nutrients; in autumn, a secondary bloom is fuelled by nutrients brought upwards as water column stability is eroded; in winter, phytoplankton are at a minimum as the water is completely mixed and solar radiation is at its lowest level.
Despite considerable understanding of the phytoplankton cycle, other perspectives remain to be discovered, especially in relation to contemporary ecological theory and to applied problems. For example, a long-standing hypothesis in fisheries science that links the timing of the spring phytoplankton bloom to the survival of larval fish has only recently been confirmed (Platt et al. 2003).
In this paper, we address another issue of significance to both theory and practical concern, namely whether there is any strong rule by which entire phytoplankton communities are assembled from diverse constituent organisms. This is far from a new question (Reynolds 2001), but we present new insight from strong empirical evidence. Specifically, we ask whether the annual cycle of total cell abundance is coherent across contrasting temperate ocean ecosystems. It is well understood that cells of different kinds and sizes undergo population succession over the course of a year. For example, there is usually a progression from diatoms in spring, to phytoflagellates in summer, and to dinoflagellates in autumn. Total cell abundance, without explicit regard for taxonomic identity or individual size, therefore represents an expression of the community in the currency of the autonomous self-replicating unit upon which evolutionary and ecological forces act. ‘The individual is where the gene meets the environment, and hence the individual is the primary unit of selection’ (Levin et al. 2001, p. 178). We examine whether the collective behaviour of many different individuals gives rise to a robust annual cycle of abundance at the higher hierarchical level of the community. The results can be viewed as an example of apparent simplicity generated by underlying complexity, and portend implications for climate change monitoring.
2. Study sites
A network of ecosystem monitoring sites is maintained in the northwest Atlantic Ocean by the Canadian Department of Fisheries and Oceans (see station map in Li et al. 2006). Three contrasting regions were chosen for study: Bedford Basin, the Scotian Shelf and the Labrador Sea. These waters belong to a single large-scale physical regime influenced predominantly by a coastal current system that is part of the subpolar gyre, but there are important regional variations (Loder et al. 1998).
Bedford Basin in Nova Scotia is the inner portion of Halifax Harbour, surrounded by an urban population of 350 000. The Basin has a surface area of only 17 km2 but is connected to the open Atlantic Ocean by a channel with a shallow sill. Water exchange between the Basin and the adjacent Scotian Shelf is a result of alongshore winds driving Ekman transport. The Compass Buoy station (44.69° N, 63.64° W) in the Basin has been sampled weekly since 1992 (Li & Dickie 2001).
The Scotian Shelf is the continental shelf off Nova Scotia. Although entirely within the Northwest Atlantic Shelves Province (Longhurst 1998), this region is topographically, hydrodynamically and biologically complex. Three distinct sub-regions can be recognized: the central Scotian Shelf (CSS), the eastern Scotian Shelf (ESS) and the western Scotian Shelf (WSS). Since 1997, sampling has been conducted every spring (April or May) and every autumn (October) along the Halifax Line (HL) in CSS, along the Browns Bank Line (BBL) in WSS and along the Louisbourg Line (LL) in ESS. These transects are all approximately normal to the major axis of the shelf, and each comprises seven stations distributed cross-shelf (Therriault et al. 1998). Although there is substantial inter-station variability, we represent each sub-region by values averaged over the entire transect. At station 2 of the HL (44.27° N, 63.32° W), there is supplementary sampling once every two weeks in order to delineate higher frequency events.
The Labrador Sea is part of the North Atlantic subpolar gyre system. It consists of three distinct sub-regions: the central deep Labrador Basin (LB), the Labrador Shelf (LS) and the Greenland Shelf (GS). Ice conditions permitting, this region is sampled every spring or early summer (May–July) on 28 stations along the AR7W line (Lazier et al. 2002) from Hamilton Bank (Labrador) to Cape Desolation (Greenland). Here again, there is substantial inter-station variability across the entire transect, and we represent each sub-region by values averaged over the appropriate hydrographic stations.
3. Material and methods
Methods for sampling and analyses have been described in detail elsewhere (Li & Dickie 2001; Li & Harrison 2001; Mitchell et al. 2002). Briefly, seawater samples are collected from Niskin bottles mounted in rosette fashion and deployed in conjunction with a temperature profiling CTD system. Phytoplankton are fixed in 1% paraformaldehyde, quick frozen in liquid nitrogen, and stored at −80 °C. From these samples, picophytoplankton (<2 μm) and nanophytoplankton (2–20 μm) are enumerated by flow cytometry using a red fluorescence threshold. Microphytoplankton (>20 μm) are fixed in acid Lugol's solution and settled in Utermöhl chambers. From these samples, diatom and dinoflagellate cells are enumerated by phase contrast microscopy. Particulate chlorophyll is vacuum-filtered onto a glass fibre filter, extracted in acetone and analysed by fluorometry. Although the entire photic zone is sampled in our monitoring programs, we obviate depth-related confounding by restricting analysis to the surface layer: 5 m in Bedford Basin and less than 10 m everywhere else.
To examine trends of temperature change on the Scotian Shelf and Labrador Sea where the frequency of sampling by ship is low, we used sea surface temperature composited on a semi-monthly basis from advanced very high resolution radiometer (AVHRR) satellite instrumentation of NOAA. Image products generated by this analysis at the Bedford Institute of Oceanography are freely available (http://www.mar.dfo-mpo.gc.ca/science/ocean/ias/remotesensing.html).
4. Results
(a) Time-series observations
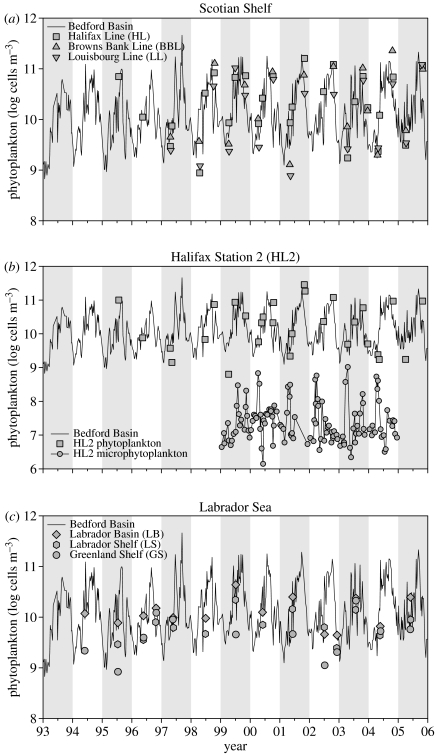
In Bedford Basin, the 13-year weekly time-series of phytoplankton shows a repeating annual cycle with strong variability at high frequencies (figure 1). Cell abundance ranges from a minimum of order 109 cells m−3 in winter to a maximum of order 1011 cells m−3 at the autumnal equinox.
Figure 1.
Multiyear time-series of phytoplankton abundance in Bedford Basin (line) compared to other sites. (a) Scotian Shelf central, western and eastern sub-regions: Halifax Line (squares), Browns Bank Line (triangles), Louisbourg Line (inverted triangles). (b) Station 2 of Halifax Line. Phytoplankton counted by flow cytometry (squares), microphytoplankton counted by microscopy (circles). (c) Labrador Sea sub-regions: central Labrador Basin (diamonds), Labrador Shelf (hexagons), Greenland Shelf (circles).
On the Scotian Shelf, where data are generally available only from cruises made twice a year, cell abundance is consistently low in spring and high in autumn, as it is in Bedford Basin. On a time-series plot (figure 1a), the low-frequency shelf measurements generally overlie the high-frequency Basin measurements, indicating that at a given time of year, abundance everywhere is in the same range. However, there is low bias in spring at LL and high bias in autumn at BBL and HL.
At shelf station HL2, semi-monthly counts of microphytoplankton have been made since 1999. Here, the alternation between spring diatoms and autumn dinoflagellates is as expected, although both are present throughout the year. The flow cytometric counts of phytoplankton at HL2 are well-matched to those in Bedford Basin, and these cells are more abundant than the microphytoplankton by about 700-fold on average (figure 1b).
In the Labrador Sea, sampling frequency is very low. Nevertheless, it is evident that at a given time of year, there is overlap in the abundance of subpolar and Bedford Basin phytoplankton (figure 1c), except on the GS where cell abundance is consistently lower than elsewhere.
(b) Annual cycle
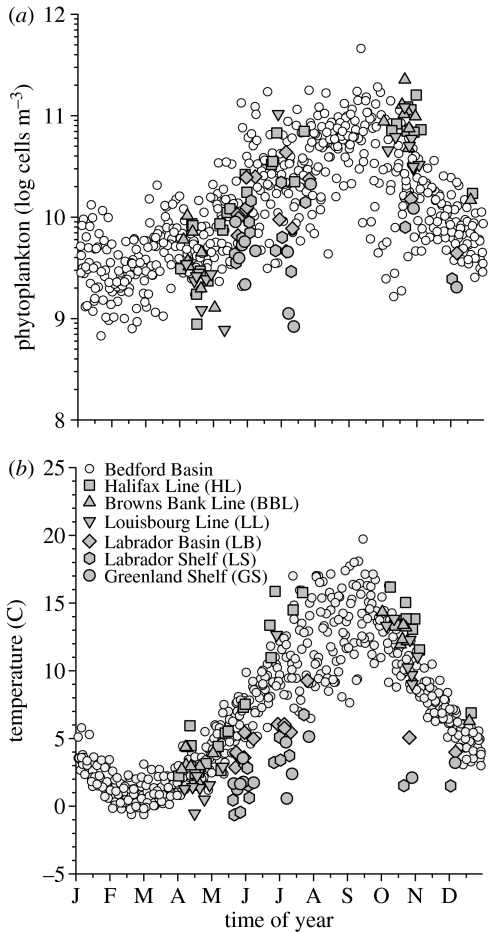
The climatological cycle of phytoplankton constructed from the Bedford Basin time-series (figure 2a) indicates a sustained increase of abundance from a minimum in week 6 to a maximum in week 37. The specific rate of net apparent change (growth minus loss) over this 217-day interval is 0.017 d−1, equivalent to a net doubling time of about 41 days. The decrease over autumn and winter occurs more rapidly at a specific rate of −0.025 d−1, equivalent to a net halving time of 28 days. The climatological cycle of seawater temperature is phased very closely to phytoplankton: a minimum on week 8 and a maximum coinciding on week 37 (figure 2b).
Figure 2.
Multiyear annual cycle of: (a) phytoplankton abundance, (b) temperature. Bedford Basin (open circles) compared to other sites (filled symbols coded as in figure 1).
A comparison of Scotian Shelf and Labrador Sea data with the annual cycle in Bedford Basin (figure 2a) emphasizes the general coherence of phytoplankton seasonality. It is noteworthy that the circumstances (place and time) under which offshore phytoplankton show the most conspicuous departures from Basin climatology (figure 2a) are the same circumstances of temperature departures (figure 2b). For example, low values in GS and LL in the spring; high values in HL in the autumn.
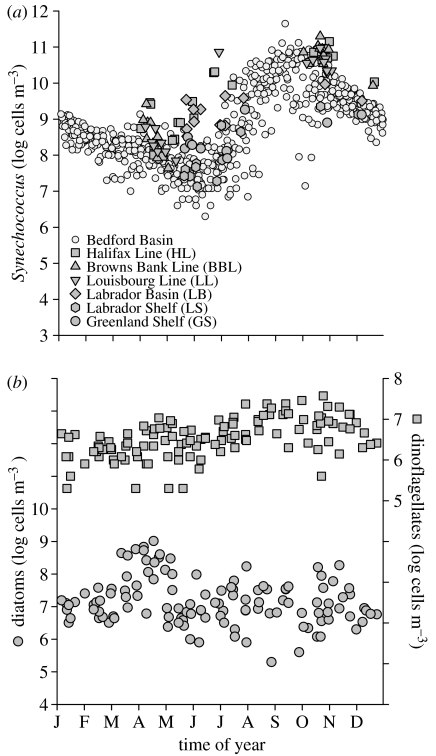
The annual cycle of the phytoplankton community as a whole (figure 2a) differs from those of constituent groups that we monitor. The cyanobacterium Synechococcus ranges over four orders of magnitude and has a distinct minimum in early June (figure 3a). Diatoms are most abundant in April (figure 3b) and dinoflagellates most abundant in October (figure 3b). The annual average abundances of total phytoplankton, Synechococcus, diatoms and dinoflagellates are 25 000, 7080, 64 and 7×10⁶ cells m−3, respectively; thus in the ratio 3726 : 1055 : 10 : 1. Although a substantial percentage of the community can be ascribed to Synechococcus and diatoms when these attain their respective annual maxima, the annual phytoplankton cycle has not been fully taxonomically resolved in our studies.
Figure 3.
Multiyear annual cycle of: (a) Synechococcus, (b) diatoms (left ordinate) and dinoflagellates (right ordinate). Symbols for Synechococcus are coded as in figure 2. Diatoms and dinoflagellates are from Halifax Station 2.
(c) Phytoplankton abundance and temperature
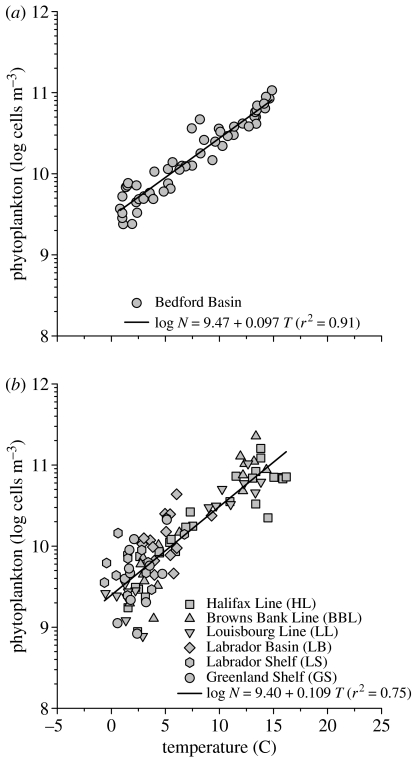
The striking similarities in the annual cycles of cell abundance (figure 2a) and temperature (figure 2b) lead to the rule of community assembly that we seek. In Bedford Basin, the linear relationship between abundance (log N, cells m−3) and temperature (T, °C), based on 53 weekly average values for the 13-year period (figure 4a) is highly significant (F=520, p<0.001) and explains 91% of the variance. The combined phytoplankton data from the Scotian Shelf and Labrador Sea (figure 4b) are also strongly related to temperature (F=286, p<0.001), and regression explains 75% of the variance. Analysis of covariance indicates that different regions do not differ in adjusted means (F=0.07, p=0.79) nor in slopes (F=1.7, p=0.19). The consolidated relationship for all regions is: log N=9.42+0.10T. Temperature, as the independent variable, aligns abundance on a common basis, effectively adjusting apparent cell discrepancies in waters that are colder than elsewhere in spring (e.g. GS and LL).
Figure 4.
Relationship between phytoplankton abundance and temperature. (a) Bedford Basin, each of the 53 points is the arithmetic average of all data for a given week from all years 1993–2005. log N=9.47+0.097T. (b) Scotian Shelf and Labrador Sea, symbols coded as in figure 1. log N=9.40+0.109T.
Our finding can be stated as follows. In the temperate northwestern Atlantic Ocean, starting with 2.6×10⁹ cells m−3 at 0 °C, a temperature change of 1 °C leads to a 27% change in phytoplankton abundance in the same direction. This rule, which explains 79% of the variance, is based on averaging data over many years.
(d) Multiyear trends
On a year-to-year basis, the relationship between log N and T is less robust than the rule derived from climatological averaging. For example, in Bedford Basin, although the regression between single time point measurements of these variables is highly significant (F=540, p<0.001, n=473), the percentage of explained variance is reduced to 53%. Thus, there is considerable scope for phytoplankton change to be uncoupled from temperature change.
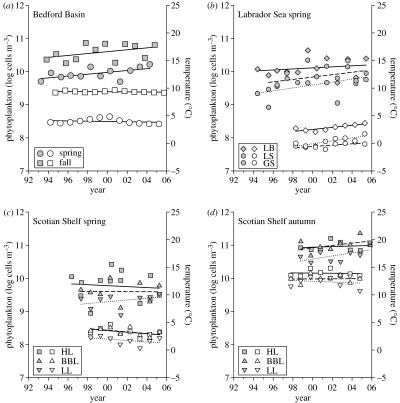
On a seasonal basis (spring and autumn), both temperature and phytoplankton have generally not changed perceptibly (p>0.1) in Bedford Basin and the Scotian Shelf (figure 5). The single exception is the significant increase (6.6% yr−1, F=5.4, p=0.04, n=12) in springtime phytoplankton of Bedford Basin.
Figure 5.
Multiyear seasonal trends in temperature (open symbols) and phytoplankton abundance (filled symbols). (a) Bedford Basin. Spring (circles), fall (squares). (b) Labrador Sea in spring. Symbol coded as in figure 1c. (c) Scotian Shelf in spring. Symbols coded as in figure 1a. (d) Scotian Shelf in autumn. Symbols coded as in figure 1a. All lines are ordinary least squares regression.
It is only in the Labrador Sea that a clear multiyear trend emerges (figure 5b). Springtime temperature is increasing (0.19±0.07 °C yr−1), and so also is phytoplankton abundance (7.7±3.5% yr−1). Ancova indicates similar rates of increase in the three sub-regions LB, LS and GS (F=1.36, p=0.28 for temperature; F=0.31, p=0.74 for phytoplankton), but different adjusted means (F=138, p<0.001 for temperature; F=7.63, p<0.01 for phytoplankton), with LB being both warmest and most abundant in cells. For the Labrador Sea as a whole, log N=6.80+0.031t (F=2.7, p=0.11, n=32), where t is the number of years since 1900. Thus, over the period of observation from 1994 to 2005, log cell abundance has increased from 9.68 to 10.02, or more than twofold in untransformed numbers.
5. Discussion
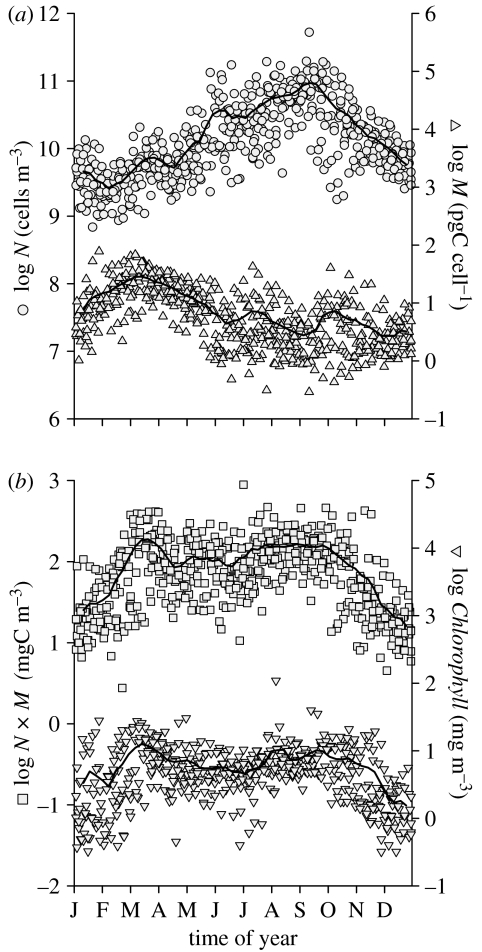
The phenomenological features of the annual cycle of phytoplankton in the temperate North Atlantic Ocean are so familiar that they constitute a part of the biological oceanography canon. It is a perspective derived largely when phytoplankton assemblages are registered in units of total biomass, W (mg C m−3). Operationally, this quantity is usually taken by proxy from pigment concentration estimated by colorimetry (e.g. Harvey Plant Pigment Units, Continuous Plankton Recorder green index), by analytical chemistry (e.g. chlorophyll concentration) or by visible spectral radiometry (e.g. satellite ocean colour). An alternative perspective is to assemble diverse taxa, forming a community of many individual cells, N=Σni (cells m−3), where n is the abundance of cell group i. The two views (W and N) are related, but cannot be derived one from the other without knowing M, the average mass of the cell assemblage (mg C cell−1). Thus W=N×M, indicating that a bloom may consist of a small number of large cells, a large number of small cells or even a moderate number of intermediate-sized cells.
In phytoplankton ecology, N is seldom recorded because of the difficulties of comprehensive accounting by light microscopy. Instead, ni is obtained only for the more easily visible and recognizable forms, which are generally microplankton taxa such as Bacillariophyceae (diatoms) and Dinophyceae (dinoflagellates). Since these cells are large, their weighted contribution to W is also large. For this reason, annual cycles of microphytoplankton abundance often mimic those of chlorophyll concentration. However, in accordance with a universal decrease in abundance with body size (Peters 1983), the numerical majority of phytoplankon is found in the smaller-sized categories of picoplankton and nanoplankton (Li 2002). Total cell abundance provides a new perspective on the annual phytoplankton cycle, and can be shown to be consistent with the conventional view through consideration of M.
In Bedford Basin, the annual cycles of N and M are approximate mirror images of each other. In early spring when N is low, M is high. Conversely, in late summer when N is high, M is low (figure 6a). Their product W can be compared to the independent measure of chlorophyll concentration (Chl) since both are indices of phytoplankton biomass (figure 6b). The stereotypic annual sequence is evident in both W and Chl: a short bloom in spring and an extended bloom in autumn. We therefore conclude that N is an elementary quantity in phytoplankton ecology from which other useful quantities can be derived. The annual cycle of N is different from that of Chl, but they are demonstrably consistent with each other. N has the property, not shared by Chl, of being in the same units for all marine microbes at any trophic level and at any phylogenetic position. This facilitates the integration of biological oceanography into general ecology and evolution, an important thrust in placing marine microbial diversity in the context of Earth's habitability (Hunter-Cevera et al. 2005).
Figure 6.
Multiyear annual cycle in Bedford Basin. (a) Phytoplankton abundance, N (circles, left ordinate); average cell mass, M (triangles, right ordinate). (b) Phytoplankton biomass, N×M (squares, left ordinate); particulate chlorophyll concentration, Chl (inverted triangles, right ordinate). Solid lines are three-point running means of data binned by week number and averaged over all years of observation.
A recent theory (Allen et al. 2002) posits that for species i of abundance Ni and metabolic rate Bi, the total energy flux of the population, BT=NiBi=NiboMi3/4e−E/kT where bo is a normalization constant, E is activation energy of metabolism, and k is the Boltzmann constant. This is a statement of the energetic–equivalence rule, the three-quarter power allometric scaling of metabolism, and the thermal activation kinetics of ectotherms (Brown et al. 2004). From this, a plot of versus T−1 yields a straight line of positive slope E/k, given the condition that ln(BT/bo) is constant (Allen et al. 2002). The quantity NiMi3/4, termed the ‘mass-corrected abundance’, is used to scale different species so that a common relationship to temperature is emphasized. In form, mass-corrected abundance appears close to W, differing only in that mass is scaled to three-quarters in the former and to one in the latter. Because of this similarity, it can be anticipated that our phytoplankton data would not yield a positive slope on the Arrhenius-like plot of Allen et al. (2002). At both the lowest and highest temperatures of the year (weeks 8 and 37, respectively), W is equally high (figure 6b). In fact, regression of actual data indicates a negative slope of 7437 K−1 (F=161, p<0.001, n=505, r2=0.24), reflecting low biomass in winter.
The metabolic theory is formulated for steady state, where each environment is characterized by a mean rate of resource supply, a mean temperature and unchanging population size. Thus, Kaspari (2004) points out that seasonality becomes a complicating factor in the straightforward application of the theory. Our study is explicitly seasonal in nature, with none of the steady state conditions holding true. The effects of cell size and temperature on metabolic rate are suitably described by metabolic theory for unicellular algae in laboratory clonal cultures (Gillooly et al. 2001), where the two variables are largely independent of each other. This is not the case in the ocean. As temperature varies over the annual cycle (figure 2b), so too does the average cell size of the mixed assemblage (figure 6a) because of changing proportions of different kinds of cells (figure 3). Metabolic theory might be extended to include interacting effects but this is beyond the scope of our present investigation.
The phenomenological relationship between log N and T (figure 4) is surprisingly robust. The three study regions are distinctly different in atmospheric climatology, in physical oceanography, in nutrient loading and even in Chl seasonality. Yet, there is no statistical difference in the average numbers of phytoplankton cells present at a particular temperature. The abundance of phytoplankton observed at any time and place is the net result of growth and loss. Intrinsically, each cell contains genetic instructions for setting a pace of life determined by binary fission and automortality. Extrinsically, each cell is influenced by nutrient supply, photon supply, grazing, lytic infection, allelopathy and sinking. It appears to be a striking example of apparent simplicity arising from underlying complexity when the variance in a community variable (N) is explained by a single predictor (T) to the extent of 91% in a small basin (figure 4a) and 75% in entire marginal seas (figure 4b). The seasonal transition from one kind of cell (e.g. diatom) to another (e.g. cyanobacterium) appears seamless, and the emergent pattern then becomes ataxonomic. Both metabolism and hydrodynamics are sensitive to temperature, but the proximate mechanism remains to be elucidated. At a broader geographic scale, comparative analysis across ecosystems indicates that temperature is a suitable proxy for physical processes acting to influence the community composition and primary production of marine phytoplankton (Bouman et al. 2003, 2005). The pattern we have discerned (figure 4) is not universal since maximum recorded abundance in tropical and sub-tropical waters (Partensky et al. 1999; Li 2002) is lower than predicted by extrapolation from measurements in the temperate range.
Long-term temperature change in ocean waters associated with climate trends has been shown to affect phytoplankton abundance (Richardson & Schoeman 2004), phenology (Edwards & Richardson 2004) and shifts in taxonomic composition (Leterme et al. 2005). Such changes can be propagated to higher levels of the food web (Richardson & Schoeman 2004). In other cases, observed changes in phytoplankton have been ascribed to effects that cascade down from higher trophic levels (Frank et al. 2005). In either case, an empirical rule to estimate possible change is of practical use. In the Labrador Sea, there has been a warming trend since the mid 1990s due to milder winter weather. As a result, heat loss from the sea surface is less than horizontal heat flux and convection is less intense (Lazier et al. 2002). The AVHRR spring temperature record for surface waters in the entire Labrador Sea (LB, LS, GS) indicates an increase of 1.33 °C from 1998 to 2005 (figure 5b). To hindcast the associated phytoplankton increase, we use the Bedford Basin relationship (figure 4a) because the more general rule already contains Labrador Sea data. A phytoplankton increase of 38% is imputed by the temperature change. This compares to a change of 64% ascribed by the regression of measured values (figure 5b). The prediction is reasonable considering the macroecological nature of the analysis, but also highlights the scope for additional variance not explained by temperature alone. The latter are important since absolute changes in temperature are very small in climate analyses. A weak temperature trend in one direction may in fact be masked by a stronger influence on phytoplankton, resulting in a net trend in the opposite direction. This may be a plausible description of Bedford Basin (figure 5a), where phytoplanktons are increasing in the face of a very weak temperature decrease. Here, the influence of anthropogenic nutrient loading may be a significant factor.
Under global warming scenarios, the Canadian Arctic is likely to sustain further temperature increase (IPCC 2001). The Labrador Sea is in close proximity: LB is located within the Atlantic Arctic Province, and both LS and GS are located within the Boreal Polar Province (Longhurst 1998). The ecosystem implication of a long-term change in phytoplankton N must be sought in conjunction with W, or through its proxy Chl. If changes in N and W are disproportionate, then M can be inferred to be changing as well. Pelagic food webs in which phytoplankton are of low average M tend to be sustained by regenerated production, where a large fraction of energy loops through microbial components. Conversely, food webs in which phytoplankton are of high average M have a greater potential to transfer primary production to higher trophic levels, including fish (Cullen et al. 2002). In the Labrador Sea, the trends of increasing N (figure 5b) are accompanied by trends of decreasing Chl in LB and LS (Li et al. 2006). The implied decrease in M may presage a possible change in energy flow through the pelagic food webs in these sub-regions. However, the existing size structure of phytoplankton biomass is heavily weighted to the microplankton. The likelihood of detecting ecosystem change will have to be assessed by modelling.
Ecosystem monitoring is used by public agencies to formulate rules to manage environmental risk. There are very few such rules that are not idiosyncratic. Depending on the scales at which the problems are to be considered, the macroecological approach may be helpful. Temperature-directed assembly of phytoplankton in communities is statistically robust, is consistent with the canon of biological oceanography, is amenable to theoretical analysis and is a sentinel for system-wide long-term change.
Acknowledgments
We thank J. Anning, J. Bugden, C. Caverhill, P. Dickie, L. Harris, E. Horne, H. Maass, K. Pauley, T. Perry, C. Porter and J. Spry for technical assistance, and A. Vézina for comments on the manuscript. Supported by the Program of Energy Research and Development, the Department of Fisheries and Oceans Strategic Science Fund in the Ocean Climate Program and the Atlantic Zone Monitoring Program.
References
- Allen A.P, Brown J.H, Gillooly J.F. Global biodiversity, biochemical kinetics, and the energetic–equivalence rule. Science. 2002;297:1545–1548. doi: 10.1126/science.1072380. 10.1126/science.1072380 [DOI] [PubMed] [Google Scholar]
- Bouman H.A, et al. Temperature as indicator of optical properties and community structure of marine phytoplankton: implications for remote sensing. Mar. Ecol. Prog. Ser. 2003;258:19–30. [Google Scholar]
- Bouman H, Platt T, Sathyendranath S, Stuart V. Dependence of light-saturated photosynthesis on temperature and community structure. Deep-Sea Res. I. 2005;52:1284–1299. 10.1016/j.dsr.2005.01.008 [Google Scholar]
- Brown J.H, Gillooly J.F, Allen A.P, Savage V.M, West G.B. Toward a metabolic theory of ecology. Ecology. 2004;85:1771–1789. [Google Scholar]
- Cullen J.J, Franks P.J.S, Karl D.M, Longhurst A. Physical influences of marine ecosystem dynamics. In: Robinson A.R, McCarthy J.J, Rothschild B.J, editors. The sea, vol. 12. Wiley; New York, NY: 2002. pp. 297–336. [Google Scholar]
- Edwards M, Richardson A.J. Impact of climate change on marine pelagic phenology and trophic mismatch. Nature. 2004;430:881–884. doi: 10.1038/nature02808. 10.1038/nature02808 [DOI] [PubMed] [Google Scholar]
- Frank K.T, Petrie B, Choi J.S, Leggett W.C. Trophic cascades in a formerly cod-dominated ecosystem. Science. 2005;308:1621–1623. doi: 10.1126/science.1113075. 10.1126/science.1113075 [DOI] [PubMed] [Google Scholar]
- Gillooly J.F, Brown J.H, West G.B, Savage V.M, Charnov E.L. Effects of size and temperature on metabolic rate. Science. 2001;293:2248–2251. doi: 10.1126/science.1061967. 10.1126/science.1061967 [DOI] [PubMed] [Google Scholar]
- Hunter-Cevera J, Karl D, Buckley M. American Academy of Microbiology Colloquium Report; Washington, DC: 2005. Marine microbial diversity: the key to earth's habitability. [PubMed] [Google Scholar]
- IPCC . Climate change 2001: the scientific basis. In: Houghton J.T, Ding Y, Griggs D.J, Nonguer M, van der Linden P.J, Dai X, Maskell K, Johnson C.A, editors. Contribution of working group I to the third assessment report of the intergovernmental panel on climate change. Cambridge University Press; Cambridge, UK: 2001. pp. 1–83. [Google Scholar]
- Kaspari M. Using the metabolic theory of ecology to predict global patterns of abundance. Ecology. 2004;85:1800–1802. [Google Scholar]
- Lazier J, Hendry R, Clarke A, Yashayaev I, Rhines P. Convection and restratification in the Labrador Sea, 1990–2000. Deep-Sea Res. I. 2002;49:1819–1835. 10.1016/S0967-0637(02)00064-X [Google Scholar]
- Leterme S.C, Edwards M, Seuront L, Attrill M.J, Reid P.C, John A.W.G. Decadal basin-scale changes in diatoms, dinoflagellates, and phytoplankton color across the North Atlantic. Limnol. Oceanogr. 2005;50:1244–1253. [Google Scholar]
- Levin S.A, Dushoff J, Keymer J.E. Community assembly and the emergence of ecosystem pattern. Sci. Mar. 2001;65(Suppl. 2):171–179. [Google Scholar]
- Li W.K.W. Macroecological patterns of phytoplankton in the northwestern North Atlantic Ocean. Nature. 2002;419:154–157. doi: 10.1038/nature00994. 10.1038/nature00994 [DOI] [PubMed] [Google Scholar]
- Li W.K.W, Dickie P.M. Monitoring phytoplankton, bacterioplankton, and virioplankton in a coastal inlet (Bedford Basin) by flow cytometry. Cytometry. 2001;44:236–246. doi: 10.1002/1097-0320(20010701)44:3<236::aid-cyto1116>3.0.co;2-5. 10.1002/1097-0320(20010701)44:3%3C236::AID-CYTO1116%3E3.0.CO;2-5 [DOI] [PubMed] [Google Scholar]
- Li W.K.W, Harrison W.G. Chlorophyll, bacteria and picophytoplankton in ecological provinces of the North Atlantic. Deep-Sea Res. II. 2001;48:2271–2293. 10.1016/S0967-0645(00)00180-6 [Google Scholar]
- Li W.K.W, Harrison W.G, Head E.J.H. Coherent sign switching in multiyear trends of microbial plankton. Science. 2006;311:1157–1160. doi: 10.1126/science.1122748. 10.1126/science.1122748 [DOI] [PubMed] [Google Scholar]
- Loder J.W, Petrie B, Gawarkiewicz G. The coastal ocean off northeastern North America: a large-scale view. In: Robinson A.R, Brink K.H, editors. The sea, vol. 11. Wiley; New York, NY: 1998. pp. 105–133. [Google Scholar]
- Longhurst A. Seasonal cycles of pleagic production and consumption. Prog. Oceanogr. 1995;36:77–167. 10.1016/0079-6611(95)00015-1 [Google Scholar]
- Longhurst A. Academic Press; San Diego, CA: 1998. Ecological geography of the sea. [Google Scholar]
- Mills E.L. Cornell University Press; Ithaca, NY: 1989. Biological oceanography: an early history, 1870–1960. [Google Scholar]
- Mitchell M.R, Harrison W.G, Pauley K, Gagné A, Maillet G.L, Strain P. Atlantic zone monitoring program protocol. Can. Tech. Rep. Hydrogr. Ocean Sci. 2002;223:1–23. [Google Scholar]
- Partensky F, Hess W.R, Vaulot D. Prochlorococcus, a marine photosynthetic prokaryote of global significance. Micro. Mol. Biol. Rev. 1999;63:106–127. doi: 10.1128/mmbr.63.1.106-127.1999. [DOI] [PMC free article] [PubMed] [Google Scholar]
- Peters R.H. Cambridge University Press; Cambridge, UK: 1983. The ecological implications of body size. [Google Scholar]
- Platt T, Fuentes-Yaco C, Frank K.T. Spring algal bloom and larval fish survival. Nature. 2003;423:398–399. doi: 10.1038/423398b. 10.1038/423398b [DOI] [PubMed] [Google Scholar]
- Reynolds C.S. Emergence in pelagic communities. Sci. Mar. 2001;65(Suppl. 2):5–30. [Google Scholar]
- Richardson A.J, Schoeman D.S. Climate impact on plankton ecosystems in the northeast Atlantic. Science. 2004;303:1609–1612. doi: 10.1126/science.1100958. 10.1126/science.1100958 [DOI] [PubMed] [Google Scholar]
- Therriault J.C, et al. Proposal for a northwest Atlantic zonal monitoring program. Can. Tech. Rep. Hydrogr. Ocean Sci. 1998;194:1–57. [Google Scholar]


