Abstract
The efficiency of social insect colonies critically depends on their ability to efficiently allocate workers to the various tasks which need to be performed. While numerous models have investigated the mechanisms allowing an efficient colony response to external changes in the environment and internal perturbations, little attention has been devoted to the genetic architecture underlying task specialization. We used artificial evolution to compare the performances of three simple genetic architectures underlying within-colony variation in response thresholds of workers to five tasks. In the ‘deterministic mapping’ system, the thresholds of individuals for each of the five tasks is strictly genetically determined. In the second genetic architecture (‘probabilistic mapping’), the genes only influence the probability of engaging in one of the tasks. Finally, in the ‘dynamic mapping’ system, the propensity of workers to engage in one of the five tasks depends not only on their own genotype, but also on the behavioural phenotypes of other colony members. We found that the deterministic mapping system performed well only when colonies consisted of unrelated individuals and were not subjected to perturbations in task allocation. The probabilistic mapping system performed well for colonies of related and unrelated individuals when there were no perturbations. Finally, the dynamic mapping system performed well under all conditions and was much more efficient than the two other mapping systems when there were perturbations. Overall, our simulations reveal that the type of mapping between genotype and individual behaviour greatly influences the dynamics of task specialization and colony productivity. Our simulations also reveal complex interactions between the mode of mapping, level of within-colony relatedness and risk of colony perturbations.
Keywords: division of labour, polyethism, task allocation, response thresholds
1. Introduction
The success and increased complexity of organisms in the course of evolution is thought to have depended on a small number of major transitions, one of which was the shift from solitary organisms to societies with division of labour (Maynard Smith & Szathmáry 1995). The most familiar example of the advantages arising from division of labour comes from social insects, whose complex social organization forms the basis of their tremendous ecological success (Hölldobler & Wilson 1990).
Colony level flexibility in response to external changes and internal perturbation is an essential feature of division of labour in social insects (Calabi 1988; Robinson 1992). A colony has to perform a number of tasks, such as feeding the brood, foraging for resources, maintaining the nest and defending the colony. Efficient allocation of individuals to these different tasks requires continuous dynamic adjustments in response to external changes, such as risk of intra- and interspecific competition and amount of food available. The colony must also be able to respond to internal perturbations, such as specific mortality of individuals undertaking foraging or another task.
Considerable work has focused on identifying the mechanisms which allow an efficient colony response to information that exceeds the sensory range or cognitive capacity of any given individual (Bonabeau et al. 1997). The large majority of these models are built on the observation that individuals in a colony vary in their propensity to perform the various tasks. Experimental studies in bees, wasps and ants have revealed that workers vary genetically in their sensitivity to task stimuli (O'Donnell 1998; Page et al. 1998; Fewell & Page 2000). Thus, within the colony workers from the same genetic background (same patriline or matriline) are more likely to perform similar tasks than are less related workers. To explain this association several response threshold models have been developed (Bonabeau 1998; Theraulaz et al. 1998; Gautrais et al. 2002; Bertram et al. 2003). In these models, individuals vary genetically in the stimulus (threshold) for a given task at which they begin to perform that task. Only a few workers (those with low thresholds) will perform a task when the stimulus is very low. However, as the stimulus level increases, the thresholds of more individuals are exceeded and those workers begin performing the task.
While numerous models have investigated the mechanisms allowing efficient task allocation under situations where individuals in a colony vary in their response thresholds (Bonabeau 1998; Theraulaz et al. 1998; Gautrais et al. 2002; Bertram et al. 2003), little attention has been devoted to the mechanisms responsible for variation in response thresholds. Most models assume that variation in task sensitivity is a consequence of additive effects of genotype and environment (Robinson et al. 1989; Bonabeau et al. 1996) and that the distribution of genetic thresholds in the group is continuous and normally distributed. However, studies in the honeybee suggest that genotypic variation in tasks may involve a few major loci (Hunt et al. 1995; Page et al. 2000) and also implicate genetic architectures with non-additive gene interactions (Rüppell et al. 2004). As pointed out by Bertram et al. (2003), a better understanding of division of labour requires information on how genotypic variation relates to differences in intracolony response threshold distributions. In a first step toward this goal, these authors developed a model and showed important effects on task allocation and colony behaviour for differences in the number of loci and alleles controlling individual response thresholds.
The aim of the present study is to understand how different genetic architectures of threshold response may affect colony efficiency. While the work of Bertram et al. revealed that the genetic underpinning of response thresholds impinges on the pattern of task allocation, their static analytical model did not allow them to study the impact on colony efficiency, nor how variation in genetic architecture influences the evolutionary trajectory of division of labour. To address these issues, we used artificial evolution to compare the performance of three simple genetic architectures underlying within-colony variation in response thresholds of workers. We evolved five different types of colonies (colonies in which individuals are genetically identical (r=1), colonies with intermediate relatedness values (r=0.25, 0.5 and 0.75) and colonies formed by individuals randomly selected in the population (r=0)). The performances of the three genetic architectures and five types of colonies were compared under different rates of environmental perturbation. Our approach helps to bridge the gap between studies aiming at understanding the genetic basis of behavioural differences among colony members and evolutionary studies focusing on how individual differences in response thresholds may lead to efficient division of labour. Importantly, our approach also allows us to study task distribution when there are more than two tasks and how departure from an optimal distribution affects overall colony performance.
2. Material and methods
(a) Colony tasks
We use a simple agent-based model to compare performance of colonies consisting of 100 individuals. Individuals can engage in five different tasks. We model sublinear return functions typical for tasks as foraging or scouting using the five exponential functions,
| 2.1 |
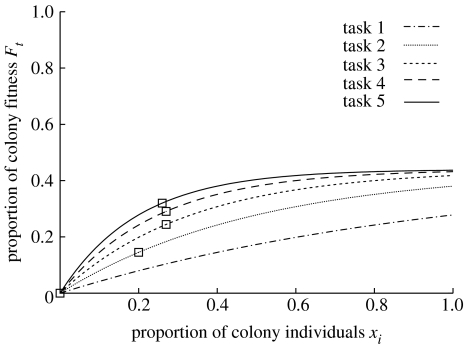
where are the tasks and is the proportion of the colony performing the task (figure 1). Hence, the optimal allocation of workers to the five tasks has a non-trivial solution depicted in figure 1. Importantly, the results of our simulations are not affected by the shape of payoff functions for each task, the general issue being that deviation from a given optimal task allocation results in decreased overall colony fitness.
Figure 1.
Proportion of the maximum colony fitness provided by each of the five tasks as a function of the proportion of workers engaged in this task. Squares indicate the optimal allocation of workers between the five tasks (i.e. the distribution yielding maximum colony fitness).
(b) Genetic architecture
We consider a simple situation where there are five genes (), each encoding an integer value from 0 to 255 (i.e. 8 bit resolution) for one of the five tasks. We compare three mapping systems between genes and the behavioural phenotype of workers.
In the first genetic architecture (deterministic mapping; det), individuals engage in the task with the highest genetically encoded value . This mapping system represents a situation where individual response thresholds are genetically determined with no environmental or social influence on individual responses. In the second genetic architecture (probabilistic mapping; prob), the five genes influence the probability of engaging in a task. The corresponding gene value is proportional to the probability to engage in task i, . This system is similar to a situation where, in addition to a genetic component, the response thresholds of workers are also influenced by developmental noise or fluctuating environmental factors. Finally, in the third genetic architecture (dynamic mapping; dyn), the propensity of individuals to engage in each of the five tasks depends not only on their genotype, but also on the behavioural phenotypes of other colony members. Thus, individuals will perform the task i that maximizes the ratio gi/ai, where ai is the number of colony members already working on task i, i.e. . This system corresponds to the observed pattern of worker–worker inhibition, where the likelihood of individuals to perform a given task is inversely proportional to the proportion of colony members already performing that task (Wilson 1985; Huang 1992; Huang & Robinson 1996). This system also mimics a situation where the stimulus for a given task decreases with increased number of individuals performing this task.
(c) Environmental and internal perturbations
To study the ability of colonies to respond to perturbations in worker task allocation, we studied evolution in environments with different degrees of perturbation. Colony lifespan was divided into 100 time-steps. At each time-step, we randomly selected one of the five tasks and with probability removed all individuals performing this task to replace them with new individuals with genomes created from the same parents. The new individuals were then assigned to a given task according to their genome and genetic architecture. We used five different probabilities (0.0, 0.1, 0.2, 0.3 and 0.4) of perturbation per time-step. In other words, colony size was held constant over the 100 time-steps and, for each step, all individuals engaged in one of the five tasks (randomly selected) were replaced with probability . Total colony fitness F was obtained by adding the fitness obtained at each time-step:
| 2.2 |
and colony fitness at each time-step (Ft) was quantified as the sum of the payoff of each task i,
| 2.3 |
The minimum fitness of the colony is obtained when all 100 individuals engage in the least rewarding task during the entire colony life. Inversely, maximum fitness is obtained when there is an optimal ratio of individuals engaging in each of the five tasks. With the task payoffs chosen here the optimal solution is at , as indicated by the squares in figure 1. For simplicity all fitness values are presented on a scale of 0–100, with 0 being the minimal possible fitness and 100 the maximum value.
(d) Colonies and selection algorithm
We conducted selection experiments over 1000 generations in 100 colonies with five different levels of relatedness (r=0, 0.25, 0.5, 0.75 and 1). The 100 colonies of unrelated individuals were initially formed by using 100 randomly generated genomes for each colony. The fitness of these colonies was compared and we randomly selected one individual of one of the 30 colonies with highest fitness. The genome of this individual was subjected to mutation (probability 0.2% per bit, i.e. 1.6% per gene) to form one individual of the next generation of colonies. This procedure was repeated 10 000 times to produce 100 new colonies, each consisting of 100 individuals. Under this type of colony formation individuals are, on average, not genetically more similar to individuals in their colony than to individuals of other colonies. Hence, the within-colony relatedness is 0. To construct colonies with highly related individuals (r=1), we followed the same procedure but initiated each colony with only one individual which was duplicated 99 times after having been subjected to mutation. Each of the 100 colonies thus comprised 100 genetically identical (clonal) individuals. However, the genomes were always different between colonies, hence leading to a within-colony relatedness of 1. To obtain colonies with a relatedness of 0.25, we used the same procedure but started colonies with four founding individuals that were each clonally copied 24 times after having been mutated. Colonies thus consisted of four types of clones in equal frequency, leading to an overall relatedness of 0.25. To produce colonies with relatedness 0.5, we followed the same procedure but initiated colonies with two individuals. This led to the formation of colonies comprising two types of clones in equal proportions (i.e. a relatedness of 0.5). Finally, colonies with a relatedness of r=0.75 were created in the same way but using unequal proportions of the two types of clones. The proportion p of the most frequent clone was estimated, so that the probability of an individual to interact with another individual with the same genome was on average 0.75 ().
The genetic composition of colonies thus differs from that of most social insect colonies, in that some individuals are clones (r=1) rather than belonging to kin classes, such as full sisters (r=0.75) or half sisters (r=0.375). However, when there is no within-colony nepotism, as appears to be the case in social insects (Keller 1997), social evolution is influenced by the average colony relatedness and not the exact relatedness between pairs of individuals.
Overall, there were therefore five groups of 100 colonies. The selection experiments were repeated 10 times over 1000 generations for each of these five groups. To compare performance of the three genetic architectures, we averaged the performance of the 100 colonies over the first and last 10 generations in 10 separate simulation runs. These 100 values per genetic architecture were compared with t-tests. Data are first presented for colonies of unrelated individuals, next for colonies of highly (r=1) related individuals and finally for colonies of intermediate (r=0.25, 0.5 and 0.75) relatedness.
3. Results
(a) Colonies of unrelated individuals
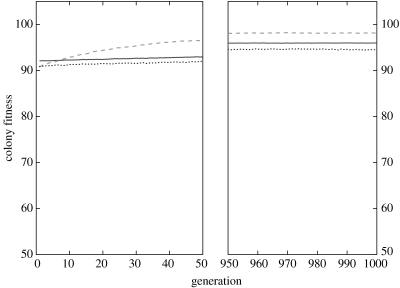
When colonies did not experience perturbations (i.e. there were no instances of selective mortality of individuals performing a given task), there were only small differences between the three genetic architectures in performance during the 10 first generations of selection (figure 2). The lower fitness values were obtained with the deterministic and probabilistic architectures. By their configurations, these two genetic architectures initially lead to a random distribution of individuals among the three castes and, accordingly, fitness values close to the value expected under such a distribution (expected value under random distribution of workers, 10 000 simulations: 90.86; dyn: ; det: ; prob: ). During the first 10 generations, the dynamic mapping system () led to a significantly higher fitness than the two other mapping systems (dyn versus det: , t=3.74, d.f.=196, ; dyn versus prob: , t=38.16, d.f.=196, ), because this genetic architecture leads to a relatively equivalent distribution of workers to each of the five tasks, which results in a slightly higher overall fitness than a random distribution.
Figure 2.
Mean fitness for colonies of unrelated individuals (r=0) for three genetic architectures (dynamic, solid line; deterministic, dashed line; probabilistic, dotted line) without perturbations ().
During the 1000 generations of selection there was an increase in colony fitness for each of the three genetic architectures (figure 2). At the end of evolution there was a significant difference in colony fitness between the three genetic architectures, with the highest performance achieved by the deterministic and the lowest with the probabilistic system (table 1).
Table 1.
Fitness average of the last 10 generations () for the three genetic architectures in unrelated (r=0) and highly related (r=1) colonies with different reallocation probabilities Pr.
| r=0 | r=1 | |||||
|---|---|---|---|---|---|---|
| p-values | p-values | |||||
| dyn, Pr=0.00 | 95.97 | 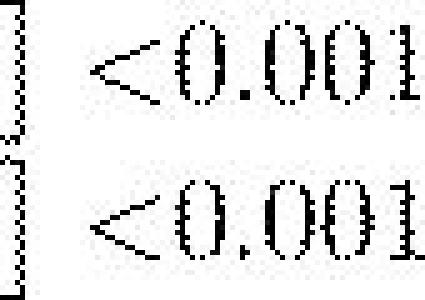 |
 |
99.87 |  |
 |
| det, Pr=0.00 | 98.14 | 21.97 | ||||
| prob, Pr=0.00 | 94.51 | 98.68 | ||||
| dyn, Pr=0.10 | 94.20 |  |
 |
99.88 |  |
 |
| det, Pr=0.10 | 86.11 | 21.95 | ||||
| prob, Pr=0.10 | 82.32 | 87.60 | ||||
| dyn, Pr=0.20 | 94.46 |  |
 |
99.91 |  |
 |
| det, Pr=0.20 | 84.50 | 21.96 | ||||
| prob, Pr=0.20 | 78.02 | 85.57 | ||||
| dyn, Pr=0.30 | 94.85 |  |
 |
99.87 |  |
 |
| det, Pr=0.30 | 83.83 | 21.93 | ||||
| prob, Pr=0.30 | 75.22 | 84.70 | ||||
| dyn, Pr=0.40 | 95.16 |  |
 |
99.89 |  |
 |
| det, Pr=0.40 | 83.55 | 21.95 | ||||
| prob, Pr=0.40 | 73.45 | 84.34 | ||||
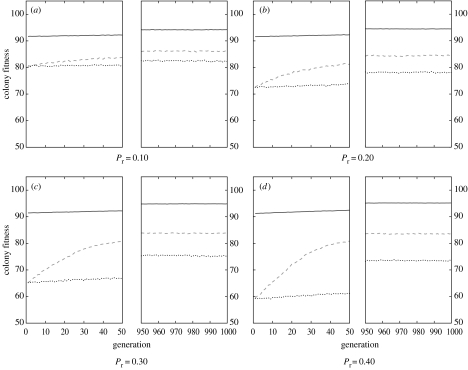
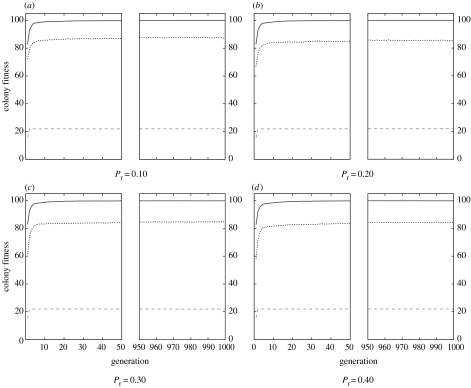
Evolution with selective removal of individuals engaged in a given task led to a significant reduction in colony fitness and a shift in the relative performances of the three genetic architectures (figure 3). For each of the four levels of perturbation, the dynamic mapping system led to an initially greater colony fitness compared to the two other genetic architectures (dyn: ; det: ; prob: , for , all , figure 3). During the 1000 generations of selection there was an increase in fitness for each of the three genetic architectures. However, there were still marked differences in performance with, in all cases, the dynamic system performing significantly better than the two others and the probabilistic system performing significantly worst (table 1).
Figure 3.
Mean fitness for colonies of unrelated individuals (r=0) for three genetic architectures (dynamic, solid line; deterministic, dashed line; probabilistic, dotted line) for four degrees of perturbation (Pr=0.10, 0.20, 0.30, 0.40).
(b) Colonies of highly related individuals
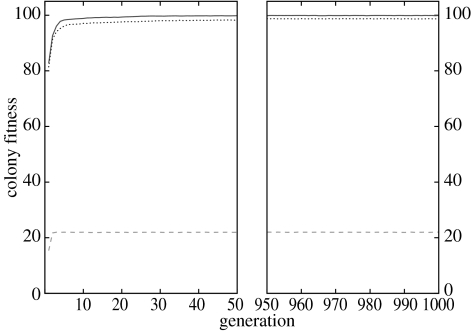
The presence of highly related individuals (r=1) within colonies had important consequences on the performances of the three genetic architectures. When colonies did not experience perturbations, the dynamic and probabilistic systems led to a very high fitness, while the deterministic system performed very poorly (figure 4). At generation 1, the overall difference between the dynamic and probabilistic system was very small but significant, with a small advantage for the dynamic system (dyn: ; dyn versus prob: , t=2.87, d.f.=16, ). The deterministic system performed poorly with a fitness significantly lower than for the two other systems (, both ). During the first 10 generations, the difference between dynamic () and the two other mapping systems was highly significant (dyn versus det: , t=145.88, d.f.=196, ; dyn versus prob: , t=2.83, d.f. =196, ).
Figure 4.
Mean fitness for colonies of highly related individuals (r=1) for three genetic architectures (dynamic, solid line; deterministic, dashed line; probabilistic, dotted line) when there were no perturbations (Pr=0.00).
During the 1000 generations of selection there was an increase in colony fitness for each of the three genetic architectures (figure 4). During the last 10 generations there was a significant difference in colony fitness between the three genetic architectures; the highest performances were achieved by the probabilistic and dynamic mapping systems, the latter performing slightly better than the former (table 1). By contrast, the deterministic system performed poorly because all individuals within a colony had the same genome and therefore engaged in the same task.
Perturbations led to decreased fitness in the probabilistic system but not in the two other systems. For each of the four levels of perturbation, the dynamic mapping system led to an initially greater colony fitness compared to the two other mapping systems while, again, the deterministic system showed the worst performance (dyn: ; det: ; prob: , for , all , figure 5). During the 1000 generations of selection there was an increase in fitness for each of the three mapping systems. However, in the last 10 generations there were marked differences in performance with, in all cases, the dynamic system performing significantly better and the deterministic system performing worst (figure 5; table 1).
Figure 5.
Mean fitness for colonies of highly related individuals (r=1) for three genetic architectures (dynamic, solid line; deterministic, dashed line; probabilistic, dotted line) for four degrees of perturbation (Pr=0.10, 0.20, 0.30, 0.40).
(c) Colonies with intermediate relatedness
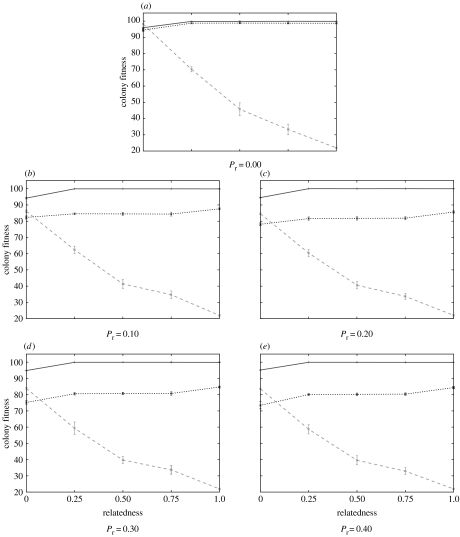
At the end of the selection experiments, the performance of colonies with intermediate relatedness (r=0.25, 0.5, 0.75) was intermediate between colonies with unrelated (r=0) and highly related (r=1) individuals. This was true for each of the three genetic architectures and for each of the five levels of perturbation (figure 6).
Figure 6.
Mean fitness values with standard deviations at generation 1000 for intermediate relatedness values (dynamic, solid line; deterministic, dashed line; probabilistic, dotted line) with five different degrees of perturbation (Pr=0.00, 0.10, 0.20, 0.30, 0.40).
For each for the three relatedness values and each of the five levels of perturbation, the dynamic system performed better than the probabilistic system (all ), which itself invariably performed better than the deterministic system (figure 6, all ). The difference in performance between the dynamic and probabilistic system was marked only when there were perturbations. By contrast, the dynamic and probabilistic systems were more efficient than the deterministic system whatever the rate of perturbations.
4. Discussion
Our simulations revealed that the type of genetic architecture had very important effects on colony performance. When colonies consisted of unrelated individuals and were not subjected to perturbations, the three genetic architectures performed well, with a slight advantage for the deterministic mapping system, an intermediate performance for the dynamic and the lowest fitness for the probabilistic system. The relatively good performance of the deterministic system can be explained by the fact that when there are no perturbations and colonies comprise unrelated individuals, it is possible to select for a good ratio of genotypes specialized in each of the five castes. This is because this genetic architecture leads to a clear association between genotype and task so that frequency selection at the population level can lead to the optimal ratio of individuals specialized in each of the five tasks. The slightly lower performance of the dynamic system probably stems from the greater complexity of this system and the greater difficulty faced in keeping the optimal mix of genotypes within the population. Finally, the lowest performance of the probabilistic system can be explained by the fact that when colonies consist of completely unrelated individuals there is no benefit derived from increasing phenotypic variance. Rather, such variance leads to greater deviations from the optimal allocation of workers among the five tasks compared with the deterministic model.
Repeated perturbations had very different effects on the three genetic architectures. The performance of the dynamic mapping system was only minimally affected by the selective removal of workers performing a given task. The high resilience of this mapping system can be explained by the fact that when all workers doing a specific task were removed, there was a high stimulus for the replacement workers to engage in that task. As a result, colony perturbations led to almost no change in colony task allocation. By contrast, the two other genetic architectures were much more affected by the perturbations, because the task choice of the replacement workers was genetically determined and independent of the type of workers removed. Hence, when workers performing a given task were removed, allocation of the new individuals almost invariably resulted in a sub-optimal number of workers performing that task. For both, the deterministic and probabilistic mapping systems, the decrease in performance was proportional to the frequency of perturbations.
Genetic relatedness significantly influenced the performance of the three genetic architectures. In contrast to the results with unrelated individuals, high relatedness (r=1) always resulted in a very low fitness for the deterministic mapping system. This can be explained by this genetic architecture inducing all workers to perform the same task when they have an identical genome. Hence, the stable optimal solution was one that induced workers to engage in the most rewarding task and this is indeed the solution to which the selection experiments converged. This feature also explains why the performance of this mapping system was not significantly influenced by perturbations. Since the replacement workers had the same genome as the removed workers, they always performed the same job as those they were replacing, thus yielding no effect on colony fitness.
Unlike in the deterministic mapping system, high relatedness in the probabilistic and dynamic mapping systems translated into very high performances when there were no perturbations. In fact, the performance of these two systems was higher than in the situation of low relatedness. This can be explained by high colony relatedness allowing for a more efficient mode of selection of genotypes than in the situation where nestmates were unrelated. In our experiments, the individuals that were selected to create the new generation of colonies were randomly chosen from the 30% of colonies with the highest fitness. Such a mode of selection is very efficient when nestmates are highly related (r=1), because individuals with a bad genome are unlikely to be selected. However, when individuals are not related, there is only very weak heritability of colony efficiency and very low selection for more efficient genomes.
Repeated perturbations led to a major decrease in fitness with the probabilistic, but not with the dynamic mapping. The explanation for this difference is again because the dynamic mapping system allowed for the replacement of workers doing a particular task by new workers also performing that same task. The probabilistic mapping system, on the other hand, did not allow for a preferential replacement of workers doing the same task, hence resulting in a fitness decrease. Importantly, the dynamic mapping system allowed colonies to achieve fitness values close to the maximum value possible, regardless of the frequency of perturbations.
Colonies with intermediate relatedness values (r=0.25, 0.5 and 0.75) invariably had performances between those of colonies with high and low relatedness. This was true for each of the three genetic architectures and for each of the five levels of perturbation. A comparison of colonies with different relatedness values showed that the performance of the deterministic system decreased sharply with increasing relatedness. The reason is again that task choice is entirely genetically determined and increased genetic similarity decreases the number of tasks performed by colony members. Thus, colonies consisting of only two types of individuals (r=0.5, 0.75) could only perform two out of the five tasks, while colonies with r=0.25 performed the four most rewarding tasks. The effect of changes in relatedness was lower for the two other systems, because they were more efficient at conducting all tasks, independent of the genetic similarity of colony members.
The dynamic system obtained fitness values close to the maximum and significantly higher than those of the probabilistic system. In both systems, increased relatedness again resulted in increased task performance, because in addition to frequency selection of specialists at the population level, relatedness also allowed the more efficient frequency selection at the colony level, with all colonies reaching near optimal solutions after 1000 generations of selection.
As in the case of high relatedness, repeated perturbations for intermediate relatedness values led to a severe performance drop for the probabilistic system and important effects for the deterministic system, but had no effect on the dynamic system because of the ability of the latter to preferentially replace missing workers.
The results of these simulations have important implications for our understanding of division of labour. First, and most importantly, they demonstrate that the underlying mechanisms responsible for the production of a behavioural phenotype from a given genotype have major effects on task partitioning and colony performance. Thus, under certain circumstances, there were up to fivefold differences in fitness between colonies, depending on the mapping system. Second, they demonstrate that the relative performance of the mapping systems varied greatly depending on the rate of colony perturbation and kin composition of colonies. Thus, while the deterministic mapping system performed very well with colonies containing unrelated individuals when there were no perturbations, it resulted in a very low fitness when colonies consisted of related individuals. Also, the rate of perturbation had important consequences on colony performance for both the deterministic and probabilistic mapping systems. By contrast, the dynamic mapping system was highly resilient to colony perturbations, because it allowed for the replacement of workers performing a given task by new workers also performing this task. Our simulations also demonstrate that performance can be influenced by colony relatedness, in particular for the deterministic system. This is important, because in social insects there is important variation in relatedness both within and between species (Bourke & Franks 1995; Ross & Keller 1995; Crozier & Pamilo 1996).
Our model made two important assumptions. First, to simulate perturbations, we removed all individuals of a randomly chosen task group. The removal of only a portion of the individuals doing a task does not qualitatively affect the results of the simulations as demonstrated by simulations where only 25, 50 or 75% of the individuals were removed (see figure 1 of the electronic supplementary material). Second, due to computational constraints, we conducted our experiments in colonies consisting of 100 individuals. However, additional simulations showed that colony size does not significantly change the relative performance of the three mapping systems. For example, there was very little difference in colony fitness between colonies of 100 and 10 000 individuals for each of the three genetic systems and for all of the levels of perturbation investigated (see figure 2 of the electronic supplementary material).
In this study we considered three genetic architectures. We selected these genetic architectures because they represent simple possibilities of how a genotype can produce a behavioural phenotype. An important message emerging from their comparison is that high colony relatedness selects for higher phenotypic plasticity. Thus, a system such as our deterministic architecture which corresponds to a direct mapping between genotype and behaviour leads to low colony fitness when nestmates are highly related, because the vast majority of individuals will engage in the same task. Under high relatedness, it is therefore better if task specialization also depends on the effects of other factors, such as noise during development and/or age-specific variations in response thresholds (Calderone & Page 1988; Huang & Robinson 1996).
Our simulations revealed that the dynamic system always performs better than the two others when there are perturbations. Under natural conditions, colonies of social insects frequently experience perturbations because of the selective death of individuals engaging in particular tasks or environmental changes requiring rapid adjustments of the number of workers engaged in various tasks. Hence, this should select for a genetic architecture allowing workers to respond to changes in perturbations in the distribution of individuals engaged in the different tasks and changes in colony needs. The frequency and magnitude of perturbations are probably influenced by many factors, such as colony size, number of tasks performed by colony members, type of nest structure and type of food collected. Hence, it is likely that there is important variation among species in the frequency and magnitude of perturbations, possibly resulting in interspecific variation in the genetic architecture providing the best colony efficiency.
In conclusion, this study revealed that the type of mapping between genotype and individual behaviour greatly influences the dynamics of task specialization and colony productivity. Our simulations also revealed complex interactions between the mode of mapping, level of within-colony relatedness and frequency distribution. It is likely that the optimal mapping differs across species depending on their kin structure, risk of colony perturbation and degree of variation in colony needs.
Acknowledgments
We thank Andres Perez-Uribe for initial explorations, Guy Theraulaz, Rob Hammond and Jean-Louis Deneubourg for helpful discussion and comments on an early version of the manuscript and the Swiss NSF for supporting this work.
Supplementary Material
Our model made two important assumptions. First, to simulate perturbations we removed all individuals of a randomly chosen task group. The removal of only a portion of the individuals doing a task does not qualitatively affect the results of the simulations as demonstrated by simulations where only 25, 50 or 75% of the individuals were removed (Fig. 1 supplementary material). Second, due to computational constraints, we conducted our experiments in colonies consisting of 100 individuals. However, additional simulations showed that colony size does not significantly change the relative performance of the three mapping systems. For example, there was very little difference in colony fitness between colonies of 100 and 10000 individuals for each of the three genetic systems and for all of the levels of perturbation investigated (Fig. 2 supplementary material).
References
- Bertram S.M, Gorelick R, Fewell J.H. Colony response to graded resource changes: an analytical model of the influence of genotype, environment, and dominance. Theor. Popul. Biol. 2003;64:151–162. doi: 10.1016/s0040-5809(03)00064-9. doi:10.1016/S0040-5809(03)00064-9 [DOI] [PubMed] [Google Scholar]
- Bonabeau E. Fixed response thresholds and the regulation of division of labor in insect societies. Bull. Math. Biol. 1998;60:753–807. doi:10.1006/bulm.1998.0041 [Google Scholar]
- Bonabeau E, Theraulaz G, Deneubourg J.L. Quantitative study of the fixed threshold model for the regulation of division of labour in insect societies. Proc. R. Soc. B. 1996;263:1565–1569. [Google Scholar]
- Bonabeau E, Theraulaz G, Deneubourg J.L, Serge A, Camazine S. Self-organization in social insects. Trends Ecol. Evol. 1997;12:188–193. doi: 10.1016/s0169-5347(97)01048-3. doi:10.1016/S0169-5347(97)01048-3 [DOI] [PubMed] [Google Scholar]
- Bourke A.F.G, Franks N.R. Social evolution in ants. Princeton University Press; Princeton, NJ: 1995. [Google Scholar]
- Calabi P. Behavioral flexibility in Hymenoptera: a re-examination of the concept of caste. In: Trager J.C, editor. Advances in myrmecology. Brill Press; Leiden: 1988. pp. 237–258. [Google Scholar]
- Calderone N.W, Page R.E., Jr Genotypic variability in age polyethism and task specialisation in the honey bee, Apis mellifera. Behav. Ecol. Sociobiol. 1988;22:17–25. doi:10.1007/BF00395694 [Google Scholar]
- Crozier R.H, Pamilo P. Evolution of social insect colonies: sex allocation and kin selection. Oxford University Press; Oxford, New York: 1996. [Google Scholar]
- Fewell J.H, Page R.E., Jr Colony-level selection effects on individual and colony foraging task performance in honeybees. Behav. Ecol. Sociobiol. 2000;48:173–181. doi:10.1007/s002650000183 [Google Scholar]
- Gautrais J, Theraulaz G, Deneubourg J.L, Anderson C. Emergent polyethism as a consequence of increased colony size in insect societies. J. Theor. Biol. 2002;215:363–373. doi: 10.1006/jtbi.2001.2506. doi:10.1006/jtbi.2001.2506 [DOI] [PubMed] [Google Scholar]
- Hölldobler B, Wilson E.O.The antschapter 11990The Belkap Press of Harvard University Press; Cambridge, MA [Google Scholar]
- Huang Z.-Y. Honeybee colony integration: worker–worker interactions mediate hormonally regulated plasticity in division of labor. Proc. Natl Acad. Sci. USA. 1992;89:11 726–11 729. doi: 10.1073/pnas.89.24.11726. [DOI] [PMC free article] [PubMed] [Google Scholar]
- Huang Z.-Y, Robinson G.E. Regulation of honey bee division of labor by colony age demography. Behav. Ecol. Sociobiol. 1996;39:147–158. doi:10.1007/s002650050276 [Google Scholar]
- Hunt G.J, Page R.E, Fondrk M.K, Dullum C.J. Major quantitative trait loci affecting honey bee foraging behavior. Genetics. 1995;141:1537–1545. doi: 10.1093/genetics/141.4.1537. [DOI] [PMC free article] [PubMed] [Google Scholar]
- Keller L. Indiscriminate altruism: unduly nice parents and siblings. Trends Ecol. Evol. 1997;12:99–103. doi: 10.1016/s0169-5347(96)10065-3. doi:10.1016/S0169-5347(96)10065-3 [DOI] [PubMed] [Google Scholar]
- Maynard Smith J, Szathmáry E. chapter 16. Oxford University Press; Oxford: 1995. The major transitions in evolution. [Google Scholar]
- O'Donnell S. Genetic effects on task performance, but not on age polyethism, in a swarm-founding eusocial wasp. Anim. Behav. 1998;55:417–426. doi: 10.1006/anbe.1997.0627. doi:10.1006/anbe.1997.0627 [DOI] [PubMed] [Google Scholar]
- Page R.E, Erber J, Fondrk M.K. The effect of genotype on response thresholds to sucrose and foraging behavior of honey bees (Apis mellifera L.) J. Comp. Physiol. A. 1998;182:489–500. doi: 10.1007/s003590050196. doi:10.1007/s003590050196 [DOI] [PubMed] [Google Scholar]
- Page R.E, Fondrk M.K, Hunt G.J, Guzmán-Novoa E, Humphries M.A, Nguyen K, Green A.S. Genetic dissection of honeybee (Apis mellifera L.) foraging behavior. J. Hered. 2000;91:474–479. doi: 10.1093/jhered/91.6.474. doi:10.1093/jhered/91.6.474 [DOI] [PubMed] [Google Scholar]
- Robinson G.E. Regulation of division of labor in insect societies. Annu. Rev. Entomol. 1992;37:637–665. doi: 10.1146/annurev.en.37.010192.003225. doi:10.1146/annurev.en.37.010192.003225 [DOI] [PubMed] [Google Scholar]
- Robinson G.E, Page R.E, Strambi C, Strambi A. Hormonal and genetic control of behavioral integration in honey bee colonies. Science. 1989;246:109–112. doi: 10.1126/science.246.4926.109. [DOI] [PubMed] [Google Scholar]
- Ross K.G, Keller L. Ecology and evolution of social organization: insights from fire ants and other highly eusocial insects. Annu. Rev. Ecol. Syst. 1995;26:631–656. doi:10.1146/annurev.es.26.110195.003215 [Google Scholar]
- Rüppell O, Pankiw T, Page R.E., Jr Pleiotropy, epistasis and new QTL: the genetic architecture of honey bee foraging behavior. J. Hered. 2004;95:481–491. doi: 10.1093/jhered/esh072. doi:10.1093/jhered/esh072 [DOI] [PubMed] [Google Scholar]
- Theraulaz G, Bonabeau E, Deneubourg J.L. Response threshold reinforcement and division of labour in insect societies. Proc. R. Soc. B. 1998;265:327–332. doi:10.1098/rspb.1998.0299 [Google Scholar]
- Wilson E.O. Between-caste aversion as a basis for division of labor in the ant pheidole pubiventris (hymenoptera: Formicidae) Behav. Ecol. Sociobiol. 1985;17:35–37. doi:10.1007/BF00299425 [Google Scholar]
Associated Data
This section collects any data citations, data availability statements, or supplementary materials included in this article.
Supplementary Materials
Our model made two important assumptions. First, to simulate perturbations we removed all individuals of a randomly chosen task group. The removal of only a portion of the individuals doing a task does not qualitatively affect the results of the simulations as demonstrated by simulations where only 25, 50 or 75% of the individuals were removed (Fig. 1 supplementary material). Second, due to computational constraints, we conducted our experiments in colonies consisting of 100 individuals. However, additional simulations showed that colony size does not significantly change the relative performance of the three mapping systems. For example, there was very little difference in colony fitness between colonies of 100 and 10000 individuals for each of the three genetic systems and for all of the levels of perturbation investigated (Fig. 2 supplementary material).


