Abstract
A writing system is a visual notation system wherein a repertoire of marks, or strokes, is used to build a repertoire of characters. Are there any commonalities across writing systems concerning the rules governing how strokes combine into characters; commonalities that might help us identify selection pressures on the development of written language? In an effort to answer this question we examined how strokes combine to make characters in more than 100 writing systems over human history, ranging from about 10 to 200 characters, and including numerals, abjads, abugidas, alphabets and syllabaries from five major taxa: Ancient Near-Eastern, European, Middle Eastern, South Asian, Southeast Asian. We discovered underlying similarities in two fundamental respects.
The number of strokes per characters is approximately three, independent of the number of characters in the writing system; numeral systems are the exception, having on average only two strokes per character.
Characters are ca. 50% redundant, independent of writing system size; intuitively, this means that a character’s identity can be determined even when half of its strokes are removed.
Because writing systems are under selective pressure to have characters that are easy for the visual system to recognize and for the motor system to write, these fundamental commonalities may be a fingerprint of mechanisms underlying the visuo–motor system.
Keywords: writing, reading, redundancy, complexity, letter perception, character recognition
1. Introduction
Writing systems (such as alphabets) are visual notation systems wherein a repertoire of marks, or strokes, is used to construct a set of characters. Because writing systems are under selective pressure to be easy to read and write, we reasoned that by identifying commonalities underlying how strokes combine into characters in writing systems over human history, we would, in effect, be identifying fundamental properties of the human visuo–motor system. Here, we are interested in measuring two specific fundamental properties of writing systems: character length, which is the average number of strokes per character, and redundancy, which measures how efficiently characters are built out of strokes. Our main result will be that, after examining more than 100 writing systems over human history (table 1), ranging from about 10 to 200 characters, we determined that writing systems have average lengths of approximately three strokes per character and redundancies of ca. 50%, and these values do not vary much as a function of writing system size. In §4 we will speculate on what this might tell us about the human visuo–motor system.
Table 1.
Information for the writing systems used in the analysis.
(Character information was sampled from Ager’s Omniglot: a guide to writing systems (Ager 1998), in conjunction with Daniels & Bright (1996). Writing systems were chosen from Omniglot so as to cover all major phylogenetically distinct writing system classes for numerals, abjads, abugidas (including vowel diacritics), alphabets and syllabaries, as shown in figure 1. Invented writing systems were included if they have been successfully used by some community; writing systems invented for fun or for fictional purposes were not included. We did not include logographic writing systems like Chinese and other East Asian writing systems where the character and word levels are not cleanly separable (see Chen et al. 1996; Yeh & Li 2004). When multiple variants existed, we chose the first shown. Lower-case characters were used unless otherwise noted; also, character variants that occur at the start or end of a word were not used. In several alphabets, the alphabet has some syllabic features, and ‘syllabic’ has been placed in parentheses to denote this. Dates are often only approximate, and are recorded such that negative values indicate BC. The ‘phylogeny’ column shows the principal sequence of ancestors of the writing system; or when invented, it gives the inventor’s name. The fifth column gives the average character length, which is the average number of strokes per character in the writing system (see figure 2a). The sixth column gives the stroke type repertoire size (see figure 3a), and the seventh column the writing system size (i.e. the number of characters). The last column provides the total number of edges in the stroke-type network for that writing system (see text and figure 4a for more information on stroke-type networks).)
| name and sample characters | kind of system | date | phylogeny | average character length L | number of stroke types B | number of characters C | total number of edges | |
| 1 | Ahom 
|
abugida | 1250 | Brahmi → | 2.40 | 26 | 40 | 68 |
| 2 | Albanian (Elbasan) 
|
alphabet | 1750 | invented: unknown | 2.60 | 32 | 53 | 82 |
| 3 | Ancient Berber (Vertical) 
|
abjad | −150 | Punic → | 2.68 | 12 | 25 | 23 |
| 4 | Arabic 
|
abjad | 512 | Aramaic → Nabataean → | 2.63 | 19 | 35 | 36 |
| 5 | Arabic 
|
numeral | 512 | Aramaic → Nabataean Aramaic → | 2.00 | 10 | 10 | 13 |
| 6 | Aramaic 
|
abjad | −900 | Phoenician → | 2.68 | 11 | 22 | 25 |
| 7 | Armenian (Eastern) 
|
alphabet | 405 | invented: Mesrop-Mashtots | 2.21 | 24 | 39 | 42 |
| 8 | Asomtavruli 
|
alphabet | 430 | Greek → | 2.42 | 25 | 38 | 52 |
| 9 | Avestan 
|
alphabet | 250 | Aramaic → Psalter and Old Pahlavi → | 2.42 | 35 | 53 | 77 |
| 10 | Bassa 
|
alphabet | unknown | invented: unknown | 2.37 | 24 | 30 | 38 |
| 11 | Batak (Kara Batak) 
|
abugida | 1350 | Brahmi → Pallava → Old Kawi → | 2.15 | 13 | 33 | 33 |
| 12 | Bengali 
|
abugida | 1050 | Brahmi → Devanagari → | 3.91 | 29 | 45 | 113 |
| 13 | Bengali 
|
numeral | 1050 | Brahmi → Devanagari → | 1.80 | 14 | 10 | 15 |
| 14 | Brahmi 
|
abugida | −450 | Aramaic → | 2.14 | 24 | 43 | 51 |
| 15 | Buhid (Mangyan) 
|
abugida | 1350 | Brahmi → Pallava → Old Kawi → | 3.78 | 5 | 18 | 12 |
| 16 | Burmese 
|
abugida | 1150 | Brahmi → Mon → | 2.51 | 29 | 41 | 85 |
| 17 | Burmese 
|
numeral | 1150 | Brahmi → Mon → | 1.40 | 10 | 10 | 6 |
| 18 | Carrier (Dene) 
|
syllabary (rotating) | 1885 | invented: Father Adrien-Gabriel Morice | 3.20 | 61 | 180 | 68 |
| 19 | Celtiberian 
|
alphabet (syllabic) | −550 | Punic → Iberian → | 3.29 | 9 | 28 | 36 |
| 20 | Cherokee 
|
syllabary | 1819 | invented: George Guess | 2.35 | 51 | 85 | 102 |
| 21 | Chinese 
|
numeral | −1150 | unknown | 3.00 | 6 | 10 | 13 |
| 22 | Cypriot 
|
syllabary | −800 | linear B → | 3.84 | 19 | 55 | 68 |
| 23 | Cyrillic (Abkhaz) 
|
alphabet | 950 | Greek → Old Church Slavonic → | 3.69 | 19 | 62 | 42 |
| 24 | Dehong 
|
abugida | 1050 | Brahmi → Sinhala → | 3.39 | 13 | 33 | 40 |
| 25 | Dehong 
|
numeral | 1050 | Brahmi → Sinhala → | 1.90 | 11 | 10 | 12 |
| 26 | Deseret 
|
alphabet | 1850 | invented: George D. Watt | 1.68 | 27 | 38 | 34 |
| 27 | Devanagari 
|
abugida | 1050 | Brahmi → | 3.27 | 30 | 45 | 83 |
| 28 | Devanagari 
|
numeral | 1050 | Brahmi → | 1.40 | 13 | 10 | 8 |
| 29 | Dives Akuru 
|
abugida | 1200 | Brahmi → Sinhala → | 3.77 | 21 | 23 | 31 |
| 30 | Enochian 
|
alphabet | 1580 | invented: Dr John Dee and Sir Edward Kelly | 2.52 | 19 | 21 | 37 |
| 31 | Ethiopic (Ge’ez) 
|
abugida | 350 | Southern Linear → Sabaean/Minean → | 2.63 | 20 | 40 | 41 |
| 32 | Etruscan (archaic) 
|
alphabet | −750 | Greek → | 2.91 | 11 | 23 | 25 |
| 33 | Faliscan 
|
alphabet | −650 | Greek → Etruscan → | 2.52 | 15 | 21 | 32 |
| 34 | Fraser 
|
alphabet | 1915 | invented: James Ostram Fraser | 2.37 | 17 | 41 | 36 |
| 35 | Glagolitic 
|
alphabet | 860 | Greek → | 4.51 | 22 | 41 | 95 |
| 36 | Gothic (Wulfila) 
|
alphabet | 350 | Greek → | 2.32 | 17 | 25 | 37 |
| 37 | Greek 
|
alphabet | −750 | Phoenician → | 1.71 | 21 | 24 | 24 |
| 38 | Gujarati 
|
abugida | 1592 | Brahmi → Devanagari → | 2.21 | 32 | 42 | 63 |
| 39 | Gujarati 
|
numeral | 1592 | Brahmi → Devanagari → | 1.50 | 13 | 10 | 10 |
| 40 | Gurmukhi 
|
abugida | 1550 | Brahmi → | 3.20 | 31 | 46 | 93 |
| 41 | Gurmukhi 
|
numeral | 1550 | Brahmi → | 1.90 | 12 | 10 | 11 |
| 42 | Hanuno’o (Mangyan) 
|
abugida | 1350 | Brahmi → Pallava → Old Kawi → | 3.13 | 13 | 16 | 34 |
| 43 | Hebrew 
|
abjad | −125 | Aramaic → | 2.55 | 18 | 33 | 30 |
| 44 | Hindu-Arabic 
|
numeral | 700 | Brahmi → | 1.60 | 9 | 10 | 9 |
| 45 | Hungarian Runes 
|
alphabet | 1000 | Aramaic → Sogdian → Turkic → | 3.08 | 12 | 40 | 34 |
| 46 | Hungarian Runes 
|
numeral | 1000 | Aramaic → Sogdian → Turkic → | 2.50 | 4 | 6 | 12 |
| 47 | Iberian (northern) 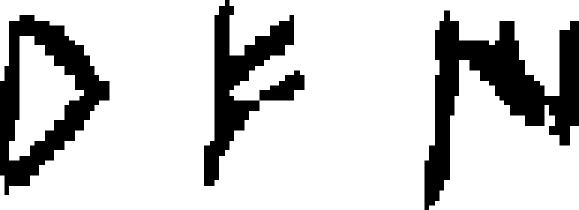
|
alphabet (syllabic) | −1000 | Punic → | 3.46 | 11 | 26 | 27 |
| 48 | Iberian (southern) 
|
alphabet (syllabic) | −1000 | Punic → | 3.14 | 11 | 22 | 30 |
| 49 | International phonetic 
|
alphabet | 1847 | invented: Isaac Pitman and Henry Ellis | 2.42 | 47 | 170 | 119 |
| 50 | Kannada 
|
abugida | 550 | Brahmi → | 2.79 | 34 | 47 | 92 |
| 51 | Kannada 
|
numeral | 550 | Brahmi → | 1.00 | 10 | 10 | 0 |
| 52 | Kharoshthi 
|
abugida | −450 | Aramaic → | 1.72 | 30 | 39 | 44 |
| 53 | Kharoshthi 
|
numeral | −450 | Aramaic → | 1.88 | 7 | 8 | 11 |
| 54 | Khmer 
|
abugida | 611 | Brahmi → Pallava → | 7.49 | 33 | 68 | 70 |
| 55 | Khmer 
|
numeral | 611 | Brahmi → Pallava → | 3.70 | 14 | 10 | 30 |
| 56 | Korean (Hangeul) 
|
alphabet | 1446 | invented: King Seycong | 2.83 | 8 | 24 | 19 |
| 57 | Kpelle 
|
syllabary | 1930 | invented: Chief Gbili | 3.07 | 74 | 88 | 198 |
| 58 | Latin, ancient 
|
alphabet | −650 | Greek → Etruscan → | 2.67 | 10 | 21 | 25 |
| 59 | Latin, modern 
|
alphabet | 1600 | Greek → Etruscan → ancient Latin → | 2.08 | 14 | 26 | 33 |
| 60 | Latin, modern all-caps 
|
alphabet | 1600 | Greek → Etruscan → ancient Latin → | 2.50 | 17 | 26 | 41 |
| 61 | Lepcha (Rong) 
|
abugida | 1720 | Brahmi → Devanagari → Tibetan → | 2.68 | 44 | 77 | 95 |
| 62 | Lepcha (Rong) 
|
numeral | 1720 | Brahmi → Devanagari → Tibetan → | 2.60 | 15 | 10 | 27 |
| 63 | Limbu 
|
abugida | 1730 | Brahmi → Devanagari → Tibetan → Lepcha → | 2.51 | 34 | 37 | 72 |
| 64 | Linear B 
|
syllabary | −1550 | linear A → | 5.03 | 34 | 73 | 148 |
| 65 | Marsiliana 
|
alphabet | −650 | Greek → | 2.88 | 15 | 26 | 33 |
| 66 | Meroitic (non-hieroglyphic) 
|
abugida | −250 | Ancient Egyptian → | 3.46 | 19 | 23 | 55 |
| 67 | Messapic 
|
alphabet | −550 | Greek → | 2.87 | 14 | 23 | 34 |
| 68 | Middle Adriatic (South Picene) 
|
alphabet | −650 | Greek → Etruscan → | 2.70 | 13 | 23 | 32 |
| 69 | Middle Persian (Pahlavi) 
|
abjad | 200 | Aramaic → | 2.00 | 16 | 22 | 25 |
| 70 | Mkhedruli 
|
alphabet | 1200 | Greek → Asomtavruli → Nushka-khucuri → | 2.21 | 38 | 38 | 73 |
| 71 | Mongolian 
|
alphabet | 1150 | Aramaic → Sogdian → | 3.29 | 28 | 35 | 77 |
| 72 | Mongolian 
|
numeral | 1150 | Aramaic → Sogdian → | 1.60 | 11 | 10 | 9 |
| 73 | Nabataean 
|
abjad | 50 | Aramaic → | 1.77 | 18 | 22 | 24 |
| 74 | Ndjuka’ 
|
syllabary | 1910 | invented: Afaka Atumisi | 2.35 | 36 | 52 | 78 |
| 75 | New Tai Lue 
|
numeral | 1950 | invented: unknown | 2.23 | 12 | 10 | 12 |
| 76 | N’Ko 
|
alphabet | 1949 | invented: Soulemayne Kante | 2.14 | 20 | 22 | 28 |
| 77 | N’Ko 
|
numeral | 1949 | invented: Soulemayne Kante | 2.60 | 6 | 10 | 9 |
| 78 | North Picene 
|
alphabet | −650 | Greek → Etruscan → | 2.67 | 13 | 18 | 27 |
| 79 | Nuskha-khucuri 
|
alphabet | 850 | Greek → Asomtavruli → | 3.58 | 16 | 38 | 31 |
| 80 | Old Church Slavonic 
|
alphabet | 850 | Greek → | 3.33 | 27 | 42 | 70 |
| 81 | Old Permic (Abur) 
|
alphabet | 1390 | invented: St. Stephen of Perm | 3.11 | 29 | 38 | 71 |
| 82 | Oriya 
|
abugida | 1051 | Brahmi → Kalinga → | 2.89 | 34 | 44 | 101 |
| 83 | Oriya 
|
numeral | 1051 | Brahmi → Kalinga → | 1.50 | 15 | 10 | 10 |
| 84 | Oscan 
|
alphabet | −650 | Greek → Etruscan → | 2.71 | 14 | 21 | 28 |
| 85 | Pahawh Hmong 
|
alphabet (unusual) | 1959 | invented: Shong Lue Yang | 3.30 | 42 | 86 | 95 |
| 86 | Pahawh Hmong 
|
numeral | 1959 | invented: Shong Lue Yang | 2.50 | 15 | 10 | 30 |
| 87 | Parthian 
|
abjad | 100 | Aramaic → | 2.59 | 14 | 22 | 25 |
| 88 | Pashto 
|
abjad | 600 | Aramaic → Nabataean → Arabic → | 2.73 | 20 | 40 | 47 |
| 89 | ‘Phags-pa 
|
abugida | 1269 | Brahmi → Devanagari → Tibetan → | 4.53 | 21 | 40 | 56 |
| 90 | Phoenician 
|
abjad | −1250 | northern linear (Canaanite) → | 2.86 | 13 | 22 | 34 |
| 91 | Pollard Miao 
|
alphabet (unusual) | 1905 | invented: Samuel Pollard | 2.11 | 22 | 47 | 32 |
| 92 | Psalter 
|
abjad | 100 | Aramaic → | 2.00 | 19 | 21 | 28 |
| 93 | Redjang (Kaganga) 
|
abugida | 1350 | Brahmi → Pallava → Old Kawi → | 3.00 | 10 | 36 | 16 |
| 94 | Runic (Danish Futhark) 
|
alphabet | 800 | unknown | 2.63 | 10 | 16 | 21 |
| 95 | Runic (Elder Futhark) 
|
alphabet | 50 | unknown | 3.13 | 6 | 24 | 16 |
| 96 | Sabaean/Minean 
|
abjad | −500 | southern linear → Sabaean/Minean → | 3.55 | 12 | 29 | 28 |
| 97 | Samaritan 
|
abjad | −50 | Aramaic → Old Hebrew ??? → | 4.32 | 24 | 22 | 72 |
| 98 | Santali (Ol Cemet’) 
|
alphabet | 1920 | invented: Pandit Raghunath Murmu | 3.33 | 29 | 30 | 80 |
| 99 | Santali (Ol Cemet’) 
|
numeral | 1920 | invented: Pandit Raghunath Murmu | 1.40 | 11 | 10 | 7 |
| 100 | Sil’oti Nagri 
|
abugida | 1300 | invented: Saint Shahjalal | 3.33 | 28 | 34 | 69 |
| 101 | Somali (Osmanya) 
|
alphabet | 1922 | invented: Cismaan Kenadiid | 1.90 | 29 | 30 | 38 |
| 102 | Somali (Osmanya) 
|
numeral | 1922 | invented: Cismaan Kenadiid | 1.50 | 15 | 10 | 10 |
| 103 | Sorang Sompeng 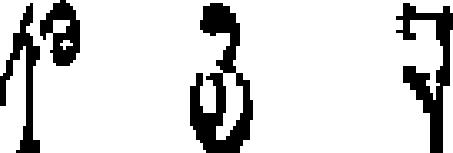
|
alphabet | 1936 | invented: Mangei Gomango | 2.29 | 34 | 24 | 58 |
| 104 | Sorang Sompeng 
|
numeral | 1936 | invented: Mangei Gomango | 1.40 | 12 | 10 | 8 |
| 105 | South Arabian 
|
abjad | −600 | southern linear → | 3.29 | 13 | 28 | 36 |
| 106 | Soyombo 
|
abugida | 1686 | invented: Bogdo Zanabazar | 3.63 | 27 | 35 | 88 |
| 107 | Syriac 
|
abjad | 400 | Aramaic → | 2.27 | 25 | 22 | 50 |
| 108 | Tagalog 
|
abugida | 900 | Brahmi → Pallava → Old Kawi → | 1.93 | 17 | 16 | 23 |
| 109 | Tagbanwa 
|
abugida | 900 | Brahmi → Pallava → Old Kawi → | 2.23 | 19 | 15 | 26 |
| 110 | Tamil 
|
abugida | −300 | Brahmi → | 2.74 | 29 | 34 | 62 |
| 111 | Thaana 
|
abugida | 1550 | invented: Unknown | 2.09 | 23 | 35 | 42 |
| 112 | Theban 
|
alphabet | 100 | invented: Unknown | 3.83 | 28 | 24 | 69 |
| 113 | Tifinagh 
|
abjad | −100 | Punic → Ancient Berber → | 2.88 | 13 | 25 | 23 |
| 114 | Umbrian 
|
alphabet | −350 | Greek → Etruscan → | 2.48 | 16 | 21 | 30 |
| 115 | Varang Kshiti 
|
alphabet | 1900 | invented: Lako Bodra | 2.86 | 17 | 21 | 26 |
2. Results
Suppose a writing system possesses B stroke types, and average character length L. We can model the number of characters, C, by an equation of the general form, C=σBβL, where σ, β≤1 are positive constants. The proportionality constant, σ, captures the fact that some fraction of the possible stroke combinations may not be allowed. The exponent βL is called the combinatorial degree, d, and measures how combinatorially strokes are used to build characters: a minimum value of d=1 would mean that strokes are not used combinatorially at all (i.e. because doubling the number of stroke types would only double the number of characters), and greater values (up to a maximum of L) mean that strokes are used more combinatorially. From the length, L, and combinatorial degree, d, we may compute the redundancy, R=1−(d/L), or R=1−β: a redundancy of zero means that all L potential degrees of freedom in building characters are used, and as the redundancy nears 1 the combinatorial degree falls lower and lower below L. For example, suppose that 0 s and 1 s can be strung together to make sequences of length 4, but that 0 s must always be placed next to a 0, and 1 s next to a 1. Although there are 24 =16 binary sequences of length 4, there are only C=4 sequences satisfying this constraint, namely 0000, 0011, 1100 and 1111. Here, σ=1 and β=1/2, so that C=4=1×2(1/2)4=σBβL. Intuitively, the constraints put on these sequences reduces the number of degrees of freedom from 4 down to 2, and thus the sequence length is twice as long as it ideally would have to be, corresponding to a redundancy of 1/2. The three properties—combinatorial degree d, length L, and redundancy R—are related such that any two are independent, and jointly determine the third via the equation R=1−(d/L). There are two qualitatively different ways that strokes could be combinatorially used to build characters (Changizi 2001, 2003a, b). The first is the universal stroke-type approach, where the number of stroke types does not vary as a function of writing system size, and greater numbers of characters are accommodated by increasing the length of characters. The second is the invariant-length approach, where character length is invariant, and greater numbers of characters are accommodated by increasing the number of stroke types from which characters are built.
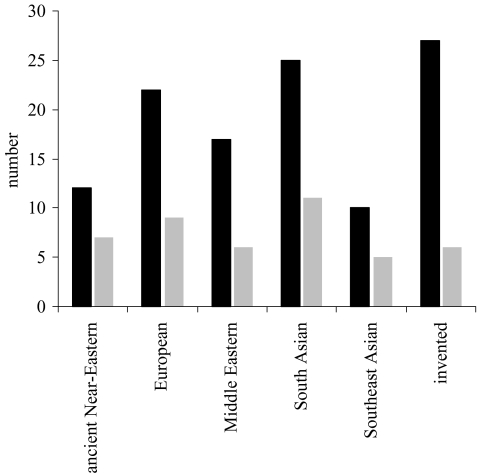
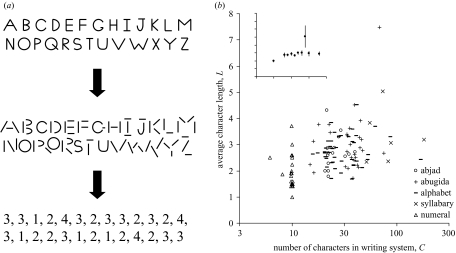
To test whether either of these two scaling approaches applies to writing systems, we measured average character lengths for all 115 writing systems in table 1 (see figure 1 for the distribution of classes of writing system). Figure 2a illustrates the manner in which characters are decomposed into strokes. Our first result is that writing systems appear to conform to the invariant-length approach (see figure 2b), with average lengths of approximately 3 (but with lower lengths of approximately 2 for number systems).
Figure 1.
Distribution of writing systems used in the study (see table 1) across the major phylogenetic classes (black bars), and also the number of sections devoted to the phylogenetic classes in Daniels & Bright (1996) The world’s writing systems, the most exhaustive book on the topic (grey bars). Among the major phylogenetic classes, the distributions are highly correlated (r2=0.81).
Figure 2.
(a) Illustration of the method for determining character lengths (i.e. the number of strokes per character). Each character is decomposed into separable strokes, where strokes are separated by discontinuities so that ‘U’ is one stroke but ‘V’ is two, and also stroke junctions are decomposed into their constituents so that ‘T’ and ‘X’ junctions possess two strokes, ‘Y’, ‘K’ and ‘Ψ‘ junctions possess three strokes, etc. Three nave observers were asked to decompose characters into strokes, and there were no disagreements. (b) Plot of average character length versus the number of characters (on a log scale), for 115 writing systems. Data are labelled by abjad (characters for consonants but not vowels), abugidas (characters for consonants and diacritic symbols for vowels), alphabets (characters for consonants and vowels), syllabaries (characters for syllables such as ‘ba’, ‘be’, ‘bi’, etc.) and numerals (characters for numbers). x-axis values have been randomly perturbed by ±1% to help distinguish the points on the plot. The average length is 2.79 for invented systems (a set of 38 independent writing systems) and 2.70 for non-invented systems. Inset: plot of the same data, and same axes, but average character lengths binned at 0.1 intervals along the x-axis (standard error bars shown). One can see that, except for number systems where the average length is approximately 2 (the average across the average lengths of the 22 numeral systems is 1.95, with standard error 0.14), the average character length does not appear to vary as a function of writing system size (the average across the average lengths of the 93 non-numeral systems is 2.91, with standard error 0.09). These data mean that human writing systems conform to the invariant-length approach to accommodating writing systems of greater size.
For the remainder of §2, we describe two distinct methods for estimating the combinatorial degree, d=βL. From the length, L, and combinatorial degree, d, we will be able to compute the redundancy, R=1−(d/L).
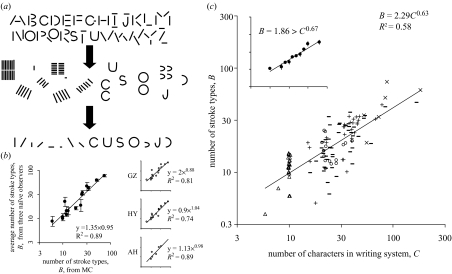
The first method of estimating combinatorial degree is to plot stroke-type repertoire size, B, as a function of writing system size, C, and measure the scaling exponent. Recall that C∝Bd. Thus, B∝C1/d, and the best-fit slope on a log-log plot of B versus C is an estimate of 1/d. Figure 3a illustrates the manner in which the stroke-type repertoire is determined, and figure 3b describes tests of repeatability. We let dBC denote estimates of the combinatorial degree via this first method. We report four estimates from the data, employing four different subscripts to distinguish between them—‘all’, ‘alpha’, ‘all,bin’ and ‘alpha,bin’—where the subscript ‘all’ means that all writing systems from table 1 are used in the estimate, ‘alpha’ means that only the non-number systems are used, and ‘bin’ means that the estimate is taken from a binned plot. Figure 3c shows the plot of all the data, and B∝C0.63, and thus dBC,all=1/0.63=1.60. The inset of figure 3c shows the binned version of all the data, and dBC,all,bin=1.49. Excluding numerals, the respective estimates are dBC,alpha=1.36 and dBC,alpha,bin= 1.33. These combinatorial degree estimates therefore range from 1.33 to 1.60. Given the average character lengths, the four corresponding redundancy estimates are: RBC,all=41%, RBC,all,bin=46%, RBC,alpha=53% and RBC,alpha,bin=56%.
Figure 3.
(a) Illustration of how the stroke-type repertoire is determined for a writing system. After the characters are decomposed into their constituent strokes (see figure 1a), the strokes are clustered near strokes that appear to be similar. Stroke types were determined by the primary author (M.C.) on the basis of high intra-cluster similarity in orientation, shape and length. (b) As a test of repeatability, three nave observers (G.Z., H.Y. and A.H.) were asked to determine the stroke-type repertoire for a wide variety of writing systems (G.Z. and H.Y. carried this out for Ancient Berber, Ahom, Albanian, Arabic, Arabic numerals, Aramaic, Armenian, Asomtavruli, Avestan, Hanuno’o, Cherokee, Hungarian Runes, Elder Futhark, Danish Futhark, Kpelle; and A.H. carried this out for just the first six). On the left is a log–log plot of the average stroke-type repertoire size measured by the three nave observers versus the estimates of M.C. Standard error bars are shown, as well as the best-fit (by linear regression) equation and line, and the correlation. One can see that the correlation is high and that the exponent relating them is approximately 1, meaning that nave observers’ estimates of stroke-type repertoire size scale in direct proportion to the estimates of M.C. The three plots on the right possess the same x-axis as the one on the left, but the y-axis now has each individual observer’s stroke-type estimates. The effects of systematic under- or over-counting (as seen for example in G.Z.) will affect the proportionality constant relating stroke-type repertoire size, B, to writing system size, C, but not the scaling exponent, which is what is of interest to us here. (c) Plot of number of stroke types versus number of characters for 115 writing systems. Circles, abjad; plus symbols, abugida; minus symbols, alphabet; crosses, syllabary; and triangles, numerical. The linear regression line and equation are shown, along with correlation. Data points on each axis have been perturbed by ±1% to aid in their discrimination. The best-fit relationship is B=3.18C0.57 for invented systems (a set of independent data), and B=2.31C0.60 for non-invented systems. Inset: same plot, and same axes, but stroke-type repertoire sizes binned at 0.1 intervals along the log C-axis (standard error bars shown).
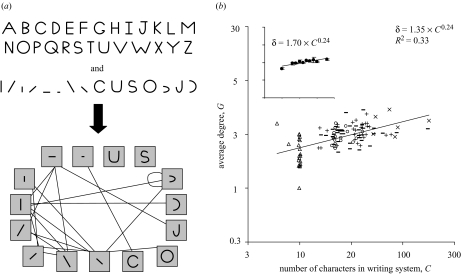
The second method for determining the combinatorial degree is via measuring how stroke-type ‘interactiveness’ changes with writing system size. We let ddeg denote estimates of the combinatorial degree via this second method. If strokes are used combinatorially, then in a larger writing system, any given stroke type must, on average, be able to interact with a greater number of stroke types. The degree, δ, of a stroke type is the total number of stroke-types with which the stroke type intersects, across all characters of the writing system (for cases of unconnected strokes, like the dot of an ‘i’, the stroke was deemed connected to the nearest stroke). Figure 4a illustrates the manner in which the stroke-type degree is determined. Figure 4b shows that the average stroke-type degree changes slowly with writing system size, consistent with a power law δ∝Cw: Scaling exponents via the four methods are wall=0.24, wall,bin=0.17, walpha=0.13, walpha,bin=0.10. From this it is possible to compute the combinatorial degree, as we now explain. How many characters can be built with length L? In writing a single character, there are B stroke types one may begin with, and for each of these there are, on average, δ many stroke types which may be drawn next, and for each of these, δ more, and so on until all L strokes have occurred in the character. Thus, the number of characters that can be built is C=BδL−1. Given that δ∝Cw, we can write C∝B(Cw)L−1, and solving for C, we have that C∝B1/[1−w(L−1)]. Therefore, the combinatorial degree can be estimated as ddeg=1/[1−w(L−1)], where w is the scaling exponent for stroke-type degree as a function of writing system size (see Changizi et al. (2002) for related observations). The four estimates of combinatorial degree using stroke-type degree scaling are ddeg,all=1.73, ddeg,all,bin=1.42, ddeg,alpha=1.32 and ddeg,alpha,bin=1.26. These combinatorial degree estimates therefore range from 1.26 to 1.73, similar to the range of 1.33 to 1.60 that we found earlier via the first method. The corresponding redundancies are Rdeg,all=36%, Rdeg,all,bin=49%, Rdeg,alpha=54% and Rdeg,alpha,bin=58%.
Figure 4.
(a) Illustration of how a stroke-type network is built from the character repertoire and stroke type repertoire. Each stroke type is represented as a node in the network, and two stroke types are connected just in cases where those stroke types intersect in some character of the writing system; intuitively, stroke types sharing an edge in the network have the ability to ‘interact’. When a stroke does not intersect other strokes of a character—like the dot of an ‘i’—the stroke is deemed to intersect the physically nearest stroke. (b) Log–log plot of average stroke-type degree versus number of characters for 115 writing systems. Circles, abjad; plus symbols, abugida; minus symbols, alphabet; crosses, syllabary; and triangles, numerical. The linear regression line and equation are shown, along with correlation. x-axis values have been perturbed by ±1% to aid in their discrimination. The best-fit relationship is δ=1.40C0.22 for invented systems (a set of independent data), and δ=1.16C0.30 for non-invented systems. Inset: same plot, and same axes, but stroke-type degrees binned at 0.1 intervals along the log C-axis (standard error bars shown).
3. Discussion
We found that writing systems have average character lengths of approximately 3 (number systems being the exception, with an average of approximately 2). And, via two distinct kinds of measurement and analysis, we found that the combinatorial degrees for writing systems are very approximately 3/2, and redundancies ca. 50%. Importantly, these values appear to not much vary as a function of writing system size. Because the combinatorial degree is significantly above 1, it means that writing systems use strokes in a genuinely combinatorial fashion (i.e. doubling the number of strokes more than doubles the number of characters, because C∝B3/2). However, although writing systems are combinatorial, they are not very combinatorial, because the combinatorial degree of 3/2 is not much greater than 1. Because average character lengths are approximately 3, the maximum possible combinatorial degree is 3. Because only approximately half of the total possible degrees of freedom is used, the redundancy is ca. 50%. Characters therefore tend to be about twice as long (in number of strokes) as they need to be. Alternatively, the combinatorial degree could be twice what it is, which would allow the number of stroke types to grow much more slowly as a function of writing system size (namely as the cube root) than they in fact do. These results may have implications for the future design of writing systems.
4. Conclusion
Writing systems are under selective pressure to be easy to read and write, but there are reasons to think that the principal pressure is for ease of reading. First, text is written only once, whereas it may be read arbitrarily many times. The utilities due to reading will accordingly be amplified relative to that for writing. Many writing systems throughout history, however, were not read to the extent that contemporary writing systems are, and this argument will not apply as strongly to such writing systems. Second, cursive scripts and shorthand are two classes of writing system where selection is primarily driven by writing optimization, and in these cases the characters are qualitatively very different compared with those of the typical writing system, and are more difficult to read. Third, and last, typeface and computer fonts are two classes of script where there is no selective pressure for writing at all, and characters in these scripts are qualitatively quite similar to those of the typical writing system. None of these above arguments alone is strong, but together they give us some reason to suspect that the principal selective pressure on most writing systems may come from vision. Assuming this, we ask, is there something about these fundamental properties of writing systems that might be ‘good’ for the visual system?
Consider redundancy first. Because character recognition requires recognizing the strokes (Pelli et al. 2004), and because strokes tend have small angular size and high shape variability, some redundancy is useful so that misrecognition of one or two strokes does not necessarily lead to misrecognition of the character. Why should the visual system prefer character lengths of approximately 3? The value of 3 naturally suggests the ‘subitizing limit’, which is the number of objects that can be stored in visual short term memory, and is often put at roughly 3 (e.g. Trick & Pylyshyn 1994; Vogel et al. 2001). That is, perhaps there are, on average, three strokes per character, independent of writing system size, because all the strokes can be simultaneously processed, whereas processing times increase substantially for greater than around three objects. It has been thought that this may underly why number systems tend to represent ‘1’ by one stroke, ‘2’ by two strokes, and ‘3’ by three strokes, but this stops for greater numbers (Ifrah 1985; Zhang & Norman 1995; Dehaene 1997). The combinatorial degree value of 3/2, and the connected rate at which the number of stroke types increases with writing system size (namely as the 3/2 power), would be a consequence of the redundancy and subitizing limit.
A distinct possible kind of explanation for the average length of 3 concerns bottom-up, hierarchical processing of characters (A. Hampton, private communication). Imagine a lower-level retinotopic map in visual cortex, where the L strokes of a character are simultaneously recognized in L nearby regions of the cortex. Suppose also that multiple nearby regions in the lower level connect in a feed-forward fashion to a single region of the upper-level retinotopic area. A single upper-level region could integrate only from as many lower-level regions as connect to it, and perhaps character length L would be constrained by this. Supposing that multiple lower-level regions feed-forward to an upper-level region if and only if the lower-level regions are all mutually adjacent, and assuming that regions are hexagonally packed in neocortex, each upper-level region will integrate exactly three mutually adjacent lower-level regions, which would cohere with the average length of L≈3.
Another intriguing possibility is that there is a fundamental ecological explanation for these writing system features. The visual system has been selected to quickly recognize objects, and many objects are built from object junctions of various kinds, which are themselves built out of contours of various types. Could it be that writing systems have been selected to have characters that can be recognized using the already-existing object recognition mechanisms? Intuitively, strokes are contour-like, and characters are object-junction-like, object junctions typically possessing approximately three intersecting contours (e.g. Clowes 1971; Huffman 1971; Chakravarty 1979). Might it be more than a coincidence that object junctions are well described as ‘T’, ‘L’, ‘X’, ‘Ψ’, ‘K’ and ‘Y’ junctions? A test of this hypothesis is the subject of ongoing research (Changizi et al. 2004).
Acknowledgments
We thank Dan Ryder, Wei Ji Ma, Patrick Wilken, Alan Hampton and two reviewers for their comments. We also thank Andrew Hsieh, Hao Ye and Qiong Zhang for independently parsing into stroke types a variety of writing systems.
References
- Ager S. 1998. Omniglot: a guide to writing systems. See http://www.omniglot.com. [Google Scholar]
- Chakravarty I. A generalized line and junction labeling scheme with applications to scene analysis. IEEE Trans. Pattern Analysis Machine Intell. 1979;1:202–205. doi: 10.1109/tpami.1979.4766906. [DOI] [PubMed] [Google Scholar]
- Changizi M.A. Universal scaling laws for hierarchical complexity in languages, organisms, behaviors and other combinatorial systems. J. Theor. Biol. 2001;211:277–295. doi: 10.1006/jtbi.2001.2346. [DOI] [PubMed] [Google Scholar]
- Changizi M.A. The relationship between number of muscles, behavioral repertoire, and encephalization in mammals. J. Theor. Biol. 2003a;220:157–168. doi: 10.1006/jtbi.2003.3125. [DOI] [PubMed] [Google Scholar]
- Changizi M.A. Kluwer; Dordrecht, The Netherlands: 2003b. The brain from 25000 feet: high level explorations of brain complexity, perception, induction and vagueness. [Google Scholar]
- Changizi M.A., McDannald M.A., Widders D. Scaling of differentiation in networks: nervous systems, organisms, ant colonies, ecosystems, businesses, universities, cities, electronic circuits, and Legos. J. Theor. Biol. 2002;218:215–237. doi: 10.1006/jtbi.2002.3070. [DOI] [PubMed] [Google Scholar]
- Changizi, M. A., Zhang, Q., Ye, H. & Shimojo, S. 2004 The structures of letters and symbols throughout human history are selected to match those found in objects in natural scenes. (Submitted.) [DOI] [PubMed]
- Chen Y.P., Allport D.A., Marshall J.C. What are the functional orthographic units in Chinese word recognition: the stroke or the stroke pattern? Q. J. Exp. Psychol. A Hum. Exp. Psychol. 1996;49:1024–1043. [Google Scholar]
- Clowes M.B. On seeing things. Artificial Intell. 1971;2:79–116. [Google Scholar]
- Daniels P.T., Bright B. The world’s writing systems. Oxford University Press; New York: 1996. [Google Scholar]
- Dehaene S. The number sense: how the mind creates mathematics. Oxford University Press; 1997. [Google Scholar]
- Huffman D.A. Impossible objects as nonsense sentences. In: Meltzer B., Michie D., editors. Machine intelligence. vol. 6. Elsevier; New York: 1971. pp. 295–323. [Google Scholar]
- Ifrah G. From one to zero: a universal history of numbers. Viking Press; New York: 1985. [Google Scholar]
- Pelli, D. G., Burns, C. W., Farell, B. & Moore, D. C. 2004 Identifying letters. Vision Res. (In the press.)
- Trick L.M., Pylyshyn Z.W. Why are small and large numbers enumerated differently? A limited-capacity preattentive stage in vision. Psychol. Rev. 1994;101:80–102. doi: 10.1037/0033-295x.101.1.80. [DOI] [PubMed] [Google Scholar]
- Vogel E.K., Woodman G.F., Luck S.J. Storage of features, conjunctions, and objects in visual working memory. J. Exp. Pscyhol. Hum. Percept. Perform. 2001;27:92–114. doi: 10.1037//0096-1523.27.1.92. [DOI] [PubMed] [Google Scholar]
- Yeh S.L., Li J.L. Sublexical processing in visual recognition of Chinese characters: evidence from repetition blindness for subcharacter components. Brain and Language. 2004;88:47–53. doi: 10.1016/s0093-934x(03)00146-9. [DOI] [PubMed] [Google Scholar]
- Zhang J., Norman D.A. The representation of numbers. Cognition. 1995;57:271–295. doi: 10.1016/0010-0277(95)00674-3. [DOI] [PubMed] [Google Scholar]


