

Abstract
Adjacent speech, and even nonspeech, contexts influence phonetic categorization. Four experiments investigated how preceding sequences of sine-wave tones influence phonetic categorization. This experimental paradigm provides a means of investigating the statistical regularities of acoustic events that influence online speech categorization and, reciprocally, reveals regularities of the sound environment tracked by auditory processing. The tones comprising the sequences were drawn from distributions sampling different acoustic frequencies. Results indicate that whereas the mean of the distributions predicts contrastive shifts in speech categorization, variability of the distributions has little effect. Moreover, speech categorization is influenced by the global mean of the tone sequence, without significant influence of local statistical regularities within the tone sequence. Further arguing that the effect is strongly related to the average spectrum of the sequence, notched noise spectral complements of the tone sequences produce a complementary effect on speech categorization. Lastly, these effects are modulated by the number of tones in the acoustic history and the overall duration of the sequence, but not by the density with which the distribution defining the sequence is sampled. Results are discussed in light of stimulus-specific adaptation to statistical regularity in the acoustic input and a speculative link to talker normalization is postulated.
I. INTRODUCTION
The fluency of speech communication makes it a rarity for any particular speech sound to be present without context. Many studies have confirmed that the nature of adjacent context greatly influences how speech is categorized (for a review, Repp, 1982). For example, following /al/, listeners identify speech targets more often as “ga” than “da” whereas, following /ar/, the same speech targets are more often identified as “da” (Mann, 1980). Lotto et al. 1997 found that Japanese quail (Coturnix coturnix japonica) trained to peck a key in response to /ga/ or /da/ exhibit context-dependent responses when /al/ or /ar/ precede novel test tokens along a /ga/ to /da/ series. Quail trained to peck to /ga/ respond more vigorously when /al/ precedes novel test syllables. Thus, it appears that context-dependent response to speech is not species specific, implicating instead rather general auditory processing.
Results with human adult listeners support this possibility. When nonspeech sine wave tone contexts with spectra modeling the third-formant (F3) offset frequency of /al/ and /ar/ precede /ga/ to /da/ targets, context-dependent speech categorization shifts are observed that mirror the effects produced by /al/ and /ar/ speech contexts. Other studies have verified the generality of this finding (for a brief review, see Lotto and Holt, 2006). Nonspeech context effects on speech categorization have been observed with nonspeech analogs of consonant contexts affecting categorization of consonants (Fowler et al., 2000; Lotto et al., 2003; Lotto and Kluender, 1998) and vowels (Holt et al., 2000). Nonspeech models of vowel contexts also influence consonant targets (Coady et al., 2003; Holt, 1999). Steady-state and frequency-modulated sine-wave tones, single formant harmonic stimuli, and bandpass noise have each been effective as nonspeech contexts in shifting speech categorization. Moreover, the interactions of speech and nonspeech signals are reciprocal; speech precursors also influence perception of nonspeech targets (Stephens and Holt, 2003). Finally, like observed context dependencies among speech contexts and targets, later-occurring nonspeech contexts influence perception of preceding speech (Wade and Holt, 2005a). Language-independent auditory processes may also contribute to compensation for phonological assimilation (Gow, 2003; Mitterer et al., 2006).
Thus, there is mounting evidence that speech is perceived relative to the characteristics of neighboring sounds, whether speech or nonspeech, and therefore without respect to whether the signals originate from a vocal-tract source (see also Holt, 1999; Lotto and Kluender, 1998). When nonspeech contexts possess spectra similar to the speech contexts they model, they are effective in producing effects of context on speech categorization. This perceptual pattern has been described as spectral contrast in that higher-frequency context stimuli (e.g., /al/ or the nonspeech tones that model it) shift perception toward lower frequency targets (i.e., /ga/; Lotto and Kluender, 1998). It does not appear that speech-specific information is necessary to elicit context-dependent phonetic categorization. Rather, the body of evidence suggests a role for more general perceptual mechanisms. These studies thus serve as an example of how studies of context effects on phonetic categorization can be informative about speech processing.
Reciprocally, the generality of phonetic context effects suggests it may be possible to use context-dependent phonetic categorization as a means of understanding auditory processing, generally speaking. Using listeners’ context-dependent phonetic categorization as an index, it is possible to investigate how different signals interact in auditory processing. In this way, phonetic categorization can serve as a platform from which to address general perceptual questions via manipulation and control of the context stimuli. The present experiments exploit this possibility.
A. Auditory sensitivity to acoustic distributions
It is now quite well established that auditory processing is sensitive to a variety of regularities within the acoustic environment. Human adult (Saffran et al., 1996), infant (Saffran et al., 1996), and nonhuman (Hauser et al., 2001) listeners are able to use transitional probabilities to segment running speech streams as well as streams of nonspeech acoustic elements (Saffran et al., 1999). Adult and infant listeners appear to be sensitive to frequency distributions of phonetic exemplars (Maye et al., 2002). Video-game players are able to extract higher-dimensional acoustic cues in aid of auditory categorization in the course of game play (Wade and Holt, 2005b). In each of these cases, experienced regularity in the acoustic input shapes subsequent auditory perception, including phonetic perception. However, within the environment, there are an infinite number of statistics that might be tracked by perceptual systems. Therefore, it is of much interest to understand the perceptual and cognitive constraints that may be imposed upon the processing of regularity from the perceptual world and the learning that may result from it. Because novel nonspeech acoustic contexts can be so readily defined in entirely statistical terms, their influence on phonetic categorization affords an opportunity to carefully manipulate and control the regularity in the acoustic environment and to observe the effects of this regularity on speech processing. The present experiments make use of the effect of nonspeech contexts on phonetic categorization as a means by which to investigate the bounds of perceptual sensitivity to statistical regularity in the input in an effort to zero in on the regularities in acoustic context that are important for online speech perception.
For example, is auditory processing sensitive only to interactions among temporally adjacent acoustic events as in the examples above (Lotto and Kluender, 1998; Holt et al., 2000)? Or, rather, is it also responsive to distributional regularities among multiple acoustic events that unfold across time? Taking a hint from speech processing, there is some long-standing evidence that may be characteristic of such sensitivity. In a classic study, Ladefoged and Broadbent (1957) manipulated the formant frequencies of a sentence preceding a target word that could be perceived as bit, bet, bat, or but. These manipulations to the precursor sentence affected the way listeners categorized the final target word, producing context effects such that the target word was identified differently as the formant frequencies of the preceding sentence changed. The spectral manipulations to the formant frequencies of the precursor sentence created a perceived change in voice characteristics, making it sound like different speakers uttered the sentence. Accordingly, these results have been interpreted as an instance of perceptual normalization for speaker characteristics (e.g., Repp, 1982). However, the overall distributions of spectral energy in the precursor sentence also shifted as the formant frequencies were manipulated. Thus, the effect of precursor on identification of the final word might be described also as an effect of varying distributions of spectral energy on perception of the final word. If listeners are sensitive to the long-term regularity of the spectral distributions of acoustic energy, it may affect phonetic categorization.
There is some evidence that supports this latter possibility. Watkins and Makin (1994) conducted a series of studies similar to those of Ladefoged and Broadbent (1957), demonstrating that the effect of preceding sentence on speech categorization persists even when the context sentence is played backwards and even when it is replaced by noise that matches the long-term spectra of the context sentence. These results are consistent with findings on perceptual compensation for spectral distortion in transmission channels (Darwin et al., 1989; Kiefte and Kluender, 2001; Watkins, 1991; Watkins and Makin, 1996) in which categorization of a speech target is shifted by filtering the context sentence. The target sound is heard as if it were filtered with the inverse of the filter shape applied to the context. They are also consistent with recent reports of the effects of context on perceptual normalization of lexical tone (Francis et al., 2006). In all of these experiments, perception of the target sound appears to be relative to and contrastive with context. This is precisely the pattern of perception required for producing the effects observed by Ladefoged and Broadbent and presumed to relate to speaker normalization.
Extending the principle that context-dependent phonetic categorization may be a useful index of the types of acoustic information of significance in auditory processing and, taking a cue from the influential findings of Ladefoged and Broadbent (1957), Holt (2005) tested explicitly whether listeners are sensitive to statistically defined distributions of acoustic energy. Like the Ladefoged and Broadbent (1957) study, these experiments manipulated the spectral distribution of energy across sentence-length precursors. However, the spectral distributions were sampled not with shifted formant frequencies, but with purely nonspeech sine wave tones. As such, there was no information for any particular speaker or vocal source or any information about speech whatsoever. The question of interest was whether phonetic categorization of speech syllable targets shifts as a function of the characteristics of the spectral distributions sampled by the sequences of sine wave tones. If so, it would suggest that auditory processing is sensitive to statistical distributions of acoustic energy that unfold across time and that, moreover, this sensitivity can play a role in phonetic categorization—perhaps accounting for some of the perceptual shifts that have been attributed to speaker normalization processes.
In these experiments, 22 70-ms sine-wave tones were presented sequentially across 2.2 s. These tones were followed by a speech target stimulus drawn from a series ranging perceptually from /ga/ to /da/. Figure 1(a) depicts the construction of the stimuli. Twenty-one tones formed an “acoustic history” that preceded the speech targets. The frequencies of these tones were drawn from distributions that differentially sampled the acoustic spectrum such that spectral distribution characteristics differentiated conditions. A low mean condition with an 1800-Hz mean sampled 1300–2300 Hz. A high mean condition with a 2800-Hz mean sampled 2300–3300 Hz. These distribution means modeled the spectral characteristics of the tones Lotto and Kluender (1998) found to be effective in shifting listeners’ /ga/-/da/ speech categorization responses. Within the acoustic history distributions, tones were equally probable (presented once per stimulus) and were sampled in 50-Hz steps. The tones of the acoustic histories were presented sequentially; 30 ms of silence separated tones. The sequence of tones comprising the acoustic history was reordered on each trial of the experiment; thus, each trial was a unique stimulus and idiosyncrasies of particular tone orderings could not account for any observed effects on phonetic categorization. Finally, each acoustic history ended in a 2300-Hz standard tone that was found, in a pilot experiment, to have no effect on labeling the /ga/ to /da/ targets (Holt, 2005). This prevented any observed context effects from originating from adjacent interactions of acoustic stimuli such as those described by Lotto and Kluender (1998).
FIG. 1.
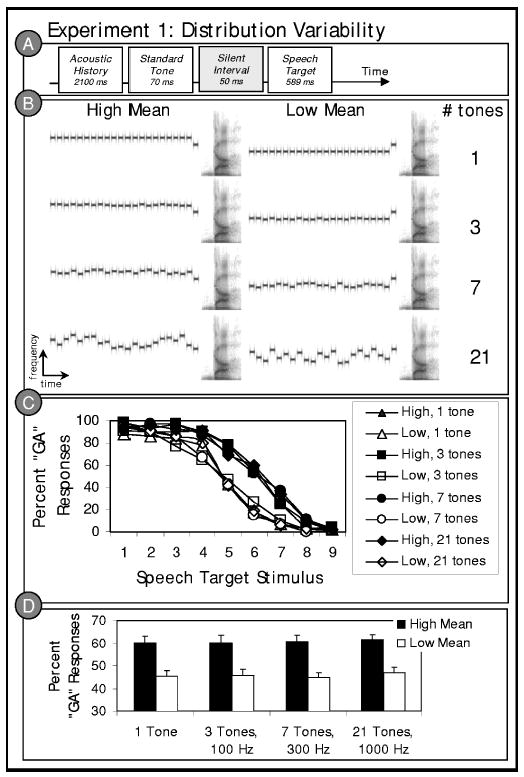
Stimulus structure and results of experiment 1. (a) Schematic illustration of the experiment 1 stimulus structure based on the paradigm of Holt (2005); (b) a representive stimulus spectrogram from each of the eight (2 Mean×4 Variability) conditions; (c) listeners’ average “ga” categorization responses to the /ga/ to /da/ series stimuli in the context of preceding high and low mean acoustic histories with 1 tone at the mean frequency, 3 tones sampling 100 Hz around the mean frequency, 7 tones sampling 300 Hz around the mean frequency, or 21 tones sampling 1000 Hz around the mean frequency; and (d) average “ga” categorization responses collapsed across the target stimulus series as a function of the distribution characteristics of the acoustic history precursors.
Holt (2005, 2006) reports that these statistically defined acoustic contexts exert a strong contrastive influence on phonetic categorization. Sequences of tones drawn from the high mean acoustic history distribution result in more “ga” responses (i.e., the target characterized by greater low-frequency energy) whereas the same speech targets are more often labeled as “da” when preceded by tone sequences drawn from the low mean distribution. Further studies demonstrate that the influence of the acoustic histories does not depend on temporal adjacency with the speech target. Even when the acoustic histories are separated from the speech targets by 1.3 s of silence or by 13 repetitions of the standard tone (across 1.3 s), the acoustic histories elicit a context effect on speech categorization (Holt, 2005). For these effects to emerge, the auditory system must exhibit sensitivity to the distributional characteristics of acoustic events emerging across time. The precise characteristics of the sequences varied on a trial-by-trial basis; the distribution characterizes the influence of the acoustic histories on speech categorization. The implication of these studies is that the auditory system may “tune” or calibrate its response to spectral characteristics of the acoustic environment such that speech processing is thoroughly context dependent and relative to the distribution of acoustic energy present across some preceding temporal window, even if the energy across that window is nonspeech.1
The Holt (2005) results implicate the distribution mean as an important determiner of the influence of statistical regularity on auditory perceptual processing. However, it is not yet known the extent to which other distribution characteristics play a role. The present experiments extend the principle of using phonetic context effects as an empirical index of auditory processing to examine the kinds of distributional information to which listeners exhibit sensitivity in online speech processing. Experiment 1 investigates whether listeners are sensitive to distribution variance by examining whether phonetic context effects produced by the acoustic history distribution means are modulated also by the variability of the distributions across the spectrum. Experiment 2 seeks to understand what information contributes to the overall distribution, specifically whether the auditory system exhibits sensitivity to local as well as global regularities in acoustic history distributions. The results of each of the first two experiments underscore the significance of the mean of the distribution of spectral energy in predicting effects on phonetic categorization. Therefore, experiment 3 explicitly tests the consequent hypothesis that spectral complements of the acoustic histories should produce a complementary effect on phonetic categorization. Finally, in two parts, experiment 4 attempts to tease apart how much information the auditory system requires to exhibit sensitivity to a distribution and whether the sampling density and/or duration of this information modulates its effect on phonetic categorization. Each of the experiments manipulates the distribution characteristics of the nonspeech acoustic history precursors on phonetic categorization to attempt to understand the boundaries of and constraints on online auditory processing of statistical regularity in the acoustic environment. The experiments address multiple questions of how distribution characteristics of context stimuli influence phonetic categorization. They are bound together in that their results converge on the conclusion that the mean of the distribution of preceding acoustic energy matters in auditory processing. Statistical regularity in the acoustic environment is tracked and employed in evaluating incoming acoustic signals; acoustic signals appear to be perceived relationally and contrastively with respect to the distribution mean of preceding acoustic energy. For each of the observed effects, listeners’ speech categorization is robustly influenced by the mean of the acoustic history distribution of nonspeech sounds that precede the speech target.
II. EXPERIMENT 1
In investigating which types of acoustic regularity are important for speech processing, distribution variability is an obvious candidate. The results reported by Holt (2005) hint that distribution variability may be important in modulating the context effects on speech categorization produced by acoustic histories. In addition to the high (2800 Hz) and low (1800 Hz) mean experimental conditions, Holt (2005) tested two control conditions with middle mean acoustic history means of 2300 Hz preceding the speech targets. The two control conditions differed from one another only in the variability of the distributions from which the tones composing them were drawn. One condition sampled a frequency distribution equivalent to the 1000-Hz ranges sampled by the high and low mean experimental conditions. The other sampled the joint range of the high and low mean conditions taken together, 2000 Hz. Therefore, the variability of the distributions distinguished the two control conditions. Holt reported a small, statistically insignificant shift in speech categorization as a function of the distribution variability such that there were somewhat more “ga” responses when the middle mean acoustic histories had greater distribution variability. It is unclear whether this shift was perceptually meaningful as it was considerably smaller than the shifts observed as a function of distribution mean. Therefore, experiment 1 explicitly manipulates the variability of the sound distributions over a greater frequency range and across the experimental high and low mean conditions to explicitly test whether acoustic history distribution variability influences speech categorization.
A. Methods
1. Participants
Ten volunteers from Carnegie Mellon University participated for course credit or a small payment. All listeners reported normal hearing and were monolingual native English speakers.
2. Stimuli
Stimulus design is illustrated in Fig. 1(a). For each stimulus an acoustic history composed of 22 sine-wave tones [21-tone acoustic history plus standard tone at 2300 Hz, as in the Holt (2005) experiments] preceded a 50-ms silent interval and a speech target drawn from a stimulus series varying perceptually from /ga/ to /da/.
a. Speech targets
The nine speech target stimuli were identical to those reported in earlier studies (Holt, 2005, 2006; Wade and Holt, 2005a). The stimuli were derived from natural /ga/ and /da/ recordings from a monolingual male native English speaker (Computer Speech Laboratory, Kay Elemetrics, Lincoln Park, NJ; 20-kHz sampling rate, 16-bit resolution). Multiple natural productions of the syllables were recorded and, from this set, one /ga/ and one /da/ token were selected that were nearly identical in spectral and temporal properties except for the onset frequencies of F2 and F3. LPC analysis was performed on each of these tokens and a nine-step series of filters was created to span these endpoints (Analysis-Synthesis Laboratory, Kay Elemetrics) such that the onset frequencies of F2 and F3 varied approximately linearly between /g/ and /d/ endpoints. These filters were excited by the LPC residual of the original /ga/ production to create an acoustic series spanning the natural /ga/ and /da/ endpoints in approximately equal steps. The series was judged by the experimenter to shift between natural-sounding /ga/ and /da/ tokens and this impression was confirmed by regular shifts in phonetic categorization across the series by participants in previous studies (Holt, 2005, 2006; Wade and Holt, 2005a). Each stimulus was 589 ms in duration. These speech series members served as categorization targets. Figure 2 shows spectrograms for five series members. Note that creating stimuli using LPC analysis in this way provides the advantage of very natural-sounding tokens, but sound-source separation may be imperfect. The perceptual results from previous experiments using these stimuli proved quite clear, so this potential concern is allayed for the present stimulus set.
FIG. 2.
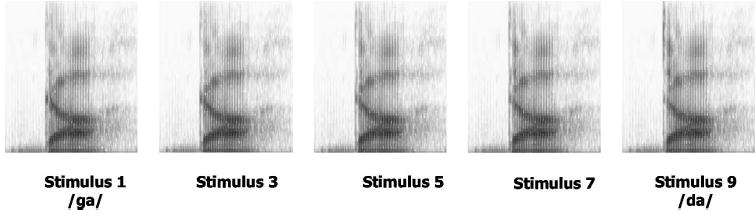
Spectrograms of five representative speech target stimuli along the nine-step series.
b. Nonspeech acoustic histories
The tone sequences making up the acoustic histories were created in the same manner as described by Holt (2005), but the distribution variability was explicitly manipulated across conditions. Eight acoustic history distributions defined eight experiment conditions. These distributions were defined by two means, low (1800 Hz) and high (2800 Hz), equivalent to those of Holt (2005). Each of these distribution means was paired with four variability manipulations: 21 unique tone frequencies sampling 1000 Hz in 50-Hz steps; 7 unique tone frequencies sampling 300 Hz in 50-Hz steps (repeated three times each for 21 total tones); 3 unique tone frequencies sampling 100 Hz in 50-Hz steps (repeated seven times each for 21 total tones); or 1 tone at the mean frequency repeated 21 times. For each stimulus, the 21 tones sampling the acoustic history distribution were followed by a 2300-Hz standard tone.
Tones comprising the acoustic histories were synthesized with 16-bit resolution and sampled at 10 kHz using MATLAB (Mathworks, Inc.). Each tone was 70 ms with 5-ms linear onset/offset amplitude ramps. Each tone was followed by 30 ms of silence. As in previous experiments, the order of the tones making up the acoustic history sequence was randomized on a trial-by-trial basis to minimize effects elicited by any particular tone ordering (except, of course, in the case of the 1-tone condition). Consequently, for the 21-, 7-, and 3-tone conditions, each trial was unique; acoustic histories within a condition were distinctive in surface acoustic characteristics, but were statistically consistent with other stimuli drawn from the acoustic history distribution defining the condition. Thus, any influence of the acoustic histories on speech categorization is indicative of listeners’ sensitivity to the long-term spectral distribution of the acoustic history and not merely to the simple acoustic characteristics of any particular segment of the acoustic history. Target speech stimuli were digitally down-sampled to 10 kHz from their recording rate of 20 kHz and tones and speech tokens were digitally matched to the rms energy of the /da/ endpoint of the target speech series. A 50-ms silent interval separated the acoustic history plus standard tone sequence and the speech target. Figure 1(a) provides a schematic illustration of stimulus construction and Fig. 1(b) shows a representative stimulus from each condition.
Except for the 1-tone variability conditions, the speech targets were paired with ten unique acoustic histories sampled from the distribution defining the condition to create ten unique repetitions. Stimuli from the conditions with 1-tone variability were repeated ten times each in the experiment. In all, there were 720 stimuli (2 means, 4 variabilities, 9 speech targets, 10 repetitions).
3. Procedure
Seated in individual sound-attenuated booths, listeners categorized the speech target of each stimulus by pressing electronic buttons labeled “ga” and “da.” Listeners heard stimuli from each of the eight conditions (720 stimuli) mixed across a single session; each listener responded to stimuli from each condition.
Acoustic presentation was under the control of Tucker Davis Technologies System II hardware; stimuli were converted from digital to analog, low-pass filtered at 4.8 kHz, amplified, and presented diotically over linear headphones (Beyer DT-150) at approximately 70 dB SPL(A).
B. Results
Figure 1(c) illustrates listeners’ average categorization responses as a function of the acoustic history distribution mean and variability. Figure 1(d) shows the means of the conditions, collapsed across the speech target stimulus series. A 2×4 (mean×variability) repeated measures ANOVA of the percent “ga” responses averaged across the speech target stimulus series revealed a robust effect of acoustic history distribution mean on speech categorization, F(1, 9) = 29.86, p<0.0001, = 0.768. Replicating Holt (2005, 2006), listeners more often identified the speech targets as “ga” when the targets were preceded by high mean acoustic histories. However, there was no effect of acoustic history distribution variability on speech categorization, F(3, 27) = 1.10, p= 0.365, = 0.109. There also was no difference in the effect of acoustic history means across variability conditions, as indicated by the lack of an interaction between acoustic history distribution mean and variability, F<1. Condition means are presented in Table I.
TABLE I.
Summary statistics for individual conditions.
| Main effect acoustic history mean (High versus low)
|
||||||||
|---|---|---|---|---|---|---|---|---|
| Experiment | No. of tones overall | No. of unique tone frequencies | Range of tone frequencies (Hz) | Mean “ga” high (SE) | Mean “ga” low (SE) | F | p≤ | |
| 1 | 21 | 1 | 1 tone | 60.22 (2.89) | 45.44 (2.48) | 28.32 | 0.0001 | 0.759 |
| 21 | 3 | 100 | 60.22 (3.31) | 45.67 (2.94) | 18.11 | 0.002 | 0.668 | |
| 21 | 7 | 300 | 60.89 (2.73) | 44.78 (2.28) | 27.40 | 0.001 | 0.753 | |
| 21 | 21 | 1000 | 61.67 (2.23) | 47.00 (2.25) | 28.95 | 0.0001 | 0.763 | |
| 2 | 21 | 21 HHH vs. LLL | 1000 | 63.60 (3.07) | 38.1 (2.90) | 137.98 | 0.000 | 0.939 |
| 3 | 21 | 21 tones | 1000 | 52.17 (2.62) | 44.17 (4.05) | 19.42 | 0.002 | 0.684 |
| 21 | 21 notched noise | 1000 | 49.33 (2.36) | 52.44 (2.30) | 5.72 | 0.04 | 0.388 | |
| 4a | 3 | 3 | 1000 | 55.67 (1.36) | 50.56 (2.40) | 4.78 | 0.05 | 0.347 |
| 5 | 5 | 1000 | 57.56 (1.15) | 53.11 (1.35) | 28.8 | 0.0001 | 0.762 | |
| 6 | 6 | 1000 | 57.33 (1.52) | 48.56 (1.75) | 26.88 | 0.001 | 0.749 | |
| 7 | 9 | 1000 | 57.889 (1.68) | 48.33 (1.34) | 25.96 | 0.001 | 0.743 | |
| 11 | 11 | 1000 | 59.56 (1.20) | 46.44 (1.58) | 83.77 | 0.0001 | 0.903 | |
| 21 | 21 | 1000 | 62.67 (1.51) | 46.56 (1.61) | 162.43 | 0.0001 | 0.947 | |
| 26 | 26 | 1000 | 61.44 (1.97) | 45.44 (1.69) | 46.38 | 0.0001 | 0.837 | |
| 4b | 3 | 3 | 1000 | 58.25 (1.73) | 58.96 (2.13) | <1 | n.s. | 0.013 |
| 9 | 3 | 1000 | 60.87 (2.03) | 57.78 (1.68) | 4.44 | 0.05 | 0.254 | |
| 15 | 3 | 1000 | 61.75 (2.71) | 56.75 (1.93) | 4.50 | 0.05 | 0.257 | |
| 21 | 3 | 1000 | 62.62 (2.39) | 54.37 (2.17) | 17.15 | 0.001 | 0.569 | |
| 21 | 21 | 1000 | 64.44 (2.71) | 53.97 (1.84) | 18.19 | 0.001 | 0.583 | |
Although auditory processing shows sensitivity to the mean of a sequence of tones drawn from a spectral distribution, changes in the variability of the distribution did not influence the magnitude of the effect of acoustic histories on speech categorization. It appears that the auditory system does not track the variability of the acoustic distribution as it unfolds or, if it does, it does not play a significant role in producing spectral contrast between contexts and speech targets in this paradigm. It remains possible, of course, that distribution variability may be found to play a significant role in other aspects of speech processing. It has already been implicated, for example, in phonetic category learning in human infants (Maye et al., 2002) and a nonhuman avian species (Kluender et al., 1998). Here, there is considerable evidence for sensitivity to the mean of the distribution, but the variability of the distribution matters remarkably little. The perceptual effect of acoustic histories on speech categorization was statistically indistinguishable whether a single tone at the mean frequency was repeated 21 times or whether 21 unique tones sampling a range of 1000 Hz with the same mean preceded the speech target.
It is interesting to note that this lack of an influence of distribution variability on phonetic context can be differentiated from context effects in visual perception of color. Much like speech, color is perceived relationally; the perceived color at a point in a visual scene depends upon its own characteristics as well as those of the surrounding areas of the scene. Simultaneous color contrast refers to the pattern of perception that arises when changes in the overall brightness or hue of the surround shifts the perceived brightness or hue of the target object in a complementary, contrastive manner (da Vinci, 1492; Chevreul, 1845; Helmholtz, 1866). Brown and MacLeod (1997) report that changing the variance of the colors in a test spot’s surround while holding the mean constant induces a contrastive shift in the perceived contrast and saturation of the test spot’s color. Thus, as in the auditory case considered in this report, the distribution of visual context influences visual perception. However, in the case of simultaneous visual contrast, distribution variance appears to have a larger role than is observed in the present auditory example.
III. EXPERIMENT 2
Experiment 1 provides further evidence that the auditory system is sensitive to the spectral distribution of context sounds preceding a speech target, particularly the mean. In investigating the processes responsible for such effects, it is of interest whether the entire sequence of the acoustic history is weighted equivalently in its influence on subsequent perception. There are examples of context effects in speech categorization for which temporally adjacent context elicits a more robust effect on speech categorization than does more temporally remote context. For example, whereas the rate of presentation of a precursor sentence influences speech categorization, the segment of the sentence temporally adjacent to the speech target is most influential in target speech syllable identification (e.g., Summerfield, 1975; Newman and Sawusch, 1996).
Experiment 2 addresses this issue in the present paradigm by introducing “meta-statistics” such that the acoustic history precursors possess both local and global regularities. Previous results demonstrate that higher-frequency acoustic histories shift /ga/-/da/ categorization toward more “ga” responses whereas lower-mean acoustic histories shift categorization toward “da.” Holt (2005) showed, as well, that acoustic histories with an intermediate mean (2300 Hz) equivalent to the standard-tone frequency produce a categorization function that is significantly different from those of the high or low mean acoustic histories and lies approximately mid-way between the high and low mean categorization functions.
The present experiment exploits these findings by dividing the 21-tone acoustic history into three sequential 7-tone segments, each with its own local distribution mean. Each of the three segments was synthesized to possess tones sampled from a low-frequency distribution (mean= 1800 Hz), a high-frequency distribution (mean= 2800 Hz), and an intermediate-frequency distribution (mean= 2300 Hz); the order of these three subcomponents of the acoustic history was randomized across conditions, resulting in six distinct orderings each possessing a global mean (across the full 21 tones comprising the entire acoustic history) of 2300 Hz. Whereas in experiment 1 the ordering of the tones making up the acoustic histories was randomized on a trial-by-trial basis to eliminate the potential for local acoustic influences, the present stimulus structure explicitly creates local regularities in the three subcomponents of the acoustic history. A consequence of this is that the 7 tones immediately preceding the speech target varied across conditions, too, making it possible to assess whether, as seems to be the case with rate effects on speech categorization (Summerfield, 1975; Newman and Sawusch, 1996), temporally local information elicits a greater context effect on the speech targets. Most broadly, the question of interest is whether perceptual processing is sensitive to these local statistics or whether the global characteristics of the sequence of tones drive context-dependent speech categorization. To assess this, the effect of these conditions is compared to homogeneous conditions with only global regularities, akin to those of experiment 1 and previous experiments (Holt, 2005, 2006).
A. Methods
1. Participants
Ten volunteers who had not participated in experiments of this kind were recruited from Carnegie Mellon University. They participated for course credit or a small payment. All listeners reported normal hearing and were monolingual native English speakers.
2. Stimuli
Figure 3(a) illustrates the stimulus structure of experiment 2 stimuli. Three conditions were defined by statistically homogeneous acoustic histories, with a global mean but no consistent local regularities. Twenty-one tones sampling a distribution with a high (condition HHH, mean= 2800 Hz), middle (condition MMM, mean= 2300 Hz), or low (condition LLL, mean= 1800 Hz) mean were randomly ordered on a trial-by-trial basis; thus, stimuli in these conditions were created identically to those of the most variable distributions in experiment 1, sampling 1000 Hz in 50-Hz steps and possessing only global distribution regularity.
FIG. 3.
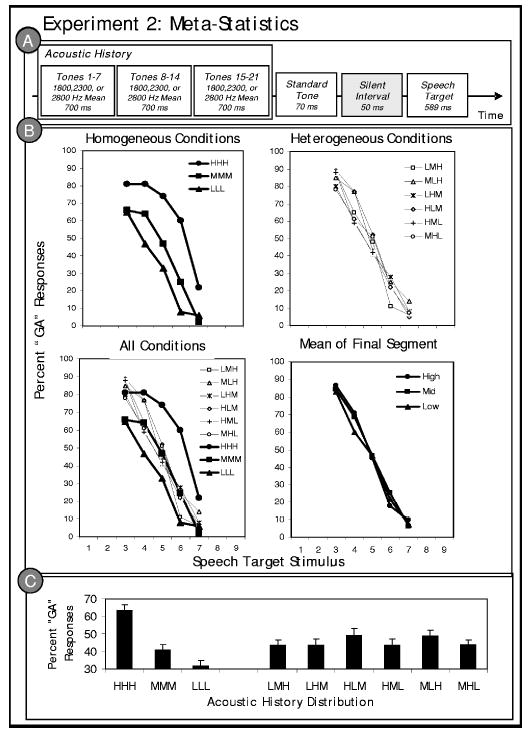
Stimulus structure and results of experiment 2. (a) Schematic illustration of the experiment 2 stimulus structure; (b) listeners’ average “ga” categorization responses to the /ga/ to /da/ series stimuli in the context of preceding acoustic histories. In the top left panel, the thick, solid lines depict speech categorization in the context of the homogeneous acoustic history conditions for which there was only global regularity. In the top right panel, the dashed lines illustrate categorization in the context of the hetergeneous acoustic histories with an intermediate global mean of 2300 Hz and local regularities within 7-tone subelements. The bottom left panel combines the data from the two former graphs. The bottom right panel shows the data as a function of the frequency of the distribution mean of the final subsequence immediately preceding the speech target; and (c) average “ga” categorization responses collapsed across the target stimulus series as a function of the distribution characteristics of the acoustic history precursors.
Six conditions possessing local statistical regularity in addition to the global regularity were also created. The acoustic histories of each of these conditions had a global mean of 2300 Hz, equivalent to the middle mean condition of Holt (2005) and the MMM condition of the current experiment. However, unlike previous experiments, these acoustic histories also possessed local regularities in each of three consecutive groups of 7 tones. These local regularities were formed by assigning each of the high, middle, and low distribution means to one of the three 7-tone subsequences of the acoustic history. Thus, averaged across the entire 21 tones, the global mean was always 2300 Hz. However, local regularity existed in each of the subunits of the acoustic history. Exhaustively ordering the high, middle, and low means across these three subunits yielded six conditions (LMH, LHM, HLM, HML, MLH, MHL). Each of the 7-tone subsequences sampled frequencies around the distribution mean in 50-Hz steps. Therefore, each of the subcomponents of the acoustic history sampled a range of 300 Hz; the global range was 1650–2950 Hz or 1300 Hz. Given the results of experiment 1, this difference in distribution variability from the homogeneous condition was not expected to significantly influence the results. Within a subunit, the 7 tones were randomly ordered on each trial.
To reduce the overall number of observations necessary to test the nine acoustic history conditions, only consonant stimuli 3–7 along the /ga/ to /da/ series were used in experiment 2. Holt (2005) found that this limited range of speech targets, spanning the more ambiguous members of the consonant series, was sufficient to observe effects of acoustic history contexts on speech categorization. Overall, there were 450 stimuli presented in a single experiment session (9 acoustic history conditions, 5 speech target stimuli, 10 repetitions). In all other respects, stimuli were created as in experiment 1.
3. Procedure
The procedure and apparatus were identical to those of the previous experiment. Listeners heard stimuli from each of the nine conditions mixed across a single experiment session. On each trial, listeners responded whether the speech syllable was “ga” or “da.”
B. Results
For clarity, the top panels of Fig. 3(b) show separately the categorization functions for the homogeneous conditions possessing only global acoustic regularity and the heterogeneous conditions with local and global regularity. The data are plotted together in the bottom left panel of Fig. 3(b). Condition means can be found in Table I.
A repeated-measures ANOVA was conducted across the nine distribution conditions as a function of the percent “ga” responses averaged across the target stimulus series. This analysis revealed an overall main effect of the acoustic history distribution, F(8, 72) = 21.40, p<0.0001, = 0.704. Planned Bonferroni-corrected pairwise comparisons revealed that there was a significant difference in listeners’ categorization of the consonants preceded by the homogeneous high mean (HHH) and low mean (LLL) conditions, F(1, 9) = 137.98, p<0.0001, = 0.939. In addition, phonetic categorization was significantly different in the context of the homogeneous middle mean (MMM) condition versus the high (HHH), F(1, 9) = 94.02, p<0.0001, = 0.913, and the low (LLL), F(1, 9) = 23.824, p= 0.001, = 0.726, homogeneous conditions.
The relationship of speech categorization across the heterogeneous conditions possessing both global and local statistics is of specific interest in the present studies. A repeated-measures ANOVA of the percent “ga” responses across target stimuli for the six heterogeneous conditions with global middle means, but varying local means, revealed no significant main effect of the acoustic histories, F(5, 45) = 2.12, p= 0.08, = 0.191, although there was a trend in this direction. Investigating this trend more fully among the heterogeneous conditions reveals that only the HLM condition was significantly different from the homogeneous MMM condition (with which heterogeneous conditions shared a global mean). It appears that listeners more often identified consonants following the HLM condition acoustic histories as “ga” than in other conditions with a 2300-Hz global mean, F(1, 9) = 30.77, p<0.0001, = 0.774. Nonetheless, speech categorization in the context of HLM acoustic histories, albeit distinguishable from the other global intermediate-mean conditions, was significantly different than the HHH condition, F(1, 9) = 23.143, p= 0.001, = 0.720, and the LLL condition, F(1, 9) = 50.799, p<0.0001, = 0.849. Figure 3(c) illustrates the condition means for each of the nine experiment conditions.
Interpreting these results, it appears that manipulating the local statistics of the acoustic histories has little effect on speech categorization. Despite the presence of local regularities, the global mean dominated the context effect on speech categorization. Irrespective of which local subcomponent to which they belonged, the tones were equal-amplitude sine-waves. Given the overall similarity of the stimuli, grouping at the global level may have been more coherent than that at the local levels, resulting in a bias toward global effects. There thus remains an interesting open question of whether auditory group plays a role in how auditory processing tracks distribution regularity. A straightforward means of beginning to address this possibility in future behavioral work would be to increase the differentiation of the local elements by introducing local changes in amplitude or timbre, for example, to determine whether local regularity exerts more of an influence on defining the distribution when auditory grouping cues are facilitative of it.
Another issue of importance in this experiment was whether local regularities temporally adjacent to the speech targets elicited a greater influence on speech categorization, as has been reported for effects of preceding sentence rate on phonetic categorization (Summerfield, 1975; Newman and Sawusch, 1996). This possibility was investigated with a repeated-measures ANOVA of the percent “ga” responses across the target syllable series as a function of the mean of the final segment of the six heterogeneous conditions. Conditions with a final high mean segment (LMH/MLH) were compared against those possessing a final low mean segment (HML/MHL) and a final middle mean segment (LHM/HLM). The results of this analysis support what is clear from the plot in the bottom right panel of Fig. 3(b). There was no main effect of final segment mean, F<1. Phonetic categorization responses could not be predicted from the immediately preceding local regularity alone. Thus, these findings depart from the results of Summerfield (1975) and Newman and Sawusch (1996) for effects of preceding speech on phonetic categorization of temporal contrasts (e.g., /ba/ vs /wa/). Further studies will be needed to determine whether these different patterns of results arise because of differences in temporal versus spectrally based context effects in phonetic categorization, or whether differences in processing speech versus nonspeech contexts may be responsible. Acoustic histories that vary in global temporal characteristics have been found to influence listeners’ categorization of following /ba/ vs /wa/ speech targets in a temporally contrastive manner [i.e., slower acoustic histories result in more /ba/ responses, the alternative with a faster formant frequency transition rate (Wade and Holt, 2005c)]. However, it is not yet known whether listeners may be sensitive to local rate regularities in such contexts. Note, as well, that this result is not incompatible with Lotto and Kluender’s (1998) finding that adjacent nonspeech tones shift /ga/-/da/ categorization as a function of tone frequency. In the present experiments, the acoustic histories of the present experiment were separated from the speech syllable by a constant mid-frequency standard tone.
IV. EXPERIMENT 3
The first two experiments underscore the relative importance of the global mean of the acoustic history distribution in predicting phonetic context effects. The average spectrum across a somewhat extended temporal window appears to tune processing of incoming acoustic information contrastively with respect to the distribution mean. If this interpretation of the results is correct, then reversing the average energy present in the acoustic history spectra should reverse the influence of context on speech categorization. To be more specific, acoustic histories that lack energy at precisely the frequencies where energy is present in the tone-based acoustic histories should produce a context effect on speech categorization in the opposite direction. A complementary spectrum should produce a complementary context effect. This prediction was investigated in experiment 3 by comparing the effects of context for tone acoustic histories and spectral complement acoustic histories created with white noise from which notches were filtered such that acoustic energy existed at all frequencies except those sampling the acoustic history distributions.
A. Methods
1. Participants
Ten volunteers who had not participated in experiments of this kind were recruited from Carnegie Mellon University and participated for course credit or a small payment. All listeners reported normal hearing and were monolingual native English speakers.
2. Stimuli
Two sets of acoustic histories were prepared. One set was created from sine-wave tones as described by Holt (2005) and as created for experiments 1 and 2, with high (2800 Hz) and low (1800 Hz) mean distributions sampled by 21 tones with unique frequencies spanning 1000 Hz in 50-Hz steps. As in previous experiments, the order of the acoustic history tones was randomized on a trial-by-trial basis to minimize effects elicited by any particular tone ordering. The final, standard, tone was always 2300 Hz [see Fig. 4(a)]. The speech targets were paired with ten unique acoustic histories sampled from the distribution defining the high and low mean conditions to create ten unique repetitions of each stimulus pairing.
FIG. 4.
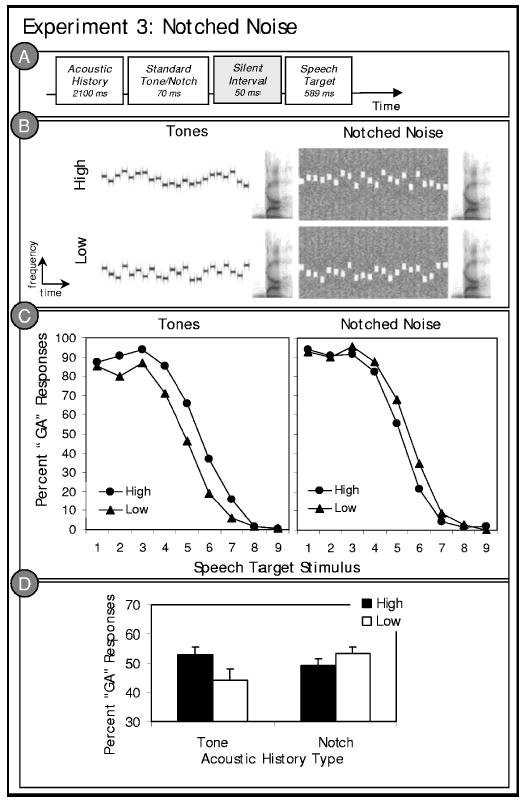
Stimulus structure and results of experiment 3. (a) Schematic illustration of the experiment 3 stimulus structure; (b) example spectrograms illustrating a high mean and a low mean stimulus token from the notched noise and tone acoustic histories of experiment 3. Note that the tone acoustic histories possess energy where the notched noise acoustic histories lack energy. (c) The left panel illustrates listeners’ average “ga” categorization responses to the /ga/ to /da/ stimulus series as a function of the tone acoustic history contexts. The right panel shows the same listeners’ responses to the same speech stimuli preceded by notched noise acoustic history contexts. (d) Average “ga” categorization responses collapsed across the target stimulus series as a function of the distribution characteristics of the acoustic history precursors.
A matched set of notched noise acoustic histories was also created. Stimulus for stimulus, the frequencies and orderings of the tone acoustic histories were matched. However, the spectra for the notched noise acoustic histories were created as spectral complements to the tone acoustic histories. This was achieved by beginning with a white noise stimulus possessing spectral energy across all frequencies. From this 2200-ms white noise stimulus, notches (70-ms, 100-Hz-bandwidth spectral regions with acoustic energy greatly reduced) were produced by digitally band-stop filtering the white noise in sequential time slices (Matlab, Mathworks; sixth-order elliptical filter, with 3-dB peak-to-peak ripple and a minimum stop-band attenuation of 50 dB). Notch center frequencies were equivalent to tone frequencies in the tone acoustic histories. As a result, these notched-noise stimuli were spectral complements to the tone acoustic histories in that they lacked acoustic energy precisely where the tone acoustic histories possessed energy. In other ways, stimulus creation was as described for the previous experiments. Example stimuli are pictured in Fig. 4(b). In all, there were 360 stimuli (2 means, 2 types of acoustic history, 9 speech target stimuli, 10 repetitions).
3. Procedure
Seated in individual sound-attenuated booths, listeners categorized the speech target of each stimulus by pressing electronic buttons labeled “ga” and “da.” Listeners completed two blocks in a single session; the order of the blocks was counterbalanced. In one block, the notched noise contexts preceded the speech targets. In the other block, participants heard the same speech targets preceded by tone acoustic histories. Thus, each listener responded to stimuli from each condition.
B. Results
Figure 4(c) depicts listeners’ average categorization responses as a function of the acoustic history type (tone versus notched-noise) and acoustic history distribution mean (high versus low). Figure 4(d) illustrates the condition means, collapsed across the speech target series stimuli. Condition means can be found in Table I. A repeated measures ANOVA of the percent “ga” responses across the speech target series reveals what the graphs illustrate: both the tone acoustic histories, F(1, 9) = 19.46, p= 0.002, = 0.684, and the notched noise acoustic histories, F(1, 9) = 5.72, p= 0.04, = 0.388, had a significant effect on speech categorization. Of note, however, is the direction of these context effects. A direct prediction of spectral contrast is that notched-noise spectral complements of tonal acoustic histories (created such that where there was energy in the tone acoustic histories there as a corresponding lack of energy in the notched noise) should produce the opposite effect of context on speech categorization. This prediction is cleanly supported by the present data. As reported in previous studies (Holt, 2005, 2006) and experiments 1 and 2, the tone acoustic histories shifted speech categorization contrastively. Speech targets preceded by acoustic histories sampled from a higher-frequency spectral distribution were more often categorized as “ga,” the lower-frequency alternative, than the same stimuli preceded by tone acoustic histories sampling a lower-frequency spectral distribution. The notched noise acoustic histories produced results that similarly follow from the distributions of spectral energy. The notched noise acoustic histories labeled “high” had notches modeling the frequencies of the “high” tone acoustic histories (and lacked acoustic energy around the high mean, 2800 Hz). As a result, they possessed relatively less high-frequency energy than the “low” notched noise stimuli. Listeners’ categorization responses followed this spectral reversal. Listeners more often categorized consonants preceded by “low” notched noise acoustic histories as “ga” relative to the same consonants preceded by “high” notched noise acoustic histories. Again, greater high-frequency energy in the precursor stimulus led to speech categorization functions contrastively shifted toward lower-frequency spectral energy and vice versa. These results therefore substantiate the claim that the average spectrum of acoustic energy preceding a speech target has a significant spectrally contrastive influence on speech categorization.
A further analysis was conducted to examine whether the size of the context effect produced by the notched noise versus tone acoustic histories differed. Participants’ percent “ga” categorization responses were submitted to a 2×2 (context type×acoustic history mean) repeated measures ANOVA of the percent “ga” responses across the speech target series. The analysis revealed that there was no main effect of whether the acoustic history was created from tones or notched noise, F<1, indicating no overall shift in speech categorization across context types. As would be expected from the analyses above, there was a significant influence of the acoustic history distribution mean, F(1, 9) = 28.38, p = 0.0005, = 0.759. Of note, there was no context type by acoustic history distribution mean interaction, F(1, 9) = 2.92, p= 0.122, = 0.245. Context effects produced by the notched noise versus the tone acoustic histories were statistically equivalent, indicating that the size of the context effects produced by the tone and notched-noise acoustic histories were statistically equivalent in magnitude, albeit complementary. Caution, however, should be taken in interpreting the importance of this null interaction. The principal finding of experiment 3 is that spectrally complementary acoustic histories produce a complementary effect on phonetic categorization. The effect is predicted from the average spectrum of the preceding nonspeech context.
V. EXPERIMENT 4
From the results so far, we can conclude that the mean matters in auditory context effects. In the face of considerable variability or no variability, with local or only global regularity, and with tones or notched noise, the global mean spectra of the acoustic history distribution predicts the effect on speech categorization. Moreover, the effects are “statistical” in the sense that acoustic characteristics that vary trial-by-trial do not drive them. Rather, they are related to distributional characteristics of the context. Distributions, however, must be sampled; the greater the number of events drawn from a distribution, the better the estimate of that underlying distribution parameter such as the mean.
Does the auditory system treat distributional information in this way? Are the distributional context effects elicited by acoustic histories more robust when the distributions are better sampled with more events across time or with finer sampling of frequency within the spectral range? Table I illustrates that the experiments reported thus far have investigated acoustic histories sampled by an equivalent number of tones. In this scheme, the duration of the acoustic history has been constant as has been the number of tones sampling the distribution. To return to the original aim of the present studies to investigate the bounds of sensitivity to distribution regularity in auditory processing, experiment 4 investigates whether sampling the acoustic history with greater density across frequency (experiment 4a) or more events across time (experiment 4b) modulates the influence of the distribution mean on phonetic categorization. In experiment 4a, the number of tones composing the acoustic histories is manipulated while the range of frequencies sampled is constant at 1000 Hz. As a result, the density with which the distribution is sampled varies (as reflected by the step-size between tones comprising the distribution). If three tones with unique frequencies sample a 1000-Hz range, then the sampling frequency of these tones must be greater (500 Hz) than the sampling frequency of 26 unique tones that sample a 1000-Hz range (40 Hz) when distribution mean is held constant. Due to the multiple dimensions defining the acoustic history distribution in the spectral and temporal domains, this scheme necessarily covaried acoustic history duration and frequency sampling density, thus confounding firm conclusions as to the source of any observed effects.
Therefore, a second study was run with additional controls. Experiment 4b examines speech categorization in the context of acoustic histories that vary in the sampling of events across time by varying the number of tones comprising the acoustic histories (from 3 to 21 tones), with the sampling density across frequency held constant. Jointly, these experiments examine whether the distributional effects of auditory context observed on phonetic categorization are subject to manipulations of distribution sampling in the frequency and time domains.
A. Method
1. Participants
Ten volunteers who had not participated in experiments of this kind were recruited from Carnegie Mellon University and participated for course credit or a small payment. All listeners reported normal hearing and were monolingual native English speakers.
2. Stimuli
a. Experiment 4a
Stimuli were created in the manner of experiment 1, with the overall structure following the pattern schematized in Fig. 5. In experiment 4a the number of tones in the sequence composing an acoustic history was manipulated across seven conditions such that high and low spectral distributions were sampled with 3, 5, 6, 9, 11, 21, or 26 tones. The 21-tone condition was created in the same way as acoustic histories of experiments 1–3, with tones sampled at 50-Hz intervals. The range of variability of tones was held constant at 1000 Hz across conditions, so the frequency distance between tones composing an acoustic history varied (3 tones, 500 Hz; 5 tones, 250 Hz, 6 tones, 200 Hz, 9 tones, 125 Hz; 11 tones, 100 Hz; 21 tones, 50 Hz; 26 tones, 40 Hz). Table I provides a summary. The 2300-Hz standard tone served as the final tone in each sequence. Each stimulus was repeated ten times for a total of 1260 stimuli (7 sampling density conditions×2 acoustic history means×9 speech target stimuli×10 repetitions) in the experiment.
FIG. 5.
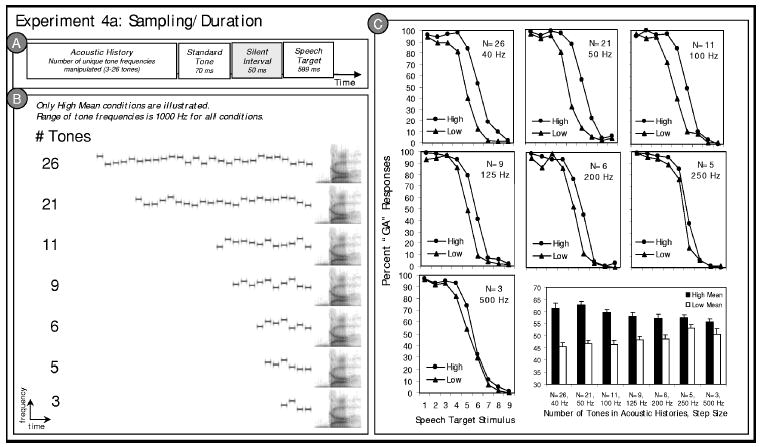
Stimulus structure and results of Experiment 4a. (a) Schematic illustration of the experiment 4a stimulus structure; (b) example spectrograms illustrating a high mean stimulus token from each experiment 4a condition. Low mean conditions (not illustrated) follow the same pattern across conditions. (c) Listeners’ average “ga” categorization responses to the /ga/ to /da/ series stimuli in the context of preceding high and low mean acoustic histories are plotted for each of the seven conditions of Experiment 4a. The bar graph in the lower right corner illustrates the same data collapsed across speech target stimulus.
Overall, the present stimuli differed from those of the previous experiments in three ways: (1) the number of tones in the acoustic history varied from 3 to 26; (2) tone duration was held constant, so overall duration of the acoustic histories varied with the number of tones (from 300 to 2600 Hz); and (3) the overall range of frequencies sampled was held constant at 1000 Hz, so the density of frequency sampling across this 1000 Hz varied with the number of tones composing the acoustic history (40–500 Hz, from 26 to 3 tones).
b. Experiment 4b
Holding the overall range of the distribution and the tone duration constant in experiment 4a meant that the density of frequency sampling across the 1000-Hz range and the overall duration of the acoustic histories varied simultaneously. Therefore, it is not possible to know definitively the source of any observed effects of the acoustic histories of experiment 4a. To address this concern, an additional set of acoustic histories was created for experiment 4b. In these stimuli, the distribution sampling density was held constant at 500 Hz; tones in the experiment were sampled from the distributions in 500-Hz steps. Three unique tones with frequencies sampling the low mean (1300, 1800, 2300 Hz) distribution or the high mean (2300, 2800, 3300 Hz) distribution served as the basis for each of the acoustic histories. These three tones were repeated one, three, five, or seven times to create acoustic histories composed of 3, 9, 15, or 21 tones. The order of the tones was randomized on a trial-by-trial basis. There were 900 total stimuli (5 conditions×2 acoustic history means×9 speech target stimuli×10 repetitions). In other ways, stimuli were created as described for experiment 1; representative stimuli are shown in Fig. 6.
FIG. 6.
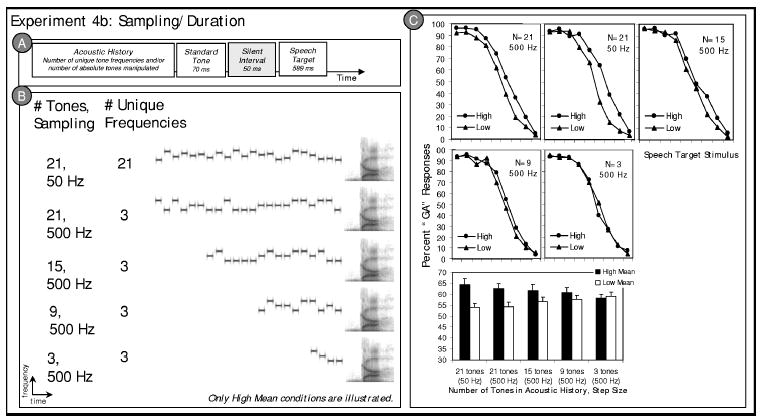
Stimulus structure and results of Experiment 4b. (a) Schematic illustration of the experiment 4b stimulus structure; (b) example spectrograms illustrating a high mean stimulus token from each experiment 4b condition. Low mean conditions (not illustrated) follow the same pattern across conditions. (c) Listeners’ average “ga” categorization responses to the /ga/ to /da/ series stimuli in the context of preceding high and low mean acoustic histories are plotted for each of the five conditions of experiment 4b. The bar graph in the lower right corner illustrates the same data collapsed across speech target stimulus.
The experiment 4b stimuli had a constant sampling of frequency (1000 Hz in 500-Hz steps), but the duration (300–2600 ms) varied with the number of tones composing the acoustic histories (3 to 26 tones). For comparison and as a control condition, an additional pair of high and low mean acoustic history conditions was created with 21 tones sampling 1000 Hz in 50-Hz steps, as in experiments 1–3. Overall, comparing the results of experiments 4a and 4b, it is possible to begin to understand whether distribution regularity is related to the density with which the acoustic spectrum is sampled or the absolute duration of the acoustic history.
3. Procedure
Seated in individual sound-attenuated booths, listeners categorized the speech target of each stimulus by pressing electronic buttons labeled “ga” and “da.” Listeners responded to stimuli from each condition mixed across an experimental session on each of two consecutive days.
B. Results
The results of experiment 4a are plotted in Fig. 5 and were investigated with a 7×2 (number of tones×acoustic history mean) repeated measures ANOVA of the percent “ga” responses averaged across the target speech series. As was the case in experiments 1–3, there was a robust main effect of acoustic history distribution mean on speech categorization, F(1, 9) = 90.04, p<0.0001, = 0.909, with listeners responding “ga” more often in the context of preceding high mean acoustic histories. There was no main effect of the number of tones in the acoustic histories, F(6, 54) = 1.89, p = 0.10, = 0.174, indicating that there was no overall categorization shift as a function of the number of tones composing the acoustic history. Of interest, there was an interaction, F(6, 54) = 10.44, p<0.0001, = 0.537, indicating that the size of the context effect elicited by the acoustic history mean varied as a function of the number of tones composing the acoustic history. The magnitude of the effect of the acoustic history mean on speech categorization decreased with the number of tones composing the distribution. Table I provides condition means.
Thus, it appears that the effect of the preceding spectral distribution on speech categorization may be modulated by the acoustic history duration or the number of events composing it. However, to satisfy the multiple constraints on stimuli in experiment 4, the number of tones composing the acoustic histories across conditions necessarily covaried with the sampling of the range of spectral distribution. Therefore, it is impossible to know the source of the interaction of acoustic history distribution mean with the number of tones composing the acoustic histories. The number of acoustic events, the overall acoustic history duration, and the density with which the acoustic history was sampled varied across the conditions so the source of the interaction cannot be inferred from experiment 4a alone.
To investigate this further, experiment 4b examined the effect of acoustic histories for which the number of tones varied across conditions but the mean of the distribution and density with which the acoustic histories were sampled were held constant. Acoustic histories with 3, 9, 15, or 21 tones sampled at 500-Hz intervals and a 21-tone acoustic history sampled at 50 Hz, as in previous experiments, served as contexts. The interesting comparisons come among the perceptual consequences of the four conditions sampled at 500 Hz, for which the number of tones varied while sampling interval was held constant, and between the two 21-tone conditions for which sampling frequency varied while the number of tones was constant.
A 4×2 (sampling interval×acoustic history mean) repeated measures ANOVA of the percent “ga” responses across the speech target series comparing the conditions for which sampling density was constant revealed no overall effect of the number of tones, F<1, but a significant effect of the acoustic history distribution mean, F(1, 13) = 6.23, p = 0.02, = 0.324. The interaction between the number of tones and the acoustic history distribution mean was also significant, F(3, 39) = 8.53, p= 0.0002, = 0.396, indicating that the size of the context effect varied with the number of tones composing the acoustic history. With fewer tones, the effect of the distribution means was smaller. Table I provides condition means. Figure 6 plots the results.
An additional 2×2 (sampling density×acoustic history mean) repeated measures ANOVA of the percent “ga” responses across the target series, comparing just the conditions for which sampling interval varied (50 vs 500 Hz) while the number of tones (21) remained constant, revealed no significant overall effect of condition, F<1, but the expected effect of acoustic history distribution mean, F(1, 13) = 20.157, p= 0.001, = 0.608. Of special interest, there was no interaction of acoustic history distribution mean with the sampling density of the tones, F(1, 13) = 1.896, p= 0.192, = 0.127. Thus, the context effect was the same magnitude for 21-tone acoustic histories with high and low distribution means, whether the 21 tones sampled 21 unique frequencies in 50-Hz steps across 1000 Hz or whether they sampled just three frequencies in 500-Hz steps across the 1000-Hz range. When the acoustic history distribution mean and number of tones was held constant, there was no effect of sampling density.
The change in the magnitude of the context effects observed for experiment 4a therefore appears to be the result of the distribution mean and the duration of the acoustic history, or the number of events composing the acoustic history, rather than the density with which the distribution was sampled in the frequency domain. The longer acoustic histories produced larger effects of context on speech categorization, the direction of which was predicted by the distribution mean for all conditions. Again, as in the previous experiments, the mean of the distribution plays the dominant role in driving the effects of context observed on speech categorization.
VI. GENERAL DISCUSSION
Like perception in other modalities, auditory perception is relational in the sense that context is critical in interpreting information for object identity. From the lowest-level cochlear interactions to higher-order cortical processing, the auditory neural code is significantly affected by context sounds. Nonetheless, not all characteristics of context are effective in influencing perception. As a result, understanding the characteristics of context that have a perceptual effect can be informative of the types of information that interact in perceptual processing. The present studies find that nonlinguistic acoustic sounds as simple as tones and notched white noise are sufficient to influence speech categorization. This implicates rather general perceptual processes in the categorization of speech (Diehl et al., 2004; Holt and Lotto, 2002; Lotto and Kluender, 1998).
Holt (2005) introduced an “acoustic history” paradigm for studying the effects of statistical distributions of nonspeech context sounds on speech perception and demonstrated that manipulating the spectral mean of a distribution sampled by a sequence of tones of varying frequencies produces robust spectrally contrastive context effects on speech categorization. The present series of experiments exploited the acoustic history paradigm to zero in on the statistical distribution characteristics that influence online speech categorization. Experiment 1 found that whereas the mean of the acoustic history distributions serves to shift speech categorization contrastively, the variability of the distributions has little effect. Whether the acoustic history distribution was sampled by 21 tones with unique frequencies spanning a 1000-Hz range or a single tone at the mean frequency of that range repeated 21 times, the effect on speech categorization was robust and statistically equivalent. Experiment 2 demonstrated that local statistical regularity existing within the global regularity did not have much of an effect on speech categorization. Listeners’ speech target identification was influenced by the global mean of the acoustic history, without significant influence of the local regularity. Experiment 3 provided additional evidence that the average spectrum of the acoustic histories drives the observed context effects; spectral complements of the acoustic histories produced an opposite effect on speech categorization. The spectrum thus predicts the direction of the context effects. Finally, experiment 4 highlighted how distribution sampling influences the effect of the spectral distribution mean on speech perception. The number of tones composing the acoustic history was influential; as the number of tones and the overall duration of the acoustic history decreased, so too did the effect of the acoustic history mean on speech categorization. The sampling density of the distribution in the frequency domain was not essential, however. Whether the frequency range was sampled with tones differing by 500 or 50 Hz, the effect of the acoustic histories on speech categorization was the same so long as the number of tones and duration of the acoustic history were constant; longer acoustic histories produced more robust context effects. Moreover, the context effects observed across all of the experiments strongly support the claim by Holt (2005) that the mean of a distribution of context sounds influences speech categorization. Table I provides a verification of the robust nature of the influence of acoustic history contexts on speech categorization. Across conditions and experiments, this finding was replicated 18 times.
On the whole, the present experiments provide converging evidence for auditory sensitivity to spectral distributions of sound and of perceptual consequences of this sensitivity in processing other sounds. There are three primary characteristics of these data that must be understood. The first is that nonspeech contexts are effective in shifting speech categorization at all. The second is the contrastive nature of the results, such that lower frequency contexts shift speech categorization toward higher-frequency alternatives and higher-frequency contexts shift speech categorization toward lower-frequency alternatives. These first two characteristics are supported thoroughly by other studies of nonspeech contexts on speech categorization. The context effects produced by the acoustic histories mirror the contrastive effects reported for single, temporally adjacent nonspeech contexts (Holt, 1999; Holt et al., 2000; Lotto and Kluender, 1998), although with longer time courses (Holt, 2005). The third characteristic of importance was hinted at in the studies of Holt (2005), but is firmly supported by the present studies: the mean matters. The influence of the distributionally defined nonspeech acoustic history contexts was driven by the mean of the distribution across experiments. At a broad, algorithmic level a general auditory perceptual mechanism that accentuates change such that, in response to regularity in the acoustic input, the system responds best to novelty, would accommodate these three primary characteristics of the results.
A. Stimulus-specific adaptation and spectral contrast
Neuronal adaptation, the decline over time of neuron responses to sensory stimuli, serves this algorithmic requirement. It is a ubiquitous characteristic of neural processing in sensory areas and, in the auditory system, neuronal adaptation exists at multiple levels. Auditory nerve neurons are able to follow very fast acoustic presentation rates of up to hundreds of presentations per second (Greenwood and Joris, 1996), but at the level of the auditory thalamus (medial geniculate body, MGB) neurons adapt at rates of tens of presentations per second (Creutzfeldt et al., 1980). Cortical neurons in primary auditory cortex (A1) adapt even when stimulus presentation is at a rate of only a few stimuli per second (Condon and Weinberger, 1991; Creutzfeldt et al., 1980; Miller et al., 2002). Thus, neurons show somewhat weak, fast adaptation at the periphery, but adaptation becomes progressively stronger, with longer time constants along the ascending auditory pathway.
Adaptation is often thought of simply as a fatigue of the neural response and, in fact, it can be manifested in this way (Carandini, 2000). In past work examining the contrastive nature of nonspeech context effects on speech, we had hypothesized that peripheral adaptation of this sort might be responsible for the effects of single temporally adjacent speech and nonspeech context stimuli on speech categorization (Holt et al., 2000). Subsequent research, however, revealed context effects of nonspeech even when the nonspeech signals were presented to the ear opposite that of the speech target and across silent intervals incompatible with solely peripheral processing (Lotto et al., 2003; Holt and Lotto, 2002).
A fairly recent series of studies has provided strong evidence that the auditory system, like the visual system (Dragoi et al., 2000; Movshon and Lennie, 1979; Saul and Cynader, 1989), exhibits another form of adaptation—known as stimulus-specific adaptation (SSA)—that may better account for spectrally contrastive context effects. This stimulus-specific adaptation has been shown to occur with long adaptation sequences (Condon and Weinberger, 1991; Dragoi et al., 2000; Movshon and Lennie, 1979; Saul and Cynader, 1989) and also with pairs of stimuli (Malone and Semple, 2001; Malone et al., 2002; Müller et al., 1999). Thus, SSA can occur rapidly (on the time scale of a single stimulus) or evolve more slowly over multiple stimulus presentations. Visual neurons, for example, adapt to the statistical distribution of input stimuli. This pattern of SSA has been shown to maximize information transmission in the visual network and is closely related to principles of optimal neural coding (Fairhall et al., 2001).
Ulanovsky and colleagues (Ulanovsky et al., 2003, 2004) have recently described SSA in primary auditory cortex (A1) and have suggested that a central role of A1 may be to respond to regularity in the long-term statistics of auditory signals by depressing neuron response to regularity in the acoustic input and, relatedly, to detect auditory novelty with enhanced neuronal response. At the algorithmic level, SSA is perhaps better suited than adaptation-by-fatigue to relate to context-dependent auditory processing of the sort investigated here. Ulanovsky et al. have provided explicit evidence that SSA creates enhancement of neural responses to rare stimuli, and thus to acoustic change and the stimulus specificity of the neural adaptation and enhancement. The effects are therefore sensitive to distributions of energy evolving across time and elicit adaptation and the consequent enhancement that would be expected to produce contrastive patterns of perception like those observed in the present results.
The experimental paradigm of Ulanovsky et al. 2003 can be considered to be a single-neuron version of mismatch negativity (Näätänen et al., 1978), an important auditory event-related potential (ERP) whereby sequences of common acoustic stimuli are presented with rare deviant stimuli occasionally embedded in an “oddball” design. The MMN is the difference in the ERP for the deviant versus the standard, with an enhanced response to the deviant. The MMN can reflect deviation in stimple acoustic properties like absolute frequency or duration, or complex regularities in acoustic input that evolve across time. Given that the perceptual system must have some accounting of what is standard in order to respond more robustly to a deviant, many have interpreted the existence of the MMN as indicative of auditory sensory memory (see Näätänen et al., 2001). Employing a standard/deviant “oddball” stimulus presentation paradigm in studying single-neuron responses in A1, Ulanovsky et al. report an enhanced response of individual auditory cortical neurons to acoustic novelty. Specifically, a particular tone frequency serving as an infrequent deviant in a series of tones is responded to more robustly by A1 neurons than is the same tone frequency when it serves as a frequent, repeating standard. These data provide evidence that primary auditory cortex tracks statistical regularity in the input signal across rather extended temporal windows and modulates its responsiveness in reaction to this regularity. The relative adaptation to common input characteristics coupled with the enhanced response to novelty serves to exaggerate acoustic change in the neural code. The coding strategy of the auditory system is thus matched to the stimulus statistics over time (see also Fairhall et al., 2001).
Of course, these physiological studies were not conducted with the acoustic history paradigm of the present experiments in mind and so direct comparisons should be made with much caution. However, these studies do demonstrate the sensitivity of auditory cortex to distribution characteristics of acoustic context that unfolds across time. With this caveat in mind, there is a way in which SSA may account for the robust effect of distribution mean in influencing phonetic categorization in the present experiments. In addition to studying A1 neuron response to distributions of stimuli that varied in their regularity, Ulanovsky et al. 2004 examined the response of A1 neurons to equally probable, equal-amplitude tones with 20 different frequencies. This stimulus ensemble was thus quite similar to the acoustic histories of the present experiments. Ulanovsky et al. report that the responses of the A1 neurons to frequencies at the center of the stimulus frequency range adapted the most and there was relative enhancement of responses at the eccentric frequencies furthest away from the center of the frequency range. This response pattern created a U-shape in the neural tuning curves, with maximal adaptation at the central frequencies and enhancement at the edges. This response pattern emerged due to relatively simple properties of SSA. Adaptation strength is negatively correlated with the frequency difference between the present stimulus and that of the stimulus from the preceding trial (Brosch and Schreiner, 1997; Ulanovsky et al., 2004) and, on average, central frequencies have smaller frequency differences from the preceding trials compared to eccentric frequencies. As a result, adaptation is greatest for central frequencies and, significantly, the response of the neuron to the eccentric frequencies is enhanced. This pattern of neural coding meets the algorithmic requirements necessary to explain the importance of the distribution mean in predicting the patterns of perception observed in the present experiments. The possibility that such a mechanism is consistent with the robust perceptual effects of distribution regularity on phonetic categorization is intriguing, but should not be over-interpreted without further explicit behavioral and physiological investigations.
B. Implications for speech processing
It is rather unexpected that a simple sequence of tones something like a tune should influence speech perception. However, considered in light of the natural soundscape in which we have evolved, the results of the present studies need not be entirely surprising. Sounds in the natural world rarely appear in isolation; rather, they are intermixed with common and rare acoustic events that change on multiple time scales (Nelken et al., 1999). Added to this complexity is the fact that sounds exist for mere moments. Thus, there are significant demands from the environment for fast, online adaptation to regularity as well as sensitivity to longer-term regularity in the acoustic input. Perceptual processing does not provide a passive, veridical representation of the acoustic environment; instead it provides a means of rapidly extracting information relevant to behavior in the present circumstances. So, too, when the acoustic signal is speech. From this perspective, the context in which a signal occurs is critical to its perception. Sensitivity to regularity and concomitant detection of change appears to be characteristic of auditory processing and may provide us with insights about behaviorally relevant questions in speech processing.
As an example, it has long been observed that listeners perceive vowel categories dependent on the spectral characteristics of a precursor sentence (Ladefoged and Broadbent, 1957) such that they appear to normalize perception for different talkers or accents. Many models suggest a speech-specific translation from the surface acoustic variability to a more canonical representation [see Repp (1982) for a review]. The nonlinguistic nature of the context effects elicited by the acoustic histories, coupled with their sentence-level time course, suggests the possibility such “normalization” may arise when spectral regularities in the acoustic environment produce contrastive effects on auditory processing and, concomitantly, speech categorization. The present results specifically suggest that sensitivity to the average spectrum of a particular speaker’s speech may help to resolve ambiguities in speech categorization later in an utterance through rather general auditory perceptual mechanisms not specific to speech, but nonetheless operating at a rather high level of auditory processing sensitive to statistical regularities unfolding across sentence-length time courses. This, of course, does not deny the importance of longer-term learning and generalization to familiar voices that is known to occur in speech processing (e.g., Johnson and Mullennix, 1997). However, it provides a means of reconsidering one of the classic issues in speech perception: how do listeners maintain perceptual constancy despite the considerable acoustic variability present in the speech signal? The “lack of invariance” between acoustics and speech categories has long been taken as evidence of the special status of speech perception relative to auditory perception in general (see Repp, 1982). Considering the effects of nonspeech contexts on speech categorization and the general perceptual mechanisms that might relate to them casts doubt on whether this supposition is necessary. Rather, the present data would argue, it is necessary to consider the fact that the problem of perceptual constancy in the presence of variable contexts is a very general problem faced by all perceptual systems, whatever the signal. Given the strong evidence of nonspeech context effects on speech categorization (Coady et al., 2003; Fowler et al., 2000; Holt, 1999; Holt and Kluender, 2000; Holt et al., 2000; Holt, 2005; Lotto et al., 2003; Lotto and Kluender, 1998) and the demonstration that a nonhuman species exhibits “phonetic” context effects (Lotto et al., 1997), it appears that speech communication makes use of general characteristics of perceptual processing to maintain perceptual constancy in the face of variability. The present results highlight that this may be accomplished by an adaptive tendency of the auditory perceptual system to seek regularity in acoustic input and exaggerate change relative to the regularity. Specifically, in the case of distributional regularity in the acoustic environment, the average frequency across time appears to be influential in auditory processing.
Acknowledgments
This work was supported by a James S. McDonnell Foundation award for Bridging Mind, Brain, and Behavior 21st Century Scientist Award, NIH Grant No. 5 RO1 DC04674-02, and a grant from the Bank of Sweden Tercentenary Foundation. The author thanks Christi Adams Gomez for help in conducting the experiments.
Footnotes
A recent investigation suggests that such effects also extend to temporal characteristics of the acoustic environment (Wade and Holt, 2005c).
References
- Brosch M, Schreiner C. Time course of forward masking tuning curves in cat primary auditory cortex. J Neurophysiol. 1997;77:923–943. doi: 10.1152/jn.1997.77.2.923. [DOI] [PubMed] [Google Scholar]
- Brown R, MacLeod D. Color appearance depends on the variance of surround colors. Curr Biol. 1997;7:844–849. doi: 10.1016/s0960-9822(06)00372-1. [DOI] [PubMed] [Google Scholar]
- Carandini M. Visual cortex: Fatigue and adaptation. Curr Biol. 2000;10:R605–R607. doi: 10.1016/s0960-9822(00)00637-0. [DOI] [PubMed] [Google Scholar]
- Chevreul ME. The Laws of Contrast of Colours and Their Application to the Arts. Routledge; London: 1845. [Google Scholar]
- Coady JA, Kluender KR, Rhode WS. Effects of contrast between onsets of speech and other complex spectra. J Acoust Soc Am. 2003;114:2225–2235. doi: 10.1121/1.1608955. [DOI] [PMC free article] [PubMed] [Google Scholar]
- Condon C, Weinberger N. Habituation produces frequency-specific plasticity of receptive fields in the auditory cortex. Behav Neurosci. 1991;105:416–430. doi: 10.1037//0735-7044.105.3.416. [DOI] [PubMed] [Google Scholar]
- Creutzfeldt O, Hellwag F, Schreiner C. Thalamocortical transformation of responses to complex auditory stimuli. Exp Brain Res. 1980;39:87–104. doi: 10.1007/BF00237072. [DOI] [PubMed] [Google Scholar]
- Darwin CJ, McKeown JD, Kirby D. Perceptual compensation for transmission channel and speaker effects on vowel quality. Speech Commun. 1989;8:221–234. [Google Scholar]
- da Vinci L. Treatise on Painting. Princeton U.P.; Princeton, NJ: 1492. [Google Scholar]; Diehl R, Lotto A, Holt LL. Speech perception. Annu Rev Psychol. 2004;55:149–179. doi: 10.1146/annurev.psych.55.090902.142028. [DOI] [PubMed] [Google Scholar]
- Dragoi V, Sharma J, Sur M. Adaptation-induced plasticity of orientation tuning in adult visual cortex. Neuron. 2000;28:287–298. doi: 10.1016/s0896-6273(00)00103-3. [DOI] [PubMed] [Google Scholar]
- Fairhall AL, Lewen GD, Bialek W, de Ruyter van Steveninck RR. Efficiency and ambiguity in an adaptive neural code. Nature (London) 2001;412:787–792. doi: 10.1038/35090500. [DOI] [PubMed] [Google Scholar]
- Fowler CA, Brown JM, Mann VA. Contrast effects do not underlie effects of preceding liquids on stop-consonant identification by humans. J Exp Psychol Hum Percept Perform. 2000;26:877–888. doi: 10.1037//0096-1523.26.3.877. [DOI] [PubMed] [Google Scholar]
- Francis AL, Ciocca V, King Yu Wong N, Ho Yin Leung W, Cheuk Yan Chu P. Extrinsic context affects perceptual normalization of lexical tone. J Acoust Soc Am. 2006;119:1712–1726. doi: 10.1121/1.2149768. [DOI] [PubMed] [Google Scholar]
- Gow DW. Feature parsing: Feature cue mapping in spoken word recognition. Percept Psychophys. 2003;65:575–590. doi: 10.3758/bf03194584. [DOI] [PubMed] [Google Scholar]
- Greenwood DD, Joris PX. Mechanical and ‘temporal’ filtering as codeterminants of the response by cat primary fibers to amplitude-modulated signals. J Acoust Soc Am. 1996;99:1029–1039. doi: 10.1121/1.414632. [DOI] [PubMed] [Google Scholar]
- Hauser MD, Newport EL, Aslin RN. Segmentation of the speech stream in a non-human primate: statistical learning in cotton-top tamarins. Cognition. 2001;75:1–12. doi: 10.1016/s0010-0277(00)00132-3. [DOI] [PubMed] [Google Scholar]
- Helmholtz H. Physiological Optics. Optical Society of America; Rochester, NY: 1866. [Google Scholar]
- Holt LL. Auditory constraints on speech perception: An examination of spectral contrast. Diss Abstr Int, B. 1999;61:556. [Google Scholar]
- Holt LL. Temporally non-adjacent non-linguistic sounds affect speech categorization. Psychol Sci. 2005;16:305–312. doi: 10.1111/j.0956-7976.2005.01532.x. [DOI] [PubMed] [Google Scholar]
- Holt LL. Speech categorization in context: joint effects of nonspeech and speech precursors. J Acoust Soc Am. 2006;119:4016–4026. doi: 10.1121/1.2195119. [DOI] [PMC free article] [PubMed] [Google Scholar]
- Holt LL, Kluender KR. General auditory processes contribute to perceptual accommodation of coarticulation. Phonetica. 2000;57:170–180. doi: 10.1159/000028470. [DOI] [PubMed] [Google Scholar]
- Holt LL, Lotto A. Behavioral examinations of the level of auditory processing of speech context effects. Hear Res. 2002;167:156–169. doi: 10.1016/s0378-5955(02)00383-0. [DOI] [PubMed] [Google Scholar]
- Holt LL, Lotto AJ, Kluender KR. Neighboring spectral content influences vowel identification. J Acoust Soc Am. 2000;108:710–722. doi: 10.1121/1.429604. [DOI] [PubMed] [Google Scholar]
- Johnson KJ, Mullennix JW. Talker Variability in Speech Processing. Academic; San Diego: 1997. [Google Scholar]
- Kiefte MJ, Kluender KR. Spectral tilt versus formant frequency in static and dynamic vowels. J Acoust Soc Am. 2001;109:2294–2295. [Google Scholar]
- Kluender KR, Lotto AJ, Holt LL, Bloedel SB. Role of experience in language-specific functional mappings for vowel sounds as inferred from human, nonhuman, and computational models. J Acoust Soc Am. 1998;104:3568–3582. doi: 10.1121/1.423939. [DOI] [PubMed] [Google Scholar]
- Ladefoged P, Broadbent DE. Information conveyed by vowels. J Acoust Soc Am. 1957;29:98–104. doi: 10.1121/1.397821. [DOI] [PubMed] [Google Scholar]
- Lotto AJ, Holt LL. Putting phonetic context effects into context: A commentary on Fowler (2006) Percept Psychophys. 2006;68:178–183. doi: 10.3758/bf03193667. [DOI] [PMC free article] [PubMed] [Google Scholar]
- Lotto AJ, Kluender KR. General contrast effects of speech perception: Effect of preceding liquid on stop consonant identification. Percept Psychophys. 1998;60:602–619. doi: 10.3758/bf03206049. [DOI] [PubMed] [Google Scholar]
- Lotto AJ, Kluender KR, Holt LL. Perceptual compensation for coarticulation by Japanese quail (Coturnix coturnix japonica) J Acoust Soc Am. 1997;102:1134–1140. doi: 10.1121/1.419865. [DOI] [PubMed] [Google Scholar]
- Lotto AJ, Sullivan S, Holt LL. Central locus for nonspeech context effects on phonetic identification. J Acoust Soc Am. 2003;113:53–56. doi: 10.1121/1.1527959. [DOI] [PubMed] [Google Scholar]
- Malone BJ, Semple MN. Effects of auditory stimulus context on the representation of frequency in the gerbil inferior colliculus. J Neurophysiol. 2001;86:1113–1130. doi: 10.1152/jn.2001.86.3.1113. [DOI] [PubMed] [Google Scholar]
- Malone BJ, Scott BH, Semple MN. Context-dependent adaptive coding of interaural phase disparity in the auditory cortex of awake macaques. J Neurosci. 2002;22:4625–4638. doi: 10.1523/JNEUROSCI.22-11-04625.2002. [DOI] [PMC free article] [PubMed] [Google Scholar]
- Mann VA. Influence of preceding liquid on stop-consonant perception. Percept Psychophys. 1980;28:407–412. doi: 10.3758/bf03204884. [DOI] [PubMed] [Google Scholar]
- Maye J, Werker J, Gerken L. Infant sensitivity to distributional information can affect phonetic discrimination. Cognition. 2002;82:B101–B111. doi: 10.1016/s0010-0277(01)00157-3. [DOI] [PubMed] [Google Scholar]
- Miller L, Escabi M, Read H, Schreiner C. Spectral-temporal receptive fields in the lemniscal auditory thalamus and cortex. J Neurophysiol. 2002;87:151–160. doi: 10.1152/jn.00395.2001. [DOI] [PubMed] [Google Scholar]
- Mitterer H, Csépe V, Blomert L. The role of perceptual integration in the recognition of assimilated word forms. Q J Exp Psychol. 2006;59:1305–1334. doi: 10.1080/17470210500198726. [DOI] [PubMed] [Google Scholar]
- Movshon J, Lennie P. Pattern-selective adaptation in visual cortical neurons. Nature (London) 1979;278:850–852. doi: 10.1038/278850a0. [DOI] [PubMed] [Google Scholar]
- Müller JR, Metha AB, Krauskopf J, Lennie P. Rapid adaptation in visual cortical to the structure of images. Science. 1999;285:1405–1408. doi: 10.1126/science.285.5432.1405. [DOI] [PubMed] [Google Scholar]
- Näätänen R, Gaillard AW, Mantysalo S. Early selective-attention effect on evoked potential reinterpreted. Acta Psychol. 1978;42:313–329. doi: 10.1016/0001-6918(78)90006-9. [DOI] [PubMed] [Google Scholar]
- Näätänen R, Tervaniemi M, Sussman E, Paavilainen P, Winkler I. ‘Primitive intelligence’ in the auditory cortex. TINS. 2001;24:283–289. doi: 10.1016/s0166-2236(00)01790-2. [DOI] [PubMed] [Google Scholar]
- Nelken I, Rotman Y, Bar-Yosef O. Response of auditory cortex neurons to structural features of natural sounds. Nature (London) 1999;397:154–157. doi: 10.1038/16456. [DOI] [PubMed] [Google Scholar]
- Newman RS, Sawusch JR. Perceptual normalization for speaking rate: Effects of temporal distance. Percept Psychophys. 1996;58:540–560. doi: 10.3758/bf03213089. [DOI] [PubMed] [Google Scholar]
- Repp BH. Phonetic trading relations and context effects: New experimental evidence for a speech mode of perception. Psychol Bull. 1982;92:81–110. [PubMed] [Google Scholar]
- Saffran JR, Newport EL, Aslin RN. Word segmentation: The role of distributional cues. J Mem Lang. 1996;35:606–621. [Google Scholar]
- Saffran JR, Johnson EK, Aslin RN, Newport EL. Statistical learning of tone sequences by human infants and adults. Cognition. 1999;70:27–52. doi: 10.1016/s0010-0277(98)00075-4. [DOI] [PubMed] [Google Scholar]
- Saul A, Cynader M. Adaptation in single units in visual cortex: the tuning of aftereffects in the spatial domain. Visual Neurosci. 1989;2:593–607. doi: 10.1017/s0952523800003527. [DOI] [PubMed] [Google Scholar]
- Stephens JDW, Holt LL. Preceding phonetic context affects perception of non-speech sounds. J Acoust Soc Am. 2003;114:3036–3039. doi: 10.1121/1.1627837. [DOI] [PubMed] [Google Scholar]
- Summerfield Q. The Queen’s University of Belfast, Thesis. 1975. Information-processing analyses of perceptual adjustments to source and context variables in speech,”. [Google Scholar]
- Ulanovsky N, Las L, Nelken I. Processing of low-probability sounds by cortical neurons. Nat Neurosci. 2003;6:391–398. doi: 10.1038/nn1032. [DOI] [PubMed] [Google Scholar]
- Ulanovsky N, Las L, Farkas D, Nelken I. Multiple time scales of adaptation in auditory cortex neurons. J Neurosci. 2004;24:10440–10453. doi: 10.1523/JNEUROSCI.1905-04.2004. [DOI] [PMC free article] [PubMed] [Google Scholar]
- Wade T, Holt LL. Effects of later-occurring non-linguistic sounds on speech categorization. J Acoust Soc Am. 2005a;118:1701–1710. doi: 10.1121/1.1984839. [DOI] [PubMed] [Google Scholar]
- Wade T, Holt LL. Incidental categorization of spectrally complex non-invariant auditory stimuli in a computer game task. J Acoust Soc Am. 2005b;118:2618–2633. doi: 10.1121/1.2011156. [DOI] [PubMed] [Google Scholar]
- Wade T, Holt LL. Perceptual effects of preceding nonspeech rate on temporal properties of speech categories. Percept Psychophys. 2005c;67:939–950. doi: 10.3758/bf03193621. [DOI] [PubMed] [Google Scholar]
- Watkins AJ. Central, auditory mechanisms of perceptual compensation for spectral-envelope distortion. J Acoust Soc Am. 1991;90:2942–2955. doi: 10.1121/1.401769. [DOI] [PubMed] [Google Scholar]
- Watkins AJ, Makin SJ. Perceptual compensation for speaker differences and for spectral-envelope distortion. J Acoust Soc Am. 1994;96:1263–1282. doi: 10.1121/1.410275. [DOI] [PubMed] [Google Scholar]
- Watkins AJ, Makin SJ. Effects of spectral contrast on perceptual compensation for spectral-envelope distortions. J Acoust Soc Am. 1996;99:3749–3757. doi: 10.1121/1.414981. [DOI] [PubMed] [Google Scholar]