Summary
Functional neuroimaging has successfully identified brain areas that show greater responses to visual motion [1–3] and adapted responses to repeated motion directions [4–6]. However, such methods have been thought to lack the sensitivity and spatial resolution to isolate direction-selective responses to individual motion stimuli. Here, we used functional magnetic resonance imaging (fMRI) and pattern classification methods [7–10] to show that ensemble activity patterns in human visual cortex contain robust direction-selective information, from which it is possible to decode seen and attended motion directions. Ensemble activity in areas V1–V4 and MT+ allowed us to decode which of 8 possible motion directions the subject was viewing on individual stimulus blocks. Moreover, ensemble activity evoked by single motion directions could effectively predict which of two overlapping motion directions was the focus of the subject’s attention, and presumably dominant in perception. Our results indicate that feature-based attention can bias direction-selective population activity in multiple visual areas, including MT+/V5 and early visual areas (V1–V3), consistent with gain modulation models of feature-based attention and theories of early attentional selection. Our approach for measuring ensemble direction selectivity may provide new opportunities to investigate relationships between attentional selection, conscious perception, and direction-selective responses in the human brain.
Results
In this study, we investigated whether ensemble activity patterns in the human visual cortex contain sufficiently reliable direction-selective information to decode seen and attended motion directions. We hypothesized that each voxel may have a weak but true bias in direction selectivity, and therefore the pooled output of many voxels might provide robust direction information. Such biases might arise from random variations in the distribution or response strength of neurons tuned to different directions across local regions of cortex. Irregularity in columnar organization (~300–600 μm width) or biases in vasculature patterns might also lead to greater variability in direction selectivity at more coarse spatial scales of sampling [10]. By pooling the ensemble information available from many weakly direction-selective voxels obtained from individual visual areas, we evaluated whether it is possible to decode which motion direction was being viewed on individual stimulus blocks and which of two overlapping motion directions was perceptually dominant due to feature-based attentional selection.
We predicted (decoded) the motion direction being viewed from the fMRI activity of each subject using a “direction decoder” (Figure 1). The input to the decoder was an averaged fMRI activity pattern in a 16-s stimulus period during which the subject perceived limited-lifetime random dots moving in one of 8 directions (0°, 45°,…, 315°). fMRI activity was collected at 3x3x3 mm resolution using standard methods, and the intensity pattern of fMRI voxels identified in areas V1–V4 and MT+/V5 (“MT+”, hereafter) were used for the analysis (see Experimental Procedures). The decoder consisted of a statistical linear classifier that was first trained to learn the relationship between fMRI activity patterns and motion directions using a training data set. It was then used to predict the corresponding motion direction of an independent data set to evaluate generalization performance. Cross-validation performance served as an index of direction selectivity for each visual area of interest.
Figure 1.
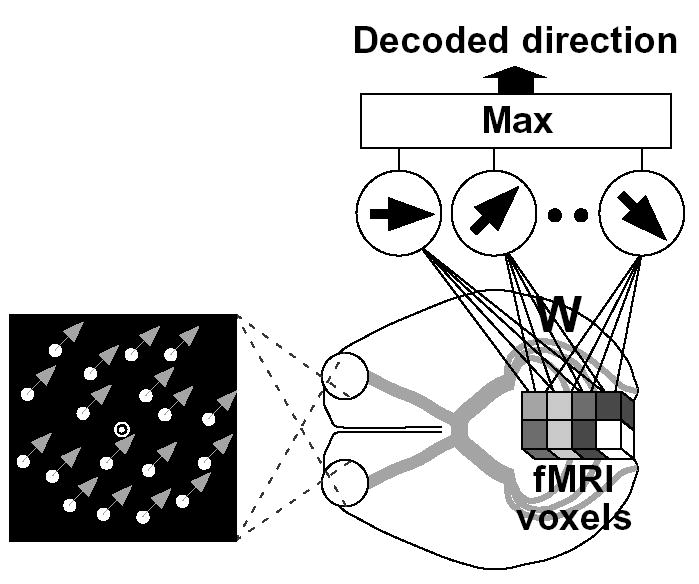
Decoding analysis of ensemble fMRI signals. An fMRI activity pattern (cubes) was analyzed by a “direction decoder” to predict the direction of moving dots seen by the subject. The decoder received fMRI voxel intensities, averaged for each 16-s stimulus block, as inputs. The next layer consisting of “linear ensemble direction detectors” calculated the weighed sum of voxel inputs. Voxel weights were optimized using a statistical learning algorithm applied to independent training data, so that each detector’s output became larger for its direction than for the others. The direction of the most active detector was used as the prediction of the decoder.
Ensemble activity from areas V1-MT+ (total 900 voxels) led to remarkably precise decoding of stimulus direction for all 4 subjects (Figure 2A, individual directions for a representative subject; Figure 2B, 8 directions pooled for all 4 subjects; 63.4±5.0% correct; chance performance, 12.5%). These results indicate that ensemble patterns of fMRI activity in these visual areas contain reliable direction-selective information. We also calculated decoding performance for the motion-sensitive region MT+ separately, which is thought to be a homologue of the direction-selective areas MT and MST in the macaque monkey [1, 2, 11]. Although MT+ is a small region with fewer available voxels for analysis (~100 voxels), direction decoding exceeded chance performance for all subjects (Figure 2C, binomial test, P < 0.005 in all subjects).
Figure 2.
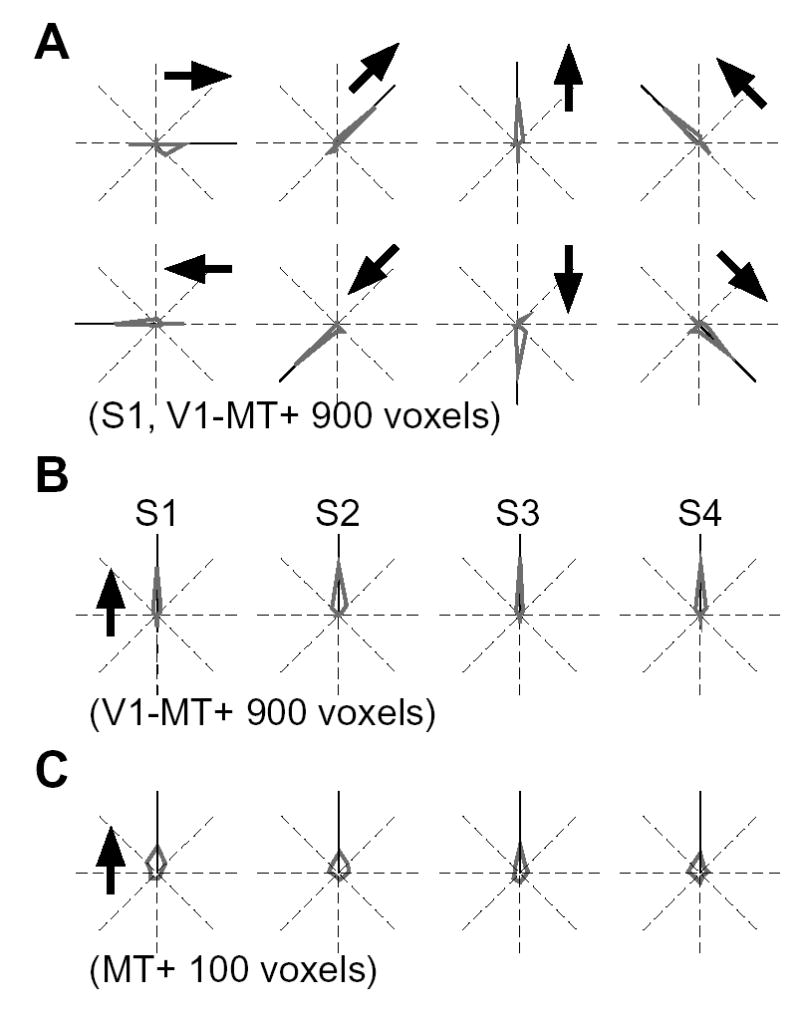
Decoding results for 8 motion directions. (A) Distribution of decoded directions (gray) for each of 8 directions in a representative subject S1 (900 voxels from V1-MT+, 22 samples per direction). Arrows show the true stimulus directions. (B, C) Distribution of decoded directions for all 4 subjects, using 900 voxels from V1-MT+ (B), and using 100 voxels from MT+ (C). Results for individual directions are realigned relative to the upward direction (arrow).
Analysis of individual areas revealed above-chance levels of direction decoding for each region tested (200 voxels for each of areas V1, V2, V3, and V3a/V4 combined, and 100 voxels for MT+; binomial test, P < 0.005 in all areas and subjects; Figure 3). For this analysis, voxels from V3a and V4 were combined for the present analysis to equate for the number of voxels across retinotopic areas. Interestingly, errors were found more frequently at the opposite direction than at orthogonal directions for areas V1–V4 (t-test, P < 0.01) but not in MT+ (Figure 3A). This is potentially consistent with the columnar organization of motion direction found in the early visual areas of some animals, in which direction preference often shifts abruptly by 180° [12–14]. Under such conditions, columns for opposite motion directions would be more likely to be sampled together by voxels than those for orthogonal directions.
Figure 3.
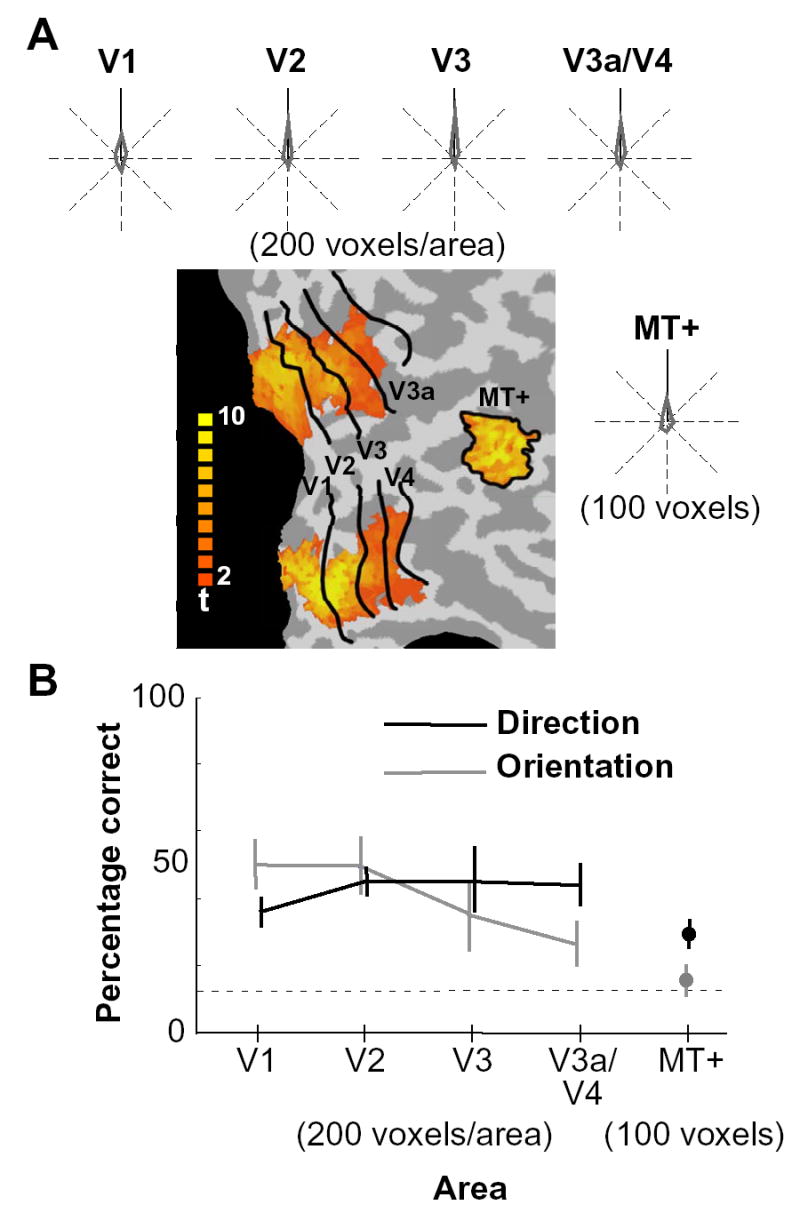
Direction selectivity across the human visual pathway. (A) Distributions of decoded directions are shown for individual visual areas from V1 through V3a/V4 and MT+ (S3, 200 voxels from each of areas V1 through V3a/V4, and 100 voxels from MT+). The voxels from V3a and V4 were combined to make the number of available voxels comparable to those from V1, V2, and V3. Results for 8 directions are realigned relative to the upward direction (solid line). The color map indicates t-values associated with the responses to the visual field localizer for V1 through V4, and to the MT+ localizer for MT+, which were used to select the voxels to be analyzed (see Experimental Procedures). Voxels from both hemispheres (and from dorsal and ventral portions of V1-V4) were combined to obtain the decoding results (only the right hemisphere is shown). (B) Comparison of direction and orientation selectivity. Cross-validation performance for the classification of 8 directions (black) and 8 orientations [10] is plotted by visual area (chance level, 12.5% indicated by a dotted line; error bar, standard deviation across 4 subjects).
Overall, we observed no significant difference in decoding performance across early visual areas V1–V4 (Figure 3B). Although human visual area V3a is known to be functionally distinct from V4 and more responsive to visual motion than to static or flickering stimuli [15, 16], activity patterns in each of these areas led to comparable levels of performance, revealing no evidence of greater direction selectivity in V3a (100 voxels from each area; 30.0 ±2.3% and 34±10.2% correct for V3a and V4, respectively; chance performance, 12.5%).
Although decoding performance appeared to be somewhat lower for motion-sensitive area MT+ than other areas, this difference was attributable to the comparatively small size of MT+. When only 100 voxels were analyzed from each visual area to match the number of voxels available in MT+, performance was comparable across all visual areas and did not reliably differ. Furthermore, the degree of direction selectivity found across visual areas differed from degree of orientation selectivity found in our previous study [10]. Orientation selectivity was most pronounced in areas V1 and V2, and declined in higher extrastriate areas, with no evidence of ensemble orientation selectivity in MT+ (Figure 3B). Although MT+ exhibited only a moderate level of direction selectivity when analyzed with our method, the comparison with orientation selectivity is consistent with the notion that this region is more sensitive to motion than to form information.
Plots of the direction preference of individual voxels on flattened cortical maps revealed scattered patterns that were variable and idiosyncratic across subjects (Supplemental Figure 1 and 2). There was no clear global pattern of direction selectivity in retinotopic cortex as one might expect if different motion directions led to systematic shifts in eye position or differential responses at the leading and trailing edges of the motion stimulus [17]. If motion decoding were due to global shifts of the activated region in retinotopic cortex, then regions corresponding to the boundary of the stimulus should be more informative than regions corresponding the middle of the stimulus. However, decoding performance was much worse for retinotopic regions around the border of the stimulus as compared to the middle of the stimulus (40±7.5% and 60±5.2% correct, respectively; chance performance, 12.5%; 400 voxels from V1–V4). Additional experiments using rotational motion, which is less likely to cause systematic eye movements or global shifts in retinotopic activity, revealed similar levels of decoding performance as translational motion (classification of two opposing directions for rotation and translation, 72±8.2% and 80±7.8% correct, respectively). To further test whether motion decoding depended on some type of global retinotopic modulation associated with different stimulus directions, we performed the same decoding analysis after normalizing the voxels intensities within subsets of voxels corresponding to different polar angles or eccentricities in the visual field. This was done by dividing the visual field into 16 different polar angle sectors or eccentricities, identifying all voxels in V1–V4 that responded best to a particular polar angle or eccentricity, and subtracting out the mean activity level of the voxels corresponding to each polar angle or eccentricity. Even after this normalization procedure, the decoding performance remained nearly the same, indicating the importance of local variations in motion preference across retinotopic cortex.
Supplemental Figure 1.
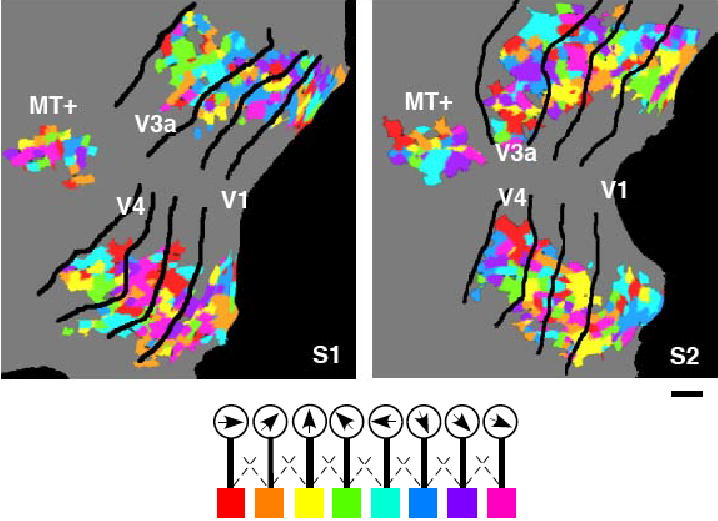
Direction preference maps plotted on flattened cortical surfaces. Color maps depict the direction preference of individual voxels on the flattened surface of left V1 through MT+ for subjects S1 and S2 (scale bar, 1 cm). Each color patch is the cross section of a single voxel (3x3x3 mm) at the gray-white matter boundary. Voxel colors depict the direction detector for which each voxel provides the largest weight. The overall color map indicates a template pattern that activates each detector most effectively. The weights were calculated using 900 voxels from V1 through MT+. Other subjects also showed scattered but different patterns of direction preference.
Supplemental Figure 2.
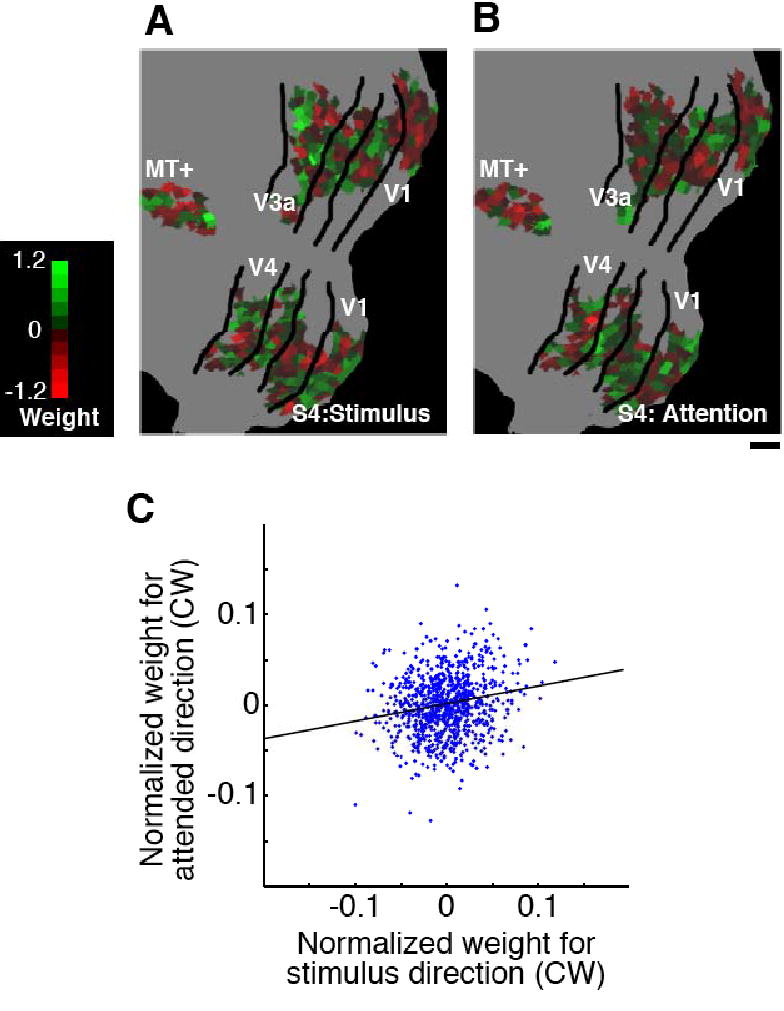
Comparison of preference/weight maps for stimulus motion direction and attended direction. (A, B) Maps of the weights calculated to discriminate two rotational motion directions for stimulus direction (A), and for attended direction (B) (subject S4; V1-MT+ 900 voxels; scale bar, 1 cm). Color indicates the sign and amplitude of the weights for clockwise motion (flipped signs for counterclockwise motion). (C) Correlation between the weights for stimulus and attended direction. The scatter plot shows the normalized weights for stimulus and attended direction (clockwise) for each voxel (subject S4). The solid line indicates the regression line for these two sets of weights. Although there is no apparent similarity between the two weight maps (A and B), their correlation was statistically significant (correlation coefficient, 0.14 ±0.04; P < 0.001 in all 4 subjects).
Finally, we tested whether cortical visual activity can reveal which of two overlapping motion directions is dominant in a person’s mind when viewing two groups of dots moving in opposite directions (Figure 4). This experiment allowed us to test whether feature-based attention can lead to top-down bias of direction-selective population responses in the visual cortex when conflicting motion direction signals originate from a common spatial location. First, a decoder was trained to discriminate fMRI responses to dots rotating either clockwise or counterclockwise (stimulus blocks). Then we tested whether the trained decoder could classify perceived motion direction under ambiguous stimulus conditions in which both clockwise and counterclockwise moving dots were presented simultaneously (attention blocks). Subjects performed a speed discrimination task on only one set of dots, thereby restricting attention to one direction.
Figure 4.
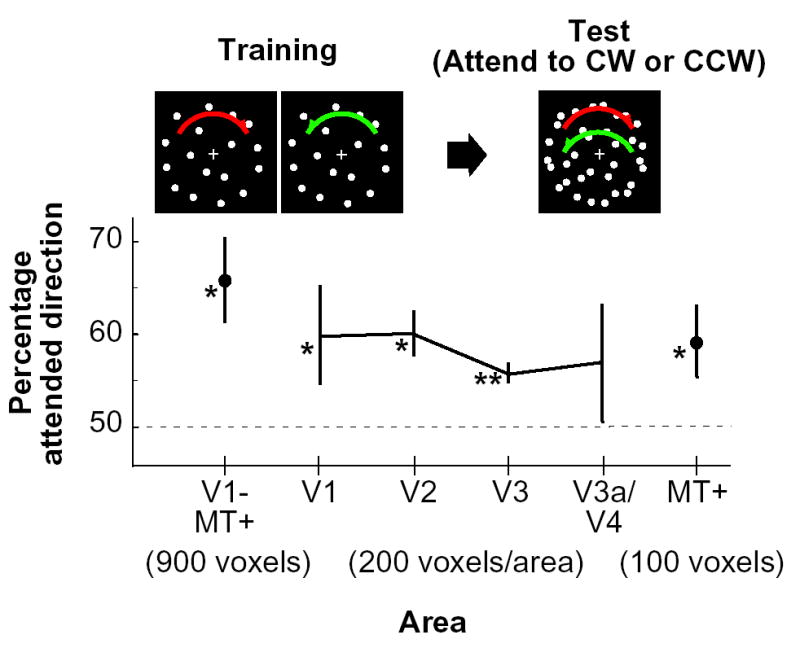
“Mind-reading” of attended direction. Decoding accuracy of attended direction is plotted by visual area (error bar, standard deviation across 4 subjects; chance level, 50%). For the analysis, we used 900 voxels from V1–MT+, 200 voxels from each of areas V1 through V3a/V4, and 100 voxels from MT+. Asterisks indicate direction decoding that exceeds chance-level performance, as assessed by a statistical t-test of group data (*, P < 0.05; **, P < 0.01). When the voxels from each of V3a and V4 were analyzed separately (100 voxels from each), only V4 showed significantly above-chance performance (P < 0.05).
The decoded motion direction for ensemble activity in areas V1-MT+ (total 900 voxels) was reliably biased toward the attended direction (Figure 4; t-test of group data, P < 0.05). Additional analyses of individual visual areas also revealed significant bias effects in V1, V2, V3, and MT+. When V3a and V4 were separately analyzed (100 voxels each), a significant bias effect was also observed in V4. Overall, the results indicate that the direction attended in an ambiguous motion display can be predicted from fMRI signals in visual cortex, based on the activity patterns induced by unambiguous stimulus directions. Direction-selective ensemble activity can be reliably biased by feature-based attention, and these bias effects begin to occur at early stages of the visual pathway.
We conducted additional analyses to assess the reliability of cortical activity patterns for attended motion directions and single motion directions, and the similarity between these activity patterns. For individual experimental blocks, the attended motion direction could be predicted from the activity patterns obtained from all other attention blocks (cross-validation performance using 900 voxels from V1-MT+, 63±6.0% correct), but performance was no better than our ability to decode the attended direction from activity patterns elicited by single motion directions (66±5.9% correct). An analysis of direction preferences plotted on the visual cortex revealed a small but reliable correlation between template activity patterns for stimulus motion and attended motion (R = 0.14 ±0.04, P < 0.001 in all subjects; Supplemental Figure 2). Thus, paying attention to one direction in an ambiguous motion display can produce activity patterns that are more similar to those induced by a stimulus of the same single direction.
Discussion
We have shown that ensemble fMRI signals in the human visual cortex contain reliable direction information that allows for prediction of seen and attended motion directions. Direction-selective ensemble activity was found throughout the human visual pathway in areas V1–V4 and MT+, as indicated by reliable decoding of the motion direction viewed on individual stimulus blocks. Activity not only reflected the seen motion stimulus but also reflected the attended or perceptually dominant motion when subjects viewed two overlapping sets of random dots moving in opposite directions. Ensemble activity in multiple visual areas, including areas V1–V3 and MT+, was reliably biased toward the attended motion direction.
These results provide novel evidence that feature-based attention can alter the strength of direction-selective responses throughout the visual pathway, with top-down bias effects emerging at very early stages of visual processing. Our results are consistent with current theories of feature-based attention, such as the feature-similarity gain model [18] and the biased competition model of attention [19]. These models assume that attention modulates the activity of individual neurons according to the similarity between the attended feature and the neuron’s preferred feature. When attention is directed toward a feature in the presence of competing features, such modulation will enhance the activity of neurons preferring the attended feature (or suppress neurons preferring unattended features). As a result, one would predict that attention should bias the pattern of neural activity to more closely resemble the activity pattern that would be induced by the attended feature alone, as was found here using fMRI pattern analysis of population activity.
Previous neurophysiological studies in monkeys have shown that feature-based attention can alter the gain of direction-selective neurons in area MT [20, 21], but little is known about whether direction-selective activity may be biased in early visual areas. Human neuroimaging studies have shown that directing attention to a moving stimulus as opposed to an overlapping stationary stimulus leads to enhanced activity in MT+ [22]. Feature-based attention can also enhance the strength of fMRI responses throughout the human visual pathway for an unattended motion stimulus if it matches the direction of attended motion presented elsewhere in the visual field [23]. These neuroimaging studies have relied on measures other than direction selectivity to infer the effects of feature-based attention. Here, we found that feature-based attention can directly alter the strength of direction-selective activity in the human visual cortex for the attended stimulus in question, with reliable bias effects occurring not only in MT+ but emerging as early as V1. These results complement our recent findings that feature-based attention can bias orientation-selective ensemble activity in V1 and higher areas [10], indicating the generality of these attentional bias effects. Such biasing of activity at the earliest stages of visual cortical processing may be important for maximizing the efficiency of top-down attentional selection in many feature domains, and may also be important for enhancing the representation of attended visual features in awareness [24, 25].
Although the proportion of direction-selective neurons is known to vary across areas of the primate visual system, we observed comparable levels of ensemble direction selectivity across visual areas. Given that human MT+ is highly motion-sensitive [1–3] and that monkey MT is rich in direction-selective neurons and shows evidence of columnar organization [26, 27], one might ask why decoding performance was not better for this region. Area MT+ was about half the size of other visual areas, and thus only a small number of voxels were available for analysis. Our ability to extract fine-scale information from coarse-scale activity patterns may be limited by the absolute size of an anatomical region. It is also possible that the spatial arrangement of direction-selective columns in MT+ may be very uniformly distributed or involve considerable pairing of opponent motion directions in neighboring columns [27], such that the local region sampled by each voxel exhibits only a very small bias in the proportion of neurons tuned to different directions. Finally, it seems likely that early human visual areas are also quite sensitive to motion direction. Although direction-selective columns have not been demonstrated in early visual areas of primates, such columns have been found in striate and extrastriate areas of other animals [12, 13]. fMRI studies of both humans and monkeys have also revealed that early visual areas show reliable effects of direction-selective adaptation [4–6, 28], suggesting a continuum of motion processing throughout the visual pathway.
Because our method depends on random variations in the proportion of direction-selective units within single voxels, careful examination will be necessary when one relates the direction selectivity measured with our method to that observed at the columnar [12, 13] and cellular [14] levels. It should be noted that the degree of decoding accuracy may not directly reflect direction selectivity of individual neurons in an area of interest, since it depends also on how direction-selective units and their responses are spatially distributed. Future studies will be necessary to characterize how variations in the distribution of direction-selective neurons at multiple spatial scales may contribute to the weakly direction-biased signals found in each of the visual areas investigated here.
Despite these limitations, our method provides a unique opportunity to investigate visual direction selectivity in humans, which has been challenging to study with conventional neuroimaging approaches [2, 4, 29]. The neural decoding approach presented here may be extended to the study of the neural substrates underlying various subjective motion phenomena and illusions [30], by comparing subjective perception and decoded directions for different brain regions of interest. These methods may be effectively applied to test whether direction-selective activity in specific visual areas may reflect the contents of visual awareness [25, 31] or show evidence of residual visual processing for unperceived stimuli [32]. Thus, our approach for measuring direction-selective responses in individual areas of the human brain may provide a powerful new tool for investigating the relationship between the neural representation of motion direction and the subjective contents of motion perception.
Experimental Procedures
Subjects
Four healthy adults with normal or corrected-to-normal visual acuity participated in this study. All subjects gave written informed consent. The study was approved by the Institutional Review Panel for Human Subjects at Princeton University.
Experimental design and stimuli
Visual stimuli were rear-projected onto a screen in the scanner bore using a luminance-calibrated LCD projector driven by a Macintosh G3 computer. All experimental runs consisted of a series of 16-s stimulus blocks (not interleaved with rest periods) with a 16-s fixation-rest period occurring at the beginning and at the end of each run. In the first experiment, subjects viewed random dots drifting in each of 8 possible motion directions (dot lifetime 200 ms, 1000 dots per display), in a randomized order for each run. Subjects maintained fixation on a central fixation point while motion stimuli were presented in an annulus aperture (2°–13.5° of eccentricity) at varying speeds (~8°/s) while subjects performed a two-interval speed discrimination task (stimulus duration 1.5 s, interstimulus interval 250 ms, intertrial interval 750 ms, 4 trials/block). An adaptive staircase procedure was used to maintain task performance at about 80% correct (QUEST; [33]). Each subject performed 20–22 runs for a total of 20–22 trials per motion direction.
In the second experiment, random-dot displays were presented using rotational motion while subjects performed the speed discrimination task. For training runs, either clockwise or counter-clockwise moving dots were presented (0.167 revolutions/s). For test runs, both motion directions were simultaneously presented with half of the dots assigned to each direction. The color of the fixation point indicated the motion direction to be attended for the discrimination task. A single run had 16 stimulus blocks in randomized order; 8 blocks for each condition. Subjects performed a total of 6 training runs and 6 test runs. (Training and test runs were interleaved.)
In a separate run, subjects viewed a reference stimulus to localize the retinotopic regions corresponding to the stimulated visual field. The “visual field localizer” consisted of high-contrast dynamic random dots that were presented in an annular region for 12-s periods, interleaved with 12-s rest/fixation periods, while the subject maintained fixation. We used a smaller annular region for the visual field localizer (4°–11.5° of eccentricity) than for the motion stimuli (2°–13.5°) to avoid selecting voxels corresponding to the stimulus edges, which may contain information irrelevant to motion direction. In separate sessions, standard retinotopic mapping [34, 35] and MT+ localization procedures [1, 2] were performed to delineate visual areas on flattened cortical representations.
fMRI data preprocessing
All fMRI data underwent 3-D motion correction [36], followed by linear trend removal. No spatial or temporal smoothing was applied. fMRI data were aligned to retinotopic mapping data collected in a separate session, using Brain Voyager software (Brain Innovation). Automated alignment procedures were followed by careful visual inspection and manual fine-tuning at each stage of alignment to correct for misalignment error. Rigid-body transformations were performed to align fMRI data to the within-session 3D-anatomical scan, and next to align these data to retinotopy data. After across-session alignment, fMRI data underwent Talairach transformation and reinterpolation using 3x3x3 mm voxels. This transformation allowed us to restrict voxels around the gray-white matter boundary and to delineate individual visual areas on flattened cortical representations. Note, however, that these procedures involving motion correction and interpolation of the raw fMRI data may have resulted in the reduction of direction information that may be contained in fine-scale activity patterns.
Voxels used for decoding analysis were selected on the cortical surface of V1 through V4 and MT+. First, voxels near the gray-white matter boundary were identified within each visual area using retinotopic maps delineated on a flattened cortical surface representation. Then, the voxels were sorted according to the responses to the visual field localizer (V1–V4) or to the MT+ localizer. We used 200 voxels for each of areas V1, V2, V3, and V3a/V4, and 100 voxels for MT+ by selecting the most activated voxels.
The data samples used for decoding analysis were created by shifting the fMRI time series by 4 seconds to account for the hemodynamic delay, and averaging the MRI signal intensity of each voxel for each 16-s block. Response amplitudes of individual voxels were normalized relative to the average of the entire time course within each run (excluding the rest periods at the beginning and the end) to minimize baseline differences across runs.
Decoding analysis
We constructed a direction decoder to classify ensemble fMRI activity according to motion direction (Figure 1). The input consisted of the response amplitudes of fMRI voxels in the visual area(s) of interest, averaged for each 16-s block. A linearly weighted sum of voxel intensities was calculated for each direction by a unit called “linear ensemble direction detector”; the voxel weights were optimized so that each detector’s output became larger for its direction than for the others. The final output prediction was made by selecting the most active detector as the most likely direction to be present.
The calculation performed by each linear ensemble direction detector with preferred direction θk can be expressed by a linear function of voxel inputs x=(x1, x2,..., xd) (“linear detector function”)
where wt is the “weight” of voxel i, and w0 is the “bias”. To achieve this function for each direction, we first calculated linear discriminant functions for the pairs of all directions using linear support vector machines [37] (SVM). The discriminant function, gθk θl(x) for the discrimination of directions θk and θl, is expressed by a weighted sum of voxel inputs plus bias, and satisfies
Using a training data set, a linear SVM finds optimal weights and bias for the discriminant function. After the normalization of the weight vectors, the pairwise discriminant functions comparing θk and the other directions were simply added to yield the linear detector function
This linear detector function becomes larger than zero when the input x (in the training data set) is an fMRI activity pattern induced by direction θk. Note that other algorithms, such as Perceptrons or Fisher’s linear discriminant method combined with principal component analysis, could be used to analyze and classify fMRI activity patterns [8, 32 38].
To evaluate direction decoding performance, we performed a version of cross-validation by testing the fMRI samples in one run using a decoder trained with the samples from all other runs. This training-test set was repeated for all runs (“leave-one-run-out” cross-validation). We used this procedure to avoid using the samples in the same run both for training and test, since they are not independent because of the normalization of voxel intensity within each run.
Acknowledgments
We thank D. Remus, J. Kerlin, and E. Ferneyhough for technical support and the Princeton Center for Brain, Mind and Behavior for MRI support. This work was supported by grants from Japan Society for the Promotion of Science, Nissan Science Foundation, and National Institute of Information and Communications Technology to Y.K., and grants R01-EY14202 and P50-MH62196 from the National Institutes of Health to F.T.
References
- 1.Zeki S, Watson JD, Lueck CJ, Friston KJ, Kennard C, Frackowiak RS. A direct demonstration of functional specialization in human visual cortex. J Neurosci. 1991;11:641–649. doi: 10.1523/JNEUROSCI.11-03-00641.1991. [DOI] [PMC free article] [PubMed] [Google Scholar]
- 2.Tootell RB, Reppas JB, Kwong KK, Malach R, Born RT, Brady TJ, Rosen BR, Belliveau JW. Functional analysis of human MT and related visual cortical areas using magnetic resonance imaging. J Neurosci. 1995;15:3215–3230. doi: 10.1523/JNEUROSCI.15-04-03215.1995. [DOI] [PMC free article] [PubMed] [Google Scholar]
- 3.Heeger DJ, Boynton GM, Demb JB, Seidemann E, Newsome WT. Motion opponency in visual cortex. J Neurosci. 1999;19:7162–7174. doi: 10.1523/JNEUROSCI.19-16-07162.1999. [DOI] [PMC free article] [PubMed] [Google Scholar]
- 4.Huk AC, Heeger DJ. Pattern-motion responses in human visual cortex. Nat Neurosci. 2002;5:72–75. doi: 10.1038/nn774. [DOI] [PubMed] [Google Scholar]
- 5.Nishida S, Sasaki Y, Murakami I, Watanabe T, Tootell RB. Neuroimaging of direction-selective mechanisms for second-order motion. J Neurophysiol. 2003;90:3242–3254. doi: 10.1152/jn.00693.2003. [DOI] [PubMed] [Google Scholar]
- 6.Seiffert AE, Somers DC, Dale AM, Tootell RB. Functional MRI studies of human visual motion perception: texture, luminance, attention and after-effects. Cereb Cortex. 2003;13:340–349. doi: 10.1093/cercor/13.4.340. [DOI] [PubMed] [Google Scholar]
- 7.Haxby JV, Gobbini MI, Furey ML, Ishai A, Schouten JL, Pietrini P. Distributed and overlapping representations of faces and objects in ventral temporal cortex. Science. 2001;293:2425–2430. doi: 10.1126/science.1063736. [DOI] [PubMed] [Google Scholar]
- 8.Cox DD, Savoy RL. Functional magnetic resonance imaging (fMRI) “brain reading”: detecting and classifying distributed patterns of fMRI activity in human visual cortex. Neuroimage. 2003;19:261–270. doi: 10.1016/s1053-8119(03)00049-1. [DOI] [PubMed] [Google Scholar]
- 9.Mitchell TM, Hutchinson R, Niculescu RS, Pereira F, Wang X, Just M. Learning to decode cognitive states from brain images. Mach Learn. 2004;57:145–175. [Google Scholar]
- 10.Kamitani Y, Tong F. Decoding the visual and subjective contents of the human brain. Nat Neurosci. 2005;8:679–685. doi: 10.1038/nn1444. [DOI] [PMC free article] [PubMed] [Google Scholar]
- 11.Huk AC, Dougherty RF, Heeger DJ. Retinotopy and functional subdivision of human areas MT and MST. J Neurosci. 2002;22:7195–7205. doi: 10.1523/JNEUROSCI.22-16-07195.2002. [DOI] [PMC free article] [PubMed] [Google Scholar]
- 12.Weliky M, Bosking WH, Fitzpatrick D. A systematic map of direction preference in primary visual cortex. Nature. 1996;379:725–728. doi: 10.1038/379725a0. [DOI] [PubMed] [Google Scholar]
- 13.Shmuel A, Grinvald A. Functional organization for direction of motion and its relationship to orientation maps in cat area 18. J Neurosci. 1996;16:6945–6964. doi: 10.1523/JNEUROSCI.16-21-06945.1996. [DOI] [PMC free article] [PubMed] [Google Scholar]
- 14.Ohki K, Chung S, Ch’ng YH, Kara P, Reid RC. Functional imaging with cellular resolution reveals precise micro-architecture in visual cortex. Nature. 2005;433:597–603. doi: 10.1038/nature03274. [DOI] [PubMed] [Google Scholar]
- 15.Tootell RB, Mendola JD, Hadjikhani NK, Ledden PJ, Liu AK, Reppas JB, Sereno MI, Dale AM. Functional analysis of V3A and related areas in human visual cortex. J Neurosci. 1997;17:7060–7078. doi: 10.1523/JNEUROSCI.17-18-07060.1997. [DOI] [PMC free article] [PubMed] [Google Scholar]
- 16.Braddick OJ, O’Brien JM, Wattam-Bell J, Atkinson J, Turner R. Form and motion coherence activate independent, but not dorsal/ventral segregated, networks in the human brain. Curr Biol. 2000;10:731–734. doi: 10.1016/s0960-9822(00)00540-6. [DOI] [PubMed] [Google Scholar]
- 17.Whitney D, Goltz HC, Thomas CG, Gati JS, Menon RS, Goodale MA. Flexible retinotopy: motion-dependent position coding in the visual cortex. Science. 2003;302:878–881. doi: 10.1126/science.1087839. [DOI] [PMC free article] [PubMed] [Google Scholar]
- 18.Martinez-Trujillo JC, Treue S. Feature-based attention increases the selectivity of population responses in primate visual cortex. Curr Biol. 2004;14:744–751. doi: 10.1016/j.cub.2004.04.028. [DOI] [PubMed] [Google Scholar]
- 19.Desimone R. Visual attention mediated by biased competition in extrastriate visual cortex. Philos Trans R Soc Lond B Biol Sci. 1998;353:1245–1255. doi: 10.1098/rstb.1998.0280. [DOI] [PMC free article] [PubMed] [Google Scholar]
- 20.Treue S, Maunsell JH. Attentional modulation of visual motion processing in cortical areas MT and MST. Nature. 1996;382:539–541. doi: 10.1038/382539a0. [DOI] [PubMed] [Google Scholar]
- 21.Treue S, Martinez Trujillo JC. Feature-based attention influences motion processing gain in macaque visual cortex. Nature. 1999;399:575–579. doi: 10.1038/21176. [DOI] [PubMed] [Google Scholar]
- 22.O’Craven KM, Rosen BR, Kwong KK, Treisman A, Savoy RL. Voluntary attention modulates fMRI activity in human MT-MST. Neuron. 1997;18:591–598. doi: 10.1016/s0896-6273(00)80300-1. [DOI] [PubMed] [Google Scholar]
- 23.Saenz M, Buracas GT, Boynton GM. Global effects of feature-based attention in human visual cortex. Nat Neurosci. 2002;5:631–632. doi: 10.1038/nn876. [DOI] [PubMed] [Google Scholar]
- 24.Pascual-Leone A, Walsh V. Fast backprojections from the motion to the primary visual area necessary for visual awareness. Science. 2001;292:510–512. doi: 10.1126/science.1057099. [DOI] [PubMed] [Google Scholar]
- 25.Tong F. Primary visual cortex and visual awareness. Nat Rev Neurosci. 2003;4:219–229. doi: 10.1038/nrn1055. [DOI] [PubMed] [Google Scholar]
- 26.Albright TD. Direction and orientation selectivity of neurons in visual area MT of the macaque. J Neurophysiol. 1984;52:1106–1130. doi: 10.1152/jn.1984.52.6.1106. [DOI] [PubMed] [Google Scholar]
- 27.Malonek D, Tootell RB, Grinvald A. Optical imaging reveals the functional architecture of neurons processing shape and motion in owl monkey area MT. Proc Biol Sci. 1994;258:109–119. doi: 10.1098/rspb.1994.0150. [DOI] [PubMed] [Google Scholar]
- 28.Tolias AS, Smirnakis SM, Augath MA, Trinath T, Logothetis NK. Motion processing in the macaque: revisited with functional magnetic resonance imaging. J Neurosci. 2001;21:8594–8601. doi: 10.1523/JNEUROSCI.21-21-08594.2001. [DOI] [PMC free article] [PubMed] [Google Scholar]
- 29.Tootell RB, Reppas JB, Dale AM, Look RB, Sereno MI, Malach R, Brady TJ, Rosen BR. Visual motion aftereffect in human cortical area MT revealed by functional magnetic resonance imaging. Nature. 1995;375:139–141. doi: 10.1038/375139a0. [DOI] [PubMed] [Google Scholar]
- 30.Nakayama K. Biological image motion processing: a review. Vision Res. 1985;25:625–660. doi: 10.1016/0042-6989(85)90171-3. [DOI] [PubMed] [Google Scholar]
- 31.Rees G, Kreiman G, Koch C. Neural correlates of consciousness in humans. Nat Rev Neurosci. 2002;3:261–270. doi: 10.1038/nrn783. [DOI] [PubMed] [Google Scholar]
- 32.Haynes JD, Rees G. Predicting the orientation of invisible stimuli from activity in human primary visual cortex. Nat Neurosci. 2005;8:686–691. doi: 10.1038/nn1445. [DOI] [PubMed] [Google Scholar]
- 33.Watson AB, Pelli DG. QUEST: a Bayesian adaptive psychometric method. Percept Psychophys. 1983;33:113–120. doi: 10.3758/bf03202828. [DOI] [PubMed] [Google Scholar]
- 34.Engel SA, Glover GH, Wandell BA. Retinotopic organization in human visual cortex and the spatial precision of functional MRI. Cereb Cortex. 1997;7:181–192. doi: 10.1093/cercor/7.2.181. [DOI] [PubMed] [Google Scholar]
- 35.Sereno MI, Dale AM, Reppas JB, Kwong KK, Belliveau JW, Brady TJ, Rosen BR, Tootell RB. Borders of multiple visual areas in humans revealed by functional magnetic resonance imaging. Science. 1995;268:889–893. doi: 10.1126/science.7754376. [DOI] [PubMed] [Google Scholar]
- 36.Woods RP, Grafton ST, Holmes CJ, Cherry SR, Mazziotta JC. Automated image registration: I. General methods and intrasubject, intramodality validation. J Comput Assist Tomogr. 1998;22:139–152. doi: 10.1097/00004728-199801000-00027. [DOI] [PubMed] [Google Scholar]
- 37.Vapnik VN. Statistical Learning Theory. New York, NY: John Wiley & Sons, Inc; 1998. [Google Scholar]
- 38.Carlson TA, Schrater P, He S. Patterns of activity in the categorical representations of objects. J Cogn Neurosci. 2003;15:704–717. doi: 10.1162/089892903322307429. [DOI] [PubMed] [Google Scholar]


