Abstract
We present here a brief review of direct force measurements between hydrophobic surfaces in aqueous solutions. For almost 70 years, researchers have attempted to understand the hydrophobic effect (the low solubility of hydrophobic solutes in water) and the hydrophobic interaction or force (the unusually strong attraction of hydrophobic surfaces and groups in water). After many years of research into how hydrophobic interactions affect the thermodynamic properties of processes such as micelle formation (self-assembly) and protein folding, the results of direct force measurements between macroscopic surfaces began to appear in the 1980s. Reported ranges of the attraction between variously prepared hydrophobic surfaces in water grew from the initially reported value of 80–100 Å to values as large as 3,000 Å. Recent improved surface preparation techniques and the combination of surface force apparatus measurements with atomic force microscopy imaging have made it possible to explain the long-range part of this interaction (at separations >200 Å) that is observed between certain surfaces. We tentatively conclude that only the short-range part of the attraction (<100 Å) represents the true hydrophobic interaction, although a quantitative explanation for this interaction will require additional research. Although our force-measuring technique did not allow collection of reliable data at separations <10 Å, it is clear that some stronger force must act in this regime if the measured interaction energy curve is to extrapolate to the measured adhesion energy as the surface separation approaches zero (i.e., as the surfaces come into molecular contact).
Keywords: hydrophobic effect, surface forces, patchy bilayers, interfacial slip, capillary bridges
As early as 1937 (1), researchers recognized the complexity of the problem of the low affinity of nonpolar groups for water and postulated an entropic origin for the effect because of its strong temperature dependence. In a landmark paper by Frank and Evans (2), a first attempt at providing a detailed theory of the hydrophobic effect was made. Frank and Evans described water molecules rearranging into a microscopic “iceberg” around a nonpolar molecule and discussed the entropic ramifications of this “freezing.” Several years later, Klotz (3) developed a general theory of the bond between two nonpolar molecules, and in 1959, the term “hydrophobic bond” was coined by Kauzmann (4) to describe the tendency toward adhesion between the nonpolar groups of proteins in aqueous solution. Kauzmann suggested that this bond was probably among the most important factors in the stabilization of certain folded configurations in native proteins.
Although the term hydrophobic bond is still used today, as early as 1968, several researchers began to take issue with this description of the hydrophobic interaction (5). Use of the word “bond” was considered inappropriate, given that the attraction between nonpolar groups lacked any of the characteristic features that distinguish chemical bonds from van der Waals forces. Despite arguments over the semantics of what terminology to employ, through the end of the 1960s there existed the idea, based primarily on the work of Tanford, Kauzmann, Nemethy, and Scheraga (4, –10), that there was a hydrophobic bond, viewed as the spontaneous tendency of nonpolar groups to adhere in water to minimize their contact with water molecules. One of the more perplexing aspects of the hydrophobic effect when the problem was first considered was the fact that most scientists were accustomed to thinking of the interactions and forces between particles as being due to the properties of the particles themselves rather than the suspending solvent medium (11). In 1954, Kirkwood (12) noted that the role of water molecules in the average attraction between nonpolar groups might be larger than that of the direct van der Waals interaction between these groups (12).
Things began to change in the early 1970s as computational techniques, such as those of Pratt and Chandler (13), began to progress, and the simple yet appealing model of a hydrophobic bond could no longer be reconciled with what was known about the physical properties of dilute solutions of hydrophobic molecules in water. For example, experiments during this time showed that the free energy is proportional to the hydrophobic surface area (14, 15). Computational methods combined with the application of protein engineering to directly study the role of hydrophobic amino acid residues in protein folding continue to produce evidence that is contradictory to the traditional interpretation of the hydrophobic effect (16). More recently, as theories of inhomogeneous fluids have developed, it has become clear that it is not necessary to invoke any special structure for water to predict that “strange things will happen at interfaces” (17).
Manifestations of the Hydrophobic Effect
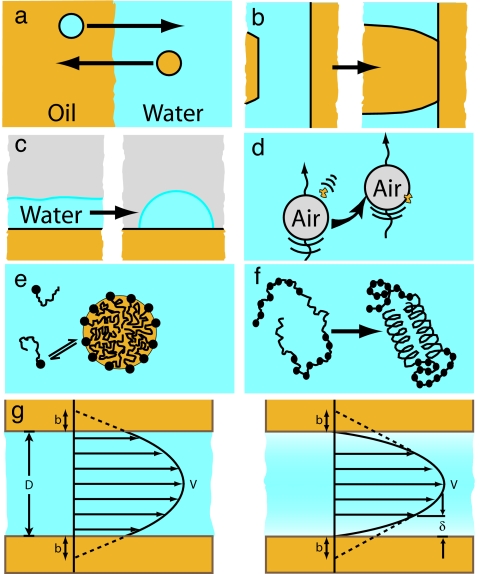
Fig. 1 shows a number of systems that are largely mediated by the hydrophobic effect or the hydrophobic interaction. Several studies concerning the low solubility of nonpolar solutes in water (and vice versa) have indicated that the strength of the interaction is much larger than would be expected from the classic “Lifshitz theory” of van der Waals forces. More recent theories attempting to explain the low solubility of a simple nonpolar solute in water (Fig. 1a) make significant use of the molecular structure of water (13, –20). However, the precise shape and chemical structure of the solute molecules are also important, because the water structure can be highly sensitive to local solute structure (21–23).
Fig. 1.
Manifestations of the hydrophobic interaction and the hydrophobic effect. These include the low solubility of hydrophobic solutes (e.g., oil) in water and vice versa (a), the strong adhesion between solid hydrophobic surfaces (b), the dewetting phenomena leading to a large contact angle (c), hydrophobic contaminants or pollution adsorbing at the air–water interface (d), micelle formation (e), protein folding (f), and flow through hydrophobic surfaces leading to an observed slip length at the solid–liquid interface (g). The slip length, b, is approximately related to the thickness of the depletion layer, δ, through b ≈ 50δ (122).
The hydrophobic interaction can be qualitatively understood as an interaction that causes hydrophobic moieties to aggregate or cluster. This interaction manifests itself in many commonly observed ways. Aside from the low solubility of nonpolar solutes in water, the hydrophobic interaction is responsible for the significant work of adhesion between solid hydrophobic surfaces (Fig. 1b) and is the cause of the rapid coalescence or flocculation that is commonly observed in colloidal systems of hydrophobic liquid droplets or solid particulates. The hydrophobic effect can also be seen in thin water films dewetting hydrophobic substrates, resulting in a droplet with a large contact angle (Fig. 1c) (24–27) and in the fact that the bare air–water interface (air being “hydrophobic”) readily adsorbs hydrophobic particles and contaminants (surfactants, polymers, and proteins) that are present in the atmosphere or dispersed in water (Fig. 1d) (28).
A number of self-assembly processes are driven by the hydrophobic interaction, including micelle formation (Fig. 1e), vesicles and bilayers (29, 30), and protein folding (Fig. 1f) (4, 31). The rate of protein folding remains a very active research area and has become one of the primary motivations for developing an understanding of the hydrophobic interaction at molecular-length scales, as has been the case since the pioneering work of Kauzmann (4) and Tanford (32).
Fig. 1g is a schematic of water flowing through a hydrophobic channel. For hydrophilic surfaces or walls, the classical no-slip boundary condition is observed (slip length b = 0) down to contact (D = 0), but for hydrophobic walls, the slip length b has been reported to be nonzero. The currently available literature reports a wide range of measured slip lengths, from <20 nm to >1 μm, obtained through a variety of different methods, including surface force apparatus (SFA) and microchannel flow measurements (33–48). The great variability in results suggests that the origin of this slip length is still not well understood. Complications arise when comparing experimental results that include the “degree of hydrophobicity” of the surfaces (as defined by contact angle measurements), the effect of surface roughness and shear rate, and the possible existence of a layer of gas or density-depleted water of thickness δ at the hydrophobic solid–liquid interface (Fig. 1g), which also affects the forces between surfaces (discussed below). Most experiments find a slip length of a few tens of nanometers (43, 46, 47), which is slightly larger than predictions of numerical simulations (49).
Despite the considerable information gained from these studies, they do not provide the force law (force-distance or energy-distance profile) of the hydrophobic interaction. One of the most powerful tools for studying hydrophobicity is the direct measurement of the force between two hydrophobic surfaces or molecular groups. So far, such measurements have focused on interactions between macroscopic or microscopic (but not nanoscopic) surfaces, and it should be noted that there has been no indication that the interactions between macroscopic hydrophobic surfaces and those between small hydrophobic solutes or molecular groups should be quantitatively the same (i.e., that the force law is “pairwise additive”). This lack of pairwise additivity again reflects the fact that there are no discrete hydrophobic “bonds.”
Direct Measurement of Forces Between Hydrophobic Surfaces
Despite a great deal of research over the last 20 years, a deep and quantitative understanding of the origin and nature of the interaction between hydrophobic surfaces across water and aqueous solutions remains elusive. The origin of the strong and often long-range attraction between hydrophobic surfaces has been the focus of a substantial body of work, yet there is no single theory that can currently encompass all of the experimental results, which are themselves often contradictory. In the years after the initial experiments by Israelachvili and Pashley in 1982 (50, 51), it has become increasingly clear that the hydrophobic force is more complex than initially thought. Complicating any attempt to understand the hydrophobic interaction is the fact that different experimental force-measuring techniques and different methods of hydrophobization result in different measured attractions.
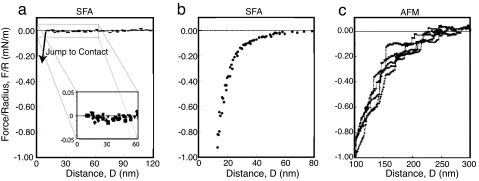
Fig. 2 shows representative force curves obtained by using three different hydrophobization methods (and measured with three different techniques). As discussed in the review by Christenson and Claesson (52), the vast majority of forces measured between hydrophobic surfaces fall into one of the three categories shown. Fig. 2a shows a typical interaction between smooth, stable, “chemisorbed” hydrophobic surfaces (53–56). For this system, no attraction is measured on approach until the surfaces “jump” into contact from a distance DJ of <170 Å. Fig. 2b shows a typical force curve for “physisorbed” surfactant surfaces, either Langmuir–Blodgett (LB)-deposited monolayers or self-assembled monolayers (54, 57–65). This system characteristically exhibits an attractive force that is long-range and biexponential, with the long-range part having a different decay length than the short-range part. The third type of system, shown in Fig. 2c, results in the case of many chemically silanated surfaces of high contact angle. Such surfaces exhibit a force curve with abrupt steps that are generally interpreted as being due to preexisting bridging nanobubbles, which are also imaged by atomic force microscopy (AFM) (66–77).
Fig. 2.
Representative force curves measured between surfaces hydrophobized by three different techniques. (a) Short-range attraction typical between stable surfaces. [Reproduced with permission from ref. 54 (Copyright 1995, American Chemical Society).] (b) Long-range, biexponential attraction between physisorbed or self-assembled surfactant surfaces. (c) Step-like force curves indicative of bridging nanobubbles. [Reproduced with permission from ref. 73 (Copyright 1994, American Chemical Society).]
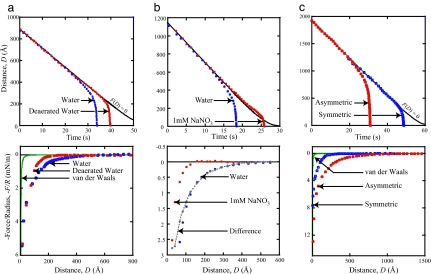
Narrowing the field of potential models to explain the attraction between hydrophobic surfaces is complicated by difficulties in determining the relevant parameters. Seemingly contradictory data have been published concerning the effects of electrolyte ions (59, 62, 73, 78–81) and temperature (82, 83). Removal of dissolved gas, however, has been consistently shown to decrease the range of the attraction as well as its magnitude, but only at long range (81, –87). Removal of dissolved gas has also been shown to increase the stability of colloids (88) and emulsions (89–92) against aggregation. Extremely long-range attractions measured between a hydrophobic surface and a hydrophilic surface (93–97) have also raised questions as to the origin of the effect. Fig. 3 shows the effects of deaeration (removal of dissolved gas) (Fig. 3a), increasing the monovalent electrolyte concentration (ionic strength) (Fig. 3b), and asymmetry (hydrophobic–hydrophilic system) (Fig. 3c), where in each case the “hydrophobic surface” was a physisorbed monolayer of the double-chained surfactant dioctadecyldimethylammonium bromide on mica, in which the DODA+ (dioctadecyldimethylammonium) moiety adsorbs to the negatively charged mica surface. All data were obtained by using the “dynamic SFA” method as described in refs. 98 and 99, in which the separation between the surfaces is recorded in real time as the surfaces are brought together at a constant driving velocity. These data can then be used to calculate the force F(D) acting between the surfaces at a separation D. In all results presented here, a no-slip boundary condition has been assumed. Were there slip occurring at the surface (b > 0), assumption of a no-slip boundary condition (b = 0) would result in a calculated force that is more attractive at small separations.
Fig. 3.
Impact of deaeration (a), salt (b), and asymmetry (hydrophobic–hydrophilic interactions) (c) on the interaction between DODA-coated mica surfaces. (Upper) Distance vs. time curves. (Lower) Force vs. distance curves for the same system.
As a reference, each panel of Fig. 3 shows the force measured between two DODA-coated surfaces in pure (nondeaerated) water, represented by blue circles. In this system, the surfaces begin to accelerate away from the F(D) = 0 (no molecular force) curve at a surface separation of D ≈ 450 Å, indicating the onset of an attractive force. At a separation of just >200 Å, a considerably stronger force takes over, and the surfaces begin their jump into contact. In Fig. 3a, we see the effects of deaeration on this system. As previously reported for this system (87), removal of dissolved gas eliminates only the long-range part of the force. In the distance vs. time data, the effect of deaeration can be seen by the deaerated curve deviating from the F(D) = 0 curve at D ≈ 250 Å rather than at twice this distance, and in the force vs. distance curve, the attraction appears much closer in for the deaerated case. Significantly, however, the two force curves follow an almost identical path in the final 100 Å before contact. This result is consistent with what is seen throughout the literature: Removal of dissolved gas affects only the long-range part of the attractive force, leaving the short-range force unchanged. It has been suggested that the effect of deaeration is a result of the associated increase in the solution pH rather than a direct result of the absence of dissolved gas (100). This increase in pH increases the double-layer repulsion and thus results in an apparent decrease in the (hydrophobic) attraction.
The almost identical forces measured in aerated and deaerated water at surface separations <100 Å extend all of the way to contact (D = 0). Thus, the measured adhesion forces Fad needed to separate the surfaces from adhesive contact are the same in both cases, with values of Fad/R ≈ −600 mN/m. These values correspond to an interfacial energy (tension) given by the Johnson–Kendall–Roberts (JKR) equation (101),
which is slightly higher than the expected thermodynamic value for the interfacial tension of a hydrocarbon–water interface of ≈50 mJ/m2.
One example of the result of introducing electrolytes into the system is shown in Fig. 3b. Published results on electrolyte effects vary considerably. Although several researchers have reported a reduced range and/or magnitude of the attraction between hydrophobic surfaces in electrolyte solutions (59, 62, 79, 96, 102), others have reported no discernable effect (54, 55, 81), and still others have reported an increase in the measured attraction and adhesion (103, 104). These contradictory results provide further examples of how surface hydrophobization techniques play an important role. For DODA surfaces in 1 mM NaNO3, our SFA measurements (Fig. 3b) show that the surfaces experience a slight repulsion at just >250 Å before beginning their jump into contact from a separation of just <150 Å. It is interesting to note that when the normalized force curve, F(D)/R, in electrolyte solution is subtracted from that in pure water, the resulting curve is purely exponential, with a decay length of λ = 92 Å, the expected debye length for 1 mM NaNO3. This agreement indicates that the long-range attraction is due to double-layer forces.
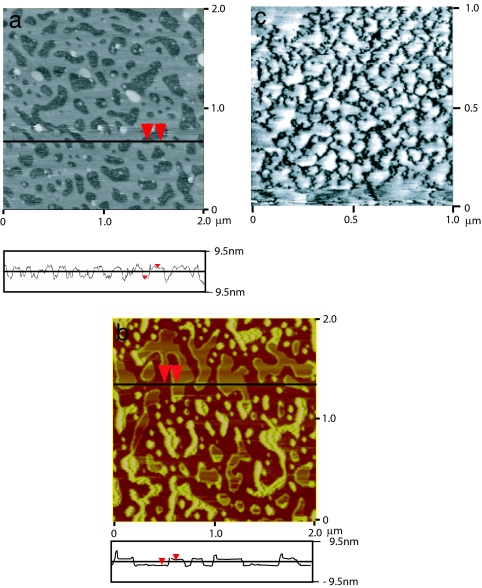
The interaction between a hydrophobic (surfactant-coated mica) surface and hydrophilic (bare mica) surface is shown in Fig. 3c. Again, consistent with previously published reports on similar “asymmetric” systems (93–97), upon bringing two surfaces together, the attraction sets in from a much larger distance (D ≈ 1,250 Å) than in the symmetric case (D ≈ 450 Å) and is then also followed by a larger “jump-in” distance and a stronger force closer in. It was always difficult to find a satisfactory explanation for the stronger attraction between a hydrophobic and a hydrophilic surface than between two hydrophobic surfaces, but recent studies incorporating AFM imaging have been able to explain this effect as well as other previously mystifying observations. Fig. 4 shows AFM images of a physisorbed (LB-deposited) DODA layer on mica (94) (Fig. 4a), a cetyltrimethylammonium bromide layer self-assembled on mica (95) (Fig. 4b), and a hydrophobic glass surface believed to be covered in a thin layer of bubbles (71) (Fig. 4c). Although the surfaces shown in Fig. 4 a and b were both smooth hydrophobic monolayers in air, patchy bilayers emerged soon after the surfaces were immersed in water. Because of the negative charge of bare mica and the positive charge of the surfactant head groups of DODA+ and CTA+ (cetyltrimethylammonium), the resulting forces in both the LB and the self-assembled monolayer cases are long-range attractions due to electrostatics, not hydrophobicity, arising from the attraction between the positively charged bilayer patches and negatively charged mica surfaces or holes on the opposing surface (94, 95). Fig. 4c shows an AFM image of submicroscopic, reportedly preexisting, vapor nanobubbles on a hydrophobic surface. As each bubble bridged the two hydrophobic surfaces, an attractive capillary force would be generated. Such a mechanism would produce very long-range, stepped force curves, such as those shown in Fig. 2c.
Fig. 4.
AFM images of hydrophobic surfaces prepared by different techniques imaged in various aqueous solutions. Shown are hydrophobic surfaces under water prepared by LB deposition of DODA on mica (a) and self-assembly of cetyltrimethylammonium bromide on mica (b). [b reproduced with permission from ref. 95 (Copyright 2005, American Chemical Society).] (c) Nanobubbles on a hydrophobic glass substrate. [Reproduced with permission from ref. 71 (Copyright 2002, American Chemical Society).]
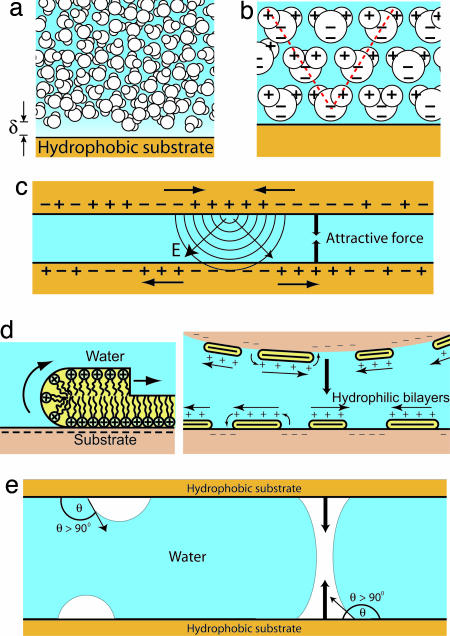
Countless papers have been published in the last 20 years concerning possible explanations for the hydrophobic interaction. Proposed models have invoked entropic effects due to molecular rearrangement of water near hydrophobic surfaces (13, 51, 57, 105), electrostatic effects (106, 107), correlated charge fluctuations (108, 109) or correlated dipole interactions (96), the bridging of submicroscopic bubbles (66, 70–73, 77, 110, 111), and cavitation due to the metastability of the intervening fluid (60, 61, 85, 91, 112–117). Schematics of some of these models are shown in Fig. 5.
Fig. 5.
Possible mechanisms for long-range attraction between hydrophobic surfaces. (a) Although a depletion layer exists next to a hydrophobic surface, the range of thickness of this layer is typically only one to two water molecules, suggesting that only a short-range force should be operating. (b) The presence of a hydrophobic solute (or ion) also affects the local orientation of the surrounding water molecules, an effect that can propagate many molecular layers into the bulk. (c and d) Local charge fluctuations at one surface can influence the charge density of the opposing surface, causing a long-range attractive electrostatic interaction, such as that seen with patchy bilayers. (e) When present on hydrophobic surfaces, nanobubbles can coalescence, leading to an attractive Laplace pressure at large range.
No existing model seems capable of explaining the hydrophobic interaction over the entire range of observed distances, solution conditions, methods of hydrophobization, surface roughness and fluidity, and “hydrophobicity” of specific chemical groups. Several researchers have suggested the possibility that the long-range attraction observed in so many experiments is actually a combination of a long-range force due to a variety of system-dependent, nonhydrophobic (or only indirectly hydrophobic-dependent) effects and a short-range, truly hydrophobic interaction (63, 118, 119). With the help of AFM imaging (Fig. 4), the origin of the long-range (D > 200 Å) attraction between surfaces hydrophobized by various methods has recently been elucidated. As shown in Fig. 5d, molecular rearrangement into patchy bilayers (bilayer islands or continuous bilayers with holes) now appears to be responsible for the long-range attraction in the case of many LB-deposited and self-assembled surfaces (94, 95). Already in 1997, Christenson and Yaminsky (119) noted an apparent correlation between contact angle hysteresis and the existence of a long-range attraction between hydrophobic surfaces, an observation that was consistent with a mechanism for this force that involves significant molecular rearrangements when an initially hydrophobic surface comes into contact with water. Another instance in which AFM gave new insight into the origin of the long-range force measured between hydrophobic surfaces is in the idea that nanobubbles may be responsible for the stepped attraction between many highly hydrophobic (such as silanated) surfaces. Formation of such bubbles on hydrophobic surfaces would require surface defects at which the bubbles could nucleate. Ederth and Liedberg (118) concluded that the range of the “true” hydrophobic interaction is <200 Å after observing a long-range interaction that was apparently the result of bridging nanobubbles and not directly related to the hydrophobicity of the surfaces at all. The only force present between all types of hydrophobic surfaces remains the short-range (D < 200 Å) attraction.
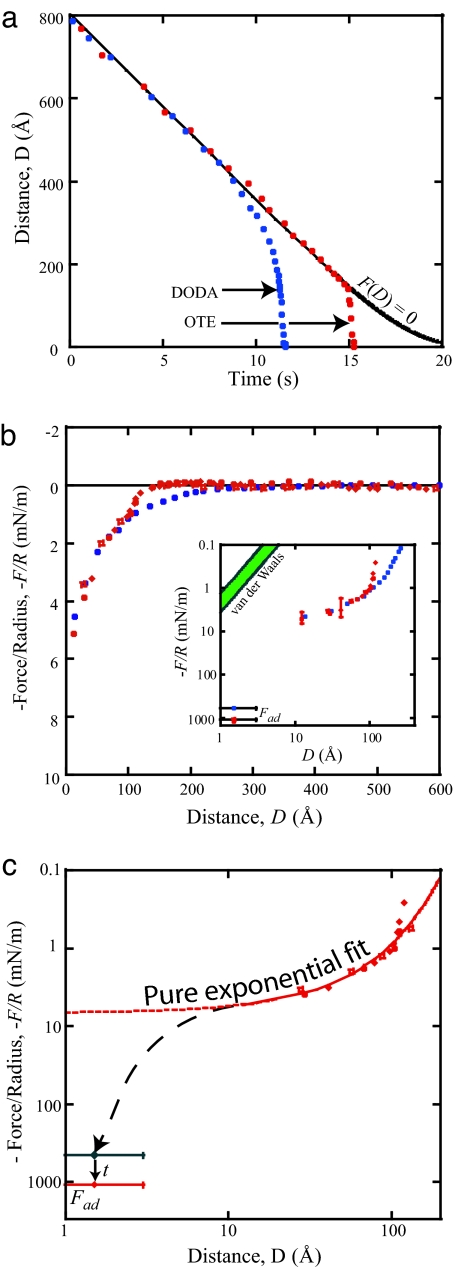
To investigate the forces acting at short range without the possibility of complications that can give rise to long-range effects such as those discussed above, hydrophobic surfaces are required that are smooth, continuous, free from defects at which nanobubbles might nucleate, and stable in water. One such system had previously been described by Wood and Sharma (54, 55, 120), using chemisorbed octadecyltriethoxysilane (OTE) monolayers on activated mica, the results of which are shown in Fig. 2a. Using the jump-in method, the researchers were able to determine that the jump-in occurred at some distance <170 Å but were unable to determine the exact value of DJ or measure the forces during the jump (below DJ) because of the experimental limitations of this method. Using a similar surface preparation§ and the dynamic SFA technique, we have measured the forces and adhesion between OTE surfaces that satisfy all of the above criteria, including stability as evidenced through a small contact angle hysteresis (θa = 110°, θr = 93°).
The measured forces (Fig. 6) were reproducible from the first run through all subsequent runs, regardless of the amount of time between runs. We find (compare Fig. 6b) that there is little or no attraction for D > 150 Å and that only at distances <100 Å does the measured force merge with all of the previously measured forces. Interestingly, the average measured adhesion, Fad/R = 1,100 ± 50 mJ/m2, is considerably higher than the value of ≈500 mN/m expected from the Johnson–Kendall–Roberts (JKR) theory (Eq. 1) for hydrophobic surfaces in water, for which γi = 45–54 mJ/m2. However, it was noted from the fringes of equal chromatic order that the contact diameter grew over time, typically increasing by one-third of the initial contact value during approximately the first 60 s after contact. According to the JKR theory, this increase in area implies that γi increased by a factor of ≈2.4 after initial contact was made and that the initial value was ≈465 mJ/m2, corresponding to γi = 49 ± 3 mJ/m2, which is within error of the expected thermodynamic value. Fig. 6c also shows an exponential fit of the measured attraction in the last 125 Å before contact. The fit is good down to D ≈ 10 Å, but it is clear that the exponential attraction does not extend down to contact: The measured (and calculated) adhesions are significantly higher than predicted by any extrapolated fit of the exponential force, as shown by the dashed lines in Fig. 6c.
Fig. 6.
Representative data for forces between OTE surfaces deposited on activated mica. (a and b) Distance vs. time (a) and force vs. distance (b) data for the OTE system compared with that in the DODA system. (b Inset) The force curve on a log-log scale. (c) Force curve fit by an exponential function plotted along with measured and calculated adhesion values.
The data points of the force curves of Fig. 6 are shown down to a distance of ≈10 Å, with the jump-in distance at DJ = 130 Å. As noted above, analysis of the force curves for the chemisorbed OTE surfaces compared with those for the physisorbed DODA surfaces under the same conditions shows that, in the last 100 Å, the attractions are nearly identical. This finding provides striking evidence for the idea that it is this short-range regime that represents the true hydrophobic interaction. The attraction in this range is seen to be exponential down to separations of 10 Å, below which there is an apparent onset of a considerably stronger attractive force.
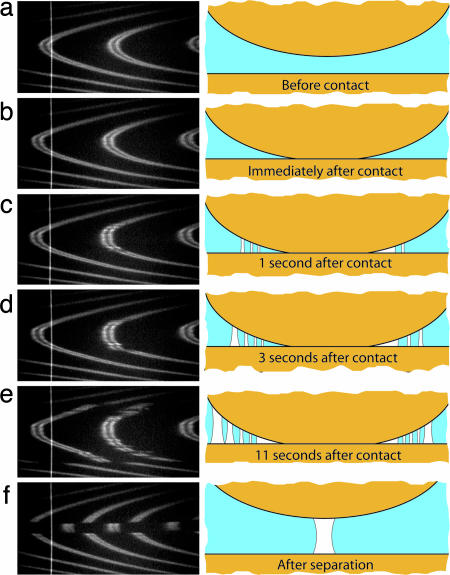
Spontaneous cavitation of vapor and dissolved gas was also observed in this system, starting immediately after contact and increasing rapidly with time, as shown along with the corresponding schematics in Fig. 7. Such “capillary condensation” of vapor is expected for situations where the receding contact angle is >90°. Upon separation, the surfaces are seen to spontaneously jump apart from contact to a large distance, with the vapor cavities collapsing into one large vapor bridge (Fig. 7f). With the surfaces separated by several micrometers, this cavity disappear within a few seconds, and no refractive index discontinuities in the fringes of equal chromatic order, indicative of lingering bubbles, are observed on subsequent approaches. Spontaneous cavitation upon contact was previously reported in the case of fluorocarbon surfaces (60) and, later, between OTE surfaces (54) and is a strong indication of the highly hydrophobic nature of the surfaces. AFM imaging of these OTE surfaces in air showed a smooth layer over large areas (rms roughness ≈ 5 Å), but imaging under water was complicated by the large contact angles, which resulted, as would be expected (121), in the formation of vapor cavities between the highly hydrophobic surface and the moderately hydrophobic AFM tip. The newly formed bubbles then attached to the AFM tip, making imaging impossible.
Fig. 7.
Fringes of equal chromatic order images and accompanying schematics of spontaneous cavitation when OTE surfaces jump into contact. (a–e) The cavitation begins after contact and increases with time. (f) The single larger cavity that remains after separation.
Conclusions
In the work presented here, we have summarized previous work on the hydrophobic effect and hydrophobic interaction, with a focus on direct force measurements between macroscopic hydrophobic surfaces. Through the combination of AFM imaging with direct force measurements (using either SFA or AFM), insight has been gained in recent years concerning the origin of the measured long-range attraction between hydrophobic surfaces. In the case of physisorbed surfactant surfaces, this combination of techniques has shown that the long-range attraction is due to molecular rearrangements resulting in an electrostatic interaction between (hydrophilic) surfaces with patches of both positive and negative charge. In the case of some chemically silanated surfaces, the long-range step-like attraction may be due to submicroscopic nanobubbles. In both cases, the observed long-range attraction is only indirectly related to the hydrophobicity of the surfaces. Smooth, stable OTE surfaces, on the other hand, show no such long-range attraction at separations >150 Å. Throughout the literature, the attraction at short range is the only force observed between all types of hydrophobic surfaces, and we report here that the forces in both the OTE system and the physisorbed DODA system are nearly identical in the final 100 Å. This force is approximately exponential over a limited regime down to ≈10 Å. Although our force-measuring technique did not allow collection of reliable data at separations <10 Å, it is clear that some stronger force must act in this regime if the force as D approaches zero is to extrapolate to the adhesion force.
There has been much discussion of two regimes in measurements of the force between hydrophobic surfaces: a long-range attraction at separations >200 Å that is related more to surface preparation techniques than to the hydrophobicity of the surfaces and a short-range attraction at separations <200 Å that is thought to contain more information about the true hydrophobic interaction. The data presented here indicate that there may in fact be another regime to consider, that <10 Å, in which some force stronger than the exponentially attractive force at larger separations acts.
The relation between the hydrophobic forces acting between hydrophobic solute molecules and between macroscopic hydrophobic surfaces has been a topic of considerable interest for decades. Although one would expect these two interactions to share a common origin, thus far there has been no simple way to quantitatively relate these forces (for example, in terms of a pairwise additive interaction potential).
Acknowledgments
This work was supported by National Science Foundation Grant DMR05-20415 and National Aeronautics and Space Administration Grant NAG3-2115.
Abbreviations
- AFM
atomic force microscopy
- SFA
surface force apparatus
- LB
Langmuir–Blodgett
- DODA
dioctadecyldimethylammonium
- OTE
octadecyltriethoxysilane.
Footnotes
The authors declare no conflict of interest.
See accompanying Profile on page 15736.
§OTE monolayers were prepared by LB deposition. All glassware that came into contact with the OTE was cleaned by using Nochromix reagent (Fisher Scientific, Pittsburgh, PA). Mica surfaces were treated with an argon water plasma [10 min at 450 mtorr (1 torr = 133 Pa)] immediately before deposition. OTE was passed through a 0.2-μm polytetrafluoroethylene filter (Fisher Scientific) into a 95:5 chloroform:methanol mixture to obtain a 2-mg/ml solution to spread for deposition. This solution was spread onto a subphase of Milli-Q water (Millipore, Billerica, MA), which was first brought to pH 2 by the addition of nitric acid. Deposition was carried out at a pressure of 30 mN/m, after which the samples were dried in a clean air stream for 15 min. The samples were then baked in a vacuum oven at 100°C for 2 h before use. A monolayer was simultaneously deposited on a test piece of mica during each deposition, and tapping-mode AFM was carried out on these test pieces in air to determine the actual roughness of the surfaces used in each experiment.
References
- 1.Butler JAV. Trans Faraday Soc. 1937;33:229–236. [Google Scholar]
- 2.Frank HS, Evans MW. J Chem Phys. 1945;13:507–532. [Google Scholar]
- 3.Klotz IM. Science. 1958;128:815–822. doi: 10.1126/science.128.3328.815. [DOI] [PubMed] [Google Scholar]
- 4.Kauzmann W. Adv Protein Chem. 1959;14:1–63. doi: 10.1016/s0065-3233(08)60608-7. [DOI] [PubMed] [Google Scholar]
- 5.Hildebrand JH, Nemethy G, Scheraga HA, Kauzmann W. J Phys Chem. 1968;72:1841–1842. [Google Scholar]
- 6.Nemethy G, Scheraga HA. J Phys Chem. 1962;66:1773–1789. [Google Scholar]
- 7.Nemethy G, Scheraga HA. J Chem Phys. 1962;36:3382–3400. [Google Scholar]
- 8.Nemethy G, Scheraga HA. J Chem Phys. 1962;36:3401–3417. [Google Scholar]
- 9.Tanford C. J Am Chem Soc. 1962;84:4240–4247. [Google Scholar]
- 10.Tanford C. The Hydrophobic Effect: Formation of Micelles and Biological Membranes. New York: Wiley Interscience; 1980. [Google Scholar]
- 11.Ben-Naim A. Hydrophobic Interactions. New York: Plenum; 1980. [Google Scholar]
- 12.Kirkwood JG. In: A Symposium on the Mechanism of Enzyme Action. McElroy WD, Glass B, editors. Baltimore: Johns Hopkins Univ Press; 1954. [Google Scholar]
- 13.Pratt LR, Chandler D. J Chem Phys. 1977;67:3683–3704. [Google Scholar]
- 14.Hermann RB. J Phys Chem. 1972;76:2754. [Google Scholar]
- 15.Reynolds JA, Gilbert DB, Tanford C. Proc Natl Acad Sci USA. 1974;71:2925–2927. doi: 10.1073/pnas.71.8.2925. [DOI] [PMC free article] [PubMed] [Google Scholar]
- 16.Blokzijl W, Engberts J. Angew Chem Int Ed Engl. 1993;32:1545–1579. [Google Scholar]
- 17.Ball P. Nature. 2003;423:25–26. doi: 10.1038/423025a. [DOI] [PubMed] [Google Scholar]
- 18.Hummer G, Garde S, Garcia AE, Pohorille A, Pratt LR. Proc Natl Acad Sci USA. 1996;93:8951–8955. doi: 10.1073/pnas.93.17.8951. [DOI] [PMC free article] [PubMed] [Google Scholar]
- 19.Lazaridis T, Paulaitis ME. J Phys Chem. 1992;96:3847–3855. [Google Scholar]
- 20.Rahman A, Stilling F. J Am Chem Soc. 1973;95:7943–7948. [Google Scholar]
- 21.Chandler D. Nature. 2005;437:640–647. doi: 10.1038/nature04162. [DOI] [PubMed] [Google Scholar]
- 22.Cheng YK, Rossky PJ. Nature. 1998;392:696–699. doi: 10.1038/33653. [DOI] [PubMed] [Google Scholar]
- 23.Ashbaugh HS, Garde S, Hummer G, Kaler EW, Paulaitis ME. Biophys J. 1999;77:645–654. doi: 10.1016/S0006-3495(99)76920-1. [DOI] [PMC free article] [PubMed] [Google Scholar]
- 24.Lum K, Chandler D, Weeks JD. J Phys Chem B. 1999;103:4570–4577. [Google Scholar]
- 25.Wallqvist A, Berne BJ. J Phys Chem. 1995;99:2885–2892. [Google Scholar]
- 26.Lum K, Luzar A. Phys Rev E. 1997;56:R6283–R6286. [Google Scholar]
- 27.Lum K, Chandler D. Int J Thermophys. 1998;19:845–855. [Google Scholar]
- 28.Valsaraj K. Environ Toxicol Chem. 2004;23:2318–2323. doi: 10.1897/03-321. [DOI] [PubMed] [Google Scholar]
- 29.Hunter RJ. Foundations of Colloid Science. Vol 1. Oxford: Oxford Univ Press; 1987. [Google Scholar]
- 30.Israelachvili JN. Intermolecular and Surface Forces. New York: Academic; 1992. [Google Scholar]
- 31.Dill KA. BioChem. 1990;29:7133–7155. doi: 10.1021/bi00483a001. [DOI] [PubMed] [Google Scholar]
- 32.Tanford C. Protein Sci. 1997;6:1358–1366. doi: 10.1002/pro.5560060627. [DOI] [PMC free article] [PubMed] [Google Scholar]
- 33.Zhu Y, Granick S. Phys Rev Lett. 2001;87:096105. doi: 10.1103/PhysRevLett.87.096105. [DOI] [PubMed] [Google Scholar]
- 34.Zhu Y, Granick S. Phys Rev Lett. 2002;88:106102. doi: 10.1103/PhysRevLett.88.106102. [DOI] [PubMed] [Google Scholar]
- 35.Baudry J, Charlaix E, Tonck A, Mazuyer D. Langmuir. 2001;17:5232–5236. [Google Scholar]
- 36.Horn RG, Vinogradova OI, Mackay ME, Phan-Thein N. J Chem Phys. 2000;112:6424–6433. [Google Scholar]
- 37.Pit R, Hervet H, Leger L. Tribol Lett. 1999;7:147–152. [Google Scholar]
- 38.Tretheway DC, Meinhart CD. Phys Fluids. 2002;14:L9–L12. [Google Scholar]
- 39.Vinogradova OI. Int J Mineral Processing. 1999;56:31–60. [Google Scholar]
- 40.Churaev NV, Sobolev VD, Somov AN. J Colloid Interface Sci. 1984;97:574–581. [Google Scholar]
- 41.Ruckenstein E, Rajora P. J Colloid Interface Sci. 1983;96:488–491. [Google Scholar]
- 42.Craig VSJ, Neto C, Williams DRM. Phys Rev Lett. 2001;87:054504. doi: 10.1103/PhysRevLett.87.054504. [DOI] [PubMed] [Google Scholar]
- 43.Choi CH, Westin KJA, Breuer KS. Phys Fluids. 2003;15:2897–2902. [Google Scholar]
- 44.Pit R, Hervet H, Leger L. Phys Rev Lett. 2000;85:980–983. doi: 10.1103/PhysRevLett.85.980. [DOI] [PubMed] [Google Scholar]
- 45.Zhu YX, Granick S. Langmuir. 2002;18:10058–10063. [Google Scholar]
- 46.Joseph P, Tabeling P. Phys Rev E. 2005;71:035303. doi: 10.1103/PhysRevE.71.035303. [DOI] [PubMed] [Google Scholar]
- 47.Cottin-Bizonne C, Cross B, Steinberger A, Charlaix E. Phys Rev Lett. 2005;94:56102. doi: 10.1103/PhysRevLett.94.056102. [DOI] [PubMed] [Google Scholar]
- 48.Choi CH, Kim CJ. Phys Rev Lett. 2006;96:066001. doi: 10.1103/PhysRevLett.96.066001. [DOI] [PubMed] [Google Scholar]
- 49.Leung K, Luzar A, Bratko D. Phys Rev Lett. 2003;90:065502. doi: 10.1103/PhysRevLett.90.065502. [DOI] [PubMed] [Google Scholar]
- 50.Israelachvili JN, Pashley R. Nature. 1982;300:341–342. doi: 10.1038/300341a0. [DOI] [PubMed] [Google Scholar]
- 51.Israelachvili JN, Pashley RM. J Colloid Interface Sci. 1984;98:500–514. [Google Scholar]
- 52.Christenson HK, Claesson PM. Adv Colloid Interface Sci. 2001;91:391–436. [Google Scholar]
- 53.Parker JL, Claesson PM, Wang JH, Yasuda HK. Langmuir. 1994;10:2766–2773. [Google Scholar]
- 54.Wood J, Sharma R. Langmuir. 1995;11:4797–4802. [Google Scholar]
- 55.Wood J, Sharma R. J Adhes Sci Technol. 1995;9:1075–1085. [Google Scholar]
- 56.Raviv U, Giasson S, Frey J, Klein J. J Phys Condens Matter. 2002;14:9275–9283. [Google Scholar]
- 57.Claesson PM, Blom CE, Herder PC, Ninham BW. J Colloid Interface Sci. 1986;114:234–242. [Google Scholar]
- 58.Lin Q, Meyer EE, Tadmor M, Israelachvili JN, Kuhl T. Langmuir. 2005;21:251–255. doi: 10.1021/la048317q. [DOI] [PubMed] [Google Scholar]
- 59.Christenson HK, Fang JF, Ninham BW, Parker JL. J Phys Chem. 1990;94:8004–8006. [Google Scholar]
- 60.Christenson HK, Claesson PM. Science. 1988;239:390–392. doi: 10.1126/science.239.4838.390. [DOI] [PubMed] [Google Scholar]
- 61.Claesson PM, Christenson HK. J Phys Chem. 1988;92:1650–1655. [Google Scholar]
- 62.Christenson HK, Claesson PM, Parker JL. J Phys Chem. 1992;96:6725–6728. [Google Scholar]
- 63.Hato M. J Phys Chem. 1996;100:18530–18538. [Google Scholar]
- 64.Pertsin AJ, Grunze M. J Chem Phys. 2003;118:8004–8009. [Google Scholar]
- 65.Pertsin AJ, Hayashi T, Grunze M. J Phys Chem B. 2002;106:12274–12281. [Google Scholar]
- 66.Attard P. Langmuir. 1996;12:1693–1695. [Google Scholar]
- 67.Attard P. Langmuir. 2000;16:4455–4466. [Google Scholar]
- 68.Mishchuk N, Ralston J, Fornasiero D. J Phys Chem A. 2002;106:689–696. [Google Scholar]
- 69.Steitz R, Gutberlet T, Hauss T, Klosgen B, Krastev R, Schemmel S, Simonsen AC, Findenegg GH. Langmuir. 2003;19:2409–2418. [Google Scholar]
- 70.Attard P, Moody MP, Tyrrell JWG. Physica A. 2002;314:696–705. [Google Scholar]
- 71.Tyrrell JWG, Attard P. Langmuir. 2002;18:160–167. [Google Scholar]
- 72.Tyrrell JWG, Attard P. Phys Rev Lett. 2001;87:176104. doi: 10.1103/PhysRevLett.87.176104. [DOI] [PubMed] [Google Scholar]
- 73.Parker JL, Claesson PM, Attard P. J Phys Chem. 1994;98:8468–8480. [Google Scholar]
- 74.Ishida N, Inoue T, Miyahara N, Higashitani K. Langmuir. 2000;16:6377–6380. [Google Scholar]
- 75.Attard P. Adv Colloid Interface Sci. 2003;104:75–91. doi: 10.1016/s0001-8686(03)00037-x. [DOI] [PubMed] [Google Scholar]
- 76.Lou ST, Ouyang ZQ, Zhang Y, Li XJ, Hu J, Li MQ, Yang FJ. J Vac Sci Technol B. 2000;18:2573–2575. [Google Scholar]
- 77.Ishida N, Sakamoto M, Miyahara M, Higashitani K. Langmuir. 2000;16:5681–5687. [Google Scholar]
- 78.Kekicheff P, Spalla O. Phys Rev Lett. 1995;75:1851–1854. doi: 10.1103/PhysRevLett.75.1851. [DOI] [PubMed] [Google Scholar]
- 79.Christenson HK, Claesson PM, Berg J, Herder PC. J Phys Chem. 1989;93:1472–1478. [Google Scholar]
- 80.Craig VSJ, Ninham BW, Pashley RM. Langmuir. 1998;14:3326–3332. [Google Scholar]
- 81.Meagher L, Craig CSJ. Langmuir. 1994;10:2736–2742. [Google Scholar]
- 82.Christenson HK, Parker JL, Yaminksy VV. Langmuir. 1992;8:2080. [Google Scholar]
- 83.Tsao YH, Yang SX, Evans DF, Wennerstrom H. Langmuir. 1991;7:3154–3159. [Google Scholar]
- 84.Considine RF, Hayes RA, Horn RG. Langmuir. 1999;15:1657–1659. [Google Scholar]
- 85.Craig VSJ, Ninham BW, Pashley RM. Langmuir. 1999;15:1562–1569. [Google Scholar]
- 86.Mahnke J, Stearnes J, Hayes RA, Fornasiero D, Ralston J. Phys Chem Chem Phys. 1999;1:2793–2798. [Google Scholar]
- 87.Meyer EE, Lin Q, Israelachvili JN. Langmuir. 2005;21:256–259. doi: 10.1021/la048318i. [DOI] [PubMed] [Google Scholar]
- 88.Snoswell DRE, Duan JM, Fornasiero D, Ralston J. J Phys Chem B. 2003;107:2986–2994. [Google Scholar]
- 89.Pashley RM. J Phys Chem B. 2003;107:1714–1720. [Google Scholar]
- 90.Karaman ME, Ninham BW, Pahsley RM. J Phys Chem. 1996;100:15503–15507. [Google Scholar]
- 91.Craig VSJ, Ninham BW, Pashley RM. J Phys Chem. 1993;97:10192–10197. [Google Scholar]
- 92.Wennerstrom H. J Phys Chem B. 2003;107:13772–13773. [Google Scholar]
- 93.Kampf N, Gohy JF, Jerome R, Klein J. J Polymer Sci B Polymer Phys. 2005;43:193–204. [Google Scholar]
- 94.Meyer EE, Lin Q, Hassenkam T, Oroudjev E, Israelachvili JN. Proc Natl Acad Sci USA. 2005;102:6839–6842. doi: 10.1073/pnas.0502110102. [DOI] [PMC free article] [PubMed] [Google Scholar]
- 95.Perkin S, Kampf N, Klein J. J Phys Chem B. 2005;109:3832–3837. doi: 10.1021/jp047746u. [DOI] [PubMed] [Google Scholar]
- 96.Tsao YH, Evans DF, Wennerstrom H. Langmuir. 1993;9:779–785. [Google Scholar]
- 97.Claesson PM, Herder PC, Blom CE, Ninham BW. J Colloid Interface Sci. 1987;118:68–79. [Google Scholar]
- 98.Chan DYC, Horn RG. J Chem Phys. 1985;83:5311–5324. [Google Scholar]
- 99.Lin Q, Meyer EE, Tadmor M, Israelachvili JN, Kuhl TL. Langmuir. 2005;21:251–255. doi: 10.1021/la048317q. [DOI] [PubMed] [Google Scholar]
- 100.Zhang JH, Yoon RH, Mao M, Ducker WA. Langmuir. 2005;21:5831–5841. doi: 10.1021/la047398n. [DOI] [PubMed] [Google Scholar]
- 101.Johnson KL, Kendall K, Roberts AD. Proc R Soc London Ser A; 1971. pp. 301–313. [Google Scholar]
- 102.Herder PC. J Colloid Interface Sci. 1990;134:336–345. [Google Scholar]
- 103.Kokkoli E, Zukoski CF. Langmuir. 1998;14:1189–1195. [Google Scholar]
- 104.Ben-Naim A, Yaacobi M. J Phys Chem. 1974;78:170–175. [Google Scholar]
- 105.Eriksson JC, Ljunggren S, Claesson PM. J Chem Soc Faraday Trans II. 1989;85:163–176. [Google Scholar]
- 106.Attard P. J Phys Chem. 1989;93:6441–6444. [Google Scholar]
- 107.Miklavic SJ, Chan DYC, White LR, Healy TW. J Phys Chem. 1994;98:9022–9032. [Google Scholar]
- 108.Podgornik R. J Chem Phys. 1989;91:5840–5849. [Google Scholar]
- 109.Podgornik R, Parsegian VA. Chem Phys. 1991;154:477–483. [Google Scholar]
- 110.Nguyen AV, Nalaskowski J, Miller JD, Butt HJ. Int J Mineral Processing. 2003;72:215–225. [Google Scholar]
- 111.Considine RF, Drummond CJ. Langmuir. 2000;16:631–635. [Google Scholar]
- 112.Rabinovich YI, Derjaguin BV, Churaev NV. Adv Colloid Interface Sci. 1982;16:63–78. [Google Scholar]
- 113.Yaminksy VV, Yushchenko V, Amelina EA, Shchukin ED. J Colloid Interface Sci. 1983;96:301–306. [Google Scholar]
- 114.Yaminksy VV, Ninham BW. Langmuir. 1993;9:3618–3624. [Google Scholar]
- 115.Bernard D. J Chem Phys. 1993;98:7236–7244. [Google Scholar]
- 116.Vinogradova OI, Bunkin NF, Churaev NV, Kiseleva OA, Lobeyev AV, Ninham BW. J Colloid Interface Sci. 1995;173:443–447. [Google Scholar]
- 117.Bunkin NF, Kiseleva OA, Lobeyev AV, Movchan TG, Ninham BW, Vinogradova OI. Langmuir. 1997;13:3024–3028. [Google Scholar]
- 118.Ederth T, Liedberg B. Langmuir. 2000;16:2177–2184. [Google Scholar]
- 119.Christenson HK, Yaminsky VV. Colloids Surf A Physicochem Eng Aspects. 1997;130:67–74. [Google Scholar]
- 120.Wood J, Sharma R. Langmuir. 1994;10:2307–2310. [Google Scholar]
- 121.Yushchenko V, Yaminksy VV, Shchukin ED. J Colloid Interface Sci. 1983;96:307–314. [Google Scholar]
- 122.Lauga E, Brenner MP, Stone HA. In: Handbook of Experimental Fluid Mechanics. Tropea C, Foss J, Yarin A, editors. New York: Springer; 2006. in press. [Google Scholar]


