Abstract
Drug exposure or pharmacodynamic breakpoints refer to a magnitude of drug exposure which separates a population into groups with high and low probabilities of attaining a desired outcome. We used a pharmacodynamic model of disseminated candidiasis to define an in vivo drug exposure breakpoint for flucytosine (5FC) against Candida albicans. The results were bridged to humans by using population pharmacokinetics and Monte Carlo simulation. An in vivo drug exposure breakpoint for 5FC was apparent when serum levels were above the MIC for 45% of the dosing interval. The Monte Carlo simulations suggested that using a human dose of 100 mg/kg of body weight/day in four divided doses, 5FC resistance was defined at an MIC of 32 mg/liter. Target attainment rates following administration of 25, 50, and 100 mg/kg/day were similar, suggesting that the use of a lower dose of 5FC is possible. Using six isolates of C. albicans with MICs ranging from 0.06 to >64 mg/liter, we also explored the influence that the MIC, the fraction of the dosing interval that the serum levels of 5FC remained above the MIC (T>MIC), the 5FC resistance genotype, and the in vivo growth rate had on the response to 5FC. The MIC and T>MIC were both critical measures affecting the generation of a drug effect but had no bearing on the magnitude of the maximal kill induced by 5FC. The in vivo growth rate was a critical additional determinant of the exposure-response relationship. There was a relationship between the 5FC resistance genotype and the exposure-response relationship.
The MIC is the standard in vitro measure of the potency of an antimicrobial agent. For many microorganisms and antimicrobial agents, there is a strong correlation between the MIC and the outcome of antimicrobial therapy. For fungi, however, such relationships are not consistently apparent. This is probably due to a range of factors, related to both the host and the invading pathogen, which may obscure any predictive outcome signal which emanates from the MIC (21). Failure to achieve adequate drug exposure to a fungal pathogen is likely to be an important cause of a suboptimal outcome (22). Consequently, a clinically relevant goal is the determination of levels of antifungal drug exposure that are associated with a high probability of a successful therapeutic outcome within a given patient population; this encapsulates the notion of drug exposure breakpoints that is the focus of the current study. Drug exposure breakpoints (synonymous with pharmacodynamic breakpoints) have been derived for a variety of organisms in both clinical and nonclinical models of infection (6, 13, 14). The principal advantage of this approach is to provide decision support for the derivation and validation of interpretative susceptibility breakpoints. In addition, the process provides an opportunity to reflect upon the adequacy of clinically pertinent dosing strategies, after considering both the variability of human pharmacokinetics and the distribution of MICs likely to be encountered in human infections.
Flucytosine (5FC) is a fluorinated pyrimidine which acts as a subversive substrate within the pyrimidine salvage pathway (16, 17). Flucytosine exhibits antifungal activity against Candida spp. and Cryptococcus neoformans. In clinical contexts, 5FC has been most frequently used in combination with amphotericin B to promote an additive to synergistic interaction (5). Furthermore, the addition of 5FC to amphotericin B has been used as an amphotericin B-sparing strategy and may minimize the probability of the emergence of 5FC resistance. Andes and van Ogtrop characterized the pharmacodynamics of 5FC in a neutropenic murine model of disseminated candidiasis and demonstrated the fraction of the dosing interval that serum levels of 5FC remained above the MIC (T>MIC) was the dynamic variable which best linked drug exposure to the observed drug effect (3).
The primary objective of the current study was the derivation of an in vivo drug exposure breakpoint for 5FC against Candida albicans. We sought to further explore the clinical implications of these findings by using Monte Carlo simulation. The first key step was achieved using a well-characterized murine model of disseminated candidiasis and a single strain of C. albicans. At this point, we explored the extent to which the MIC and the T>MIC accounted for the outcome of 5FC exposure. Subsequently, the exposure-response relationships for an additional five strains of C. albicans were also studied. These strains were chosen both to encompass the distribution of MICs of 5FC against C. albicans and on the basis of a previously defined putative 5FC resistance mechanism (17). This strategy provided an opportunity to investigate the relationship between the 5FC resistance genotype and the outcome following 5FC exposure.
MATERIALS AND METHODS
Drug, isolates, MIC, and 5FC resistance genotype.
5FC solution (10 mg/liter) was obtained from Valeant Pharmaceuticals (Basingstoke, United Kingdom). The experiments to derive the drug exposure breakpoint for 5FC were performed using C. albicans strain F/6862 (MIC of 0.125 mg/liter as determined using European Committee on Antimicrobial Susceptibility Testing [EUCAST] methodology [23]). To further assess the impact that the MIC, T>MIC, and 5FC resistance genotype had on the drug effect, an additional five strains of C. albicans were studied. These strains were F/10141, F/7421, F/9651, F/9464, and F/8341 and their modal 5FC MICs (ranges) according to EUCAST methodology (23), determined a total of five times, were 0.06 (0.06 to 0.125), 0.5 (0.5), 4.0 (4.0 to 8.0), 8.0 (4.0 to 8.0), and ≥ 64 (≥64) mg/liter, respectively. The 5FC MIC was also determined using CLSI (formerly NCCLS) methodology (20), which yielded concordant results, except for strains F/9651 and F/9464, both of which showed an MIC of ≥64 mg/liter. The 5FC resistance genotype had been previously defined for five of the six strains (17). The genotype of the remaining isolate, F/6862, was defined according to the methodology outlined in a previous publication (17). The relevant details are summarized in Table 1.
TABLE 1.
Study isolates
| Isolate | 5FC MIC (mg/liter)a | Amino acid at position 101b | Interpretation of genotype |
|---|---|---|---|
| F/10141 | 0.06 | Arg | Homozygous susceptible |
| F/6862 | 0.125 | Arg | Homozygous susceptible |
| F/7421 | 0.5 | Arg/Cys | Heterozygous |
| F/9651 | 4 | Arg | Homozygous susceptible, unknown mechanism of elevated MIC |
| F/9464 | 8 | Cys | Homozygous resistant |
| F/8341 | >64 | Cys | Homozygous resistant |
Determined using EUCAST methodology.
Polymorphisms within the protein uracil phosphoribosyltransferase.
Model of invasive candidiasis.
A murine pharmacodynamic model of disseminated candidiasis described previously was used (18). Male CD1 mice were immunosuppressed with cyclophosphamide (Pharmacia, Milton Keynes, United Kingdom). The inocula for strains F/6862, F/10141, F/7421, F/9651, F/9464, and F/8341 were 2 × 10⁴, 2 × 10⁴, 2 × 10⁴, 1 × 10⁵, 2 × 10⁵, and 2 × 10⁴ organisms per mouse, respectively. 5FC (or 0.9% saline as control) was administered intraperitoneally (i.p.) in 0.4 ml 0.9% saline. The first dose of drug was administered at 5 h postinfection, with the second and third doses administered 8 and 16 h later, respectively. All mice were sacrificed at 24 h after treatment initiation. Both kidneys were dissected, weighed, and homogenized for quantitative culture.
Murine pharmacokinetics of 5FC and determination of the exposure-response relationships for 5FC.
The serum pharmacokinetics of 5FC in infected CD1 mice were defined in a previous study (18). The parameter estimates (means ± standard deviations [SD]) were as follows: volume of the central compartment, 0.022 ± 0.017 liter; clearance, 0.021 ± 0.013 liter/h; the intercompartmental rate constants Kcp, 13.440 ± 7.330 h−1, and Kpc, 24.070 ± 6.020 h−1, and the term describing the first-order absorption of drug from the peritoneal cavity into the central compartment, Ka, 19.580 ± 9.660 h−1. The mean parameter estimates from the in vivo pharmacokinetic model (above) were used to transform the dose-response relationships to T>MIC versus effect.
Exposure-response relationships for strain F/6862.
The dose exposure-response relationship for 5FC against F/6862 was determined using 5FC at dosages of 0, 0.5, 1.0, 1.5, 3, 6.25, and 10 mg/kg of body weight administered i.p. every 8 hours for 24 h. A sigmoid Emax model (see equation 1 below) was fitted to the mean fungal densities, and the data were weighted by the inverse of the observed variance at each point. The model was implemented in the ADAPT II package software (11). The sigmoid Emax model was as follows:
 |
(1) |
where Emax is the asymptotic maximal reduction in fungal burden induced by drug exposure, EC50 is the drug exposure at which 50% of the maximum effect is observed, and H is the Hill (or slope) constant.
Establishing the target to define therapeutic success and failure in mice.
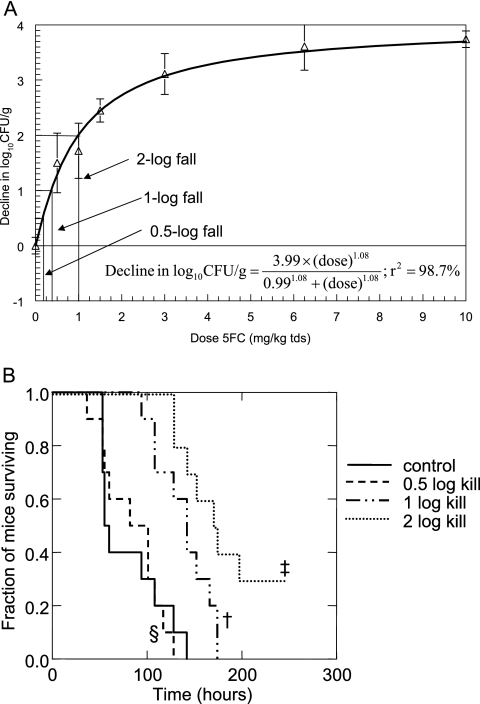
The duration of the pharmacodynamic model was extended to 10 days to examine the relationship between the fungal tissue burden induced after 24 h of therapy and the ultimate survival of mice. Cyclophosphamide was readministered every 5 days to reinduce neutropenia (the period of neutropenia extends from day 2 to 6 after cyclophosphamide administration). Four cohorts of mice, consisting of a control group (n = 10) and three treatment groups (n = 10 per group) were infected with strain F/6862. Mice in the treatment groups received 5FC i.p. every 8 h for 24 h only (i.e., only three doses of drug were administered), and animals were then observed. Note that because of the abbreviated therapy, this experiment does not represent a traditional survival model. The control group (cohort 1) received saline (0.4 ml i.p., three doses only), and cohorts 2, 3, and 4 were administered 5FC at 0.18, 0.37, and 1 mg/kg in 0.4-ml injections i.p. every 8 h for 24 h only; these dosage schedules were designed to induce a mean decline in the Candida kidney density of 0.5 log, 1 log, and 2 logs, respectively (Fig. 1). Survival was plotted following a Kaplan-Meier survival analysis.
FIG. 1.
(A) Sigmoid-Emax relationship for isolate F/6862 (MIC, 0.125 mg/liter). Data are means ± SD. The doses producing 0.5-, 1-, and 2-log falls in log10CFU/g were 0.18, 0.37, and 1 mg/kg administered every 8 h, respectively. (B) Kaplan-Meier survival curves for groups of mice infected with strain F/6862 (MIC, 0.125 mg/liter) following 24 h of 5FC therapy, to further examine the consequences of various degrees of antifungal killing. ‡, 2-log drop versus 1-log drop, P = 0.039; †, 1-log drop versus control, P = 0.002; §, 0.5-log drop versus control, P = 0.854.
Establishing the probability of target attainment as a function of increasing levels of drug exposure and identification of an in vivo drug exposure breakpoint.
The relationship between the magnitude of drug exposure, quantified in terms of the T>MIC, and the probability of attaining the predefined therapeutic target (success versus failure) was examined using logistic regression. The drug exposure breakpoint was then determined using classification and regression tree analysis in order to identify two separate populations, each with a high and low probability of a successful outcome. In this analysis, individual mice were classified in terms of whether they had a successful outcome (i.e., ≥2-log fall in tissue burden) as a function of drug exposure (fraction of the dosing interval that serum concentrations exceeded the MIC) which developed in each mouse. This analysis was performed with the use of SYSTAT version 11 (Richmond, CA).
Population pharmacokinetic data for 5FC in humans and Monte Carlo simulation.
The available literature describing the population pharmacokinetics of 5FC was retrieved and reviewed (10, 15, 26); ultimately, data from Ette et al. (15) were chosen. The population parameter mean values and their respective dispersions based upon a 70-kg male with the mean renal function of the population described in the study were used for the simulations. The mean population parameter vectors were embedded in subroutine PRIOR of ADAPT II (11), and a 9,999-subject Monte Carlo simulation was performed. The proportion of simulated patients receiving 25, 50, and 100 mg/kg/day of 5FC in which the serum levels of 5FC exceeded 45% of the dosing interval was determined. The MIC distribution of C. albicans was defined using 1,941 C. albicans isolates, obtained from 10 European data sources and tested using EUCAST methodology (data kindly supplied by Gunnar Kahlmeter, EUCAST).
Effect of genotype, MIC, and T>MIC on the exposure-response relationships.
The dose effect, T>MIC-versus-effect relationships, and influence of 5FC resistance genotype on the antifungal response were determined. This was achieved using the same murine model of disseminated candidiasis and the optimized inocula for each strain.
Relationship between in vivo growth of Candida isolates and Emax.
The T>MIC-versus-effect relationships for the six C. albicans isolates did not overlie one another; consequently, it was clear that the T>MIC did not account for all of the residual system variance within the dose-response relationships. Previous studies have suggested that the rate of bacterial growth may be a determinant of the magnitude of the observed effect following exposure to antimicrobial agents. Consequently, we studied the rate of in vivo growth and examined the relationship between the rate of growth and the extent of 5FC-induced killing. These experiments were restricted to four of the six isolates in which a dose-response relationship was evident (F/10141, F/6862, F/7421, and F/9651, with MICs of 0.06, 0.125, 0.5 and 4.0 mg/liter, respectively). A total of nine mice per strain were used. The same inoculum was used for each strain; each mouse received 2 × 10⁴ Candida organisms intravenously in 0.2 ml phosphate-buffered saline. For each isolate, groups of three mice were sequentially sacrificed at 5, 19, and 29 h following the initiation of infection; the fungal density within the kidneys was then determined using the methodology described above. The in vivo growth of each isolate was modeled using equation 2
 |
(2) |
where X(1) is the population density at a given time, Kg is the maximum growth rate constant, and POPMAX is the theoretical maximum fungal density. The model was implemented in the nonparametric adaptive grid population pharmacokinetic program (19), and the Bayesian estimates of the parameter means and their dispersions were obtained using a population analysis. The relationship between the estimate of Kg for each isolate and the maximum effect as defined for each isolate using equation 1 above was defined.
Incorporation of the rate of in vivo growth into the final model of drug effect.
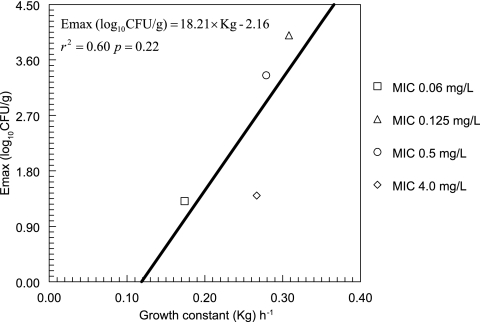
Since a linear relationship was apparent between Kg and the maximum effect induced by 5FC (see Fig. 6), two competing models to account for drug action were compared. In the first case, drug effect was modeled using a conventional sigmoid-Emax relationship as defined in equation 1. In a second, expanded model represented by equation 3, we allowed the growth rate to independently affect the model estimates of the Candida kidney density following exposure to 5FC. Since Kg appeared to be directly proportional to the maximum effect, the second term in equation 3, which incorporates Kg, is a linear function which contributes a fraction, F, to the overall estimate of drug effect:
 |
(3) |
With the exception of Kg, each of the parameter values were obtained as part of the estimation process. The value of Kg for each of the strains was fixed using the estimates provided in Table 2. The fit of both models to the data was assessed by the log-likelihood value and the coefficient of determination for the linear regression of the observed versus predicted values after the Bayesian step. The respective models were compared using the likelihood ratio test, in which twice the log-likelihood difference was evaluated against a chi-square distribution with three degrees of freedom (represented by the slope, intercept, and F).
FIG. 6.
Correlation between the growth constant (Kg) and the maximum effect induced by 5FC. The maximum effect was taken from the mean parameter estimates shown in Fig. 1.
TABLE 2.
Parameter estimates from the population analysis of the rate of in vivo growth, including the Bayesian estimates for the parameter means and their dispersions describing the in vivo growth of four isolates
| Isolate | 5FC MIC (mg/liter) | Growth constant Kg (h−1)
|
POPMAXa (CFU/g)
|
Fungal density at time zero (CFU/g)
|
|||
|---|---|---|---|---|---|---|---|
| Mean | SD | Mean | SD | Mean | SD | ||
| F/10141 | 0.06 | 0.174 | 1.64 × 10⁻⁴ | 9.99 × 10⁸ | 9.60 × 10³ | 2.71 × 10² | 0.4 |
| F/6862 | 0.125 | 0.308 | 6.97 × 10⁻⁵ | 1.33 × 10⁷ | 5.12 × 10⁵ | 1.03 × 10² | 0.09 |
| F/7421 | 0.5 | 0.279 | 1.33 × 10⁻⁹ | 9.99 × 10⁸ | 5.77 | 16.3 | 5.74 × 10⁻⁷ |
| F/9651 | 4.0 | 0.267 | 3.35 × 10⁻² | 9.99 × 10⁸ | 2.79 × 10⁴ | 45.79 | 81.42 |
Theoretical maximum achievable population density.
RESULTS
Model of invasive candidiasis.
Using the optimized inocula for each of the strains of C. albicans, there was no mortality within the 29-h period following the initiation of infection. The Candida kidney burdens (mean log10CFU/g ± SD) at the end of the experiment in untreated mice (n = 3 per group) infected with F/10141, F/6862, F/7421, F/9651, F/9464, and F/8341 were 4.34 ± 0.53, 5.87 ± 0.32, 4.40 ± 0.36, 5.46 ± 0.48, 4.75 ± 0.44, and 3.38 ± 0.47, respectively.
Exposure-response relationships for 5FC.
The dose-response relationship for 5FC against strain F/6862 is shown in Fig. 1. The data were accounted for by a sigmoid Emax model with r2 = 98.7%. The doses which resulted in 0.5-, 1-, and 2-log declines in the Candida kidney density at 24 h after treatment initiation were 0.18, 0.37, and 1 mg/kg administered every 8 hours, respectively (Fig. 1 and Table 3).
TABLE 3.
Magnitudes of drug exposure required to produce various degrees of anti-Candida effect
| Fungal burden | % Reduction in fungal burden from Econa | 5FC dose (mg/kg tds) | T>MICb |
|---|---|---|---|
| Econ | 0 | 0 | 0 |
| Econ − 0.5 log unit | 12.5 | 0.18 | 0.15 |
| Econ − 1 log unit | 25 | 0.37 | 0.22 |
| Econ − 2 log units | 50 | 1 | 0.35 |
| Stasisc | 71.5 | 2.34 | 0.52 |
Econ, fungal burden in the absence of drug therapy.
T>MIC, fraction of the dosing interval that serum 5FC concentrations exceed the MIC of 0.125 mg/liter.
No net change in the fungal burden following therapy (i.e. the magnitude of drug exposure required to reduce the fungal burden at the end of therapy [mean log10CFU/g ± SD, 5.72 ± 0.33] to the level observed at the commencement of therapy [mean log10CFU/g ± SD, 2.76 ± 0.25]).
Survival of mice.
The 10-day Kaplan Meier survival curves of four cohorts of mice which received 5FC to induce 0-, 0.5-, 1-, and 2-log falls in the Candida kidney density (compared with controls) after only 24 h of therapy are shown in Fig. 1. The mean survival times for control mice and the three treatment cohorts in which 0.5-, 1-, and 2-log falls in log10CFU/g had been induced were 80.1, 84.2, 138.8, and 182.6 h, respectively. There was no difference in survival between control mice and those in which a 0.5-log fall had been induced (χ2 = 0.034; 1 df; P = 0.85). In contrast, there was a statistically significant prolongation in the survival of mice in which a 1-log fall had been induced in comparison with controls (χ2 = 9.862; 1 df; P = 0.002) as well as in mice in which a 2-log fall had been induced in comparison with 1-log fall (χ2 = 4.257; 1 df; P = 0.04). On the basis of these results, a 2-log fall was employed as the microbiological target within the murine model.
Defining the probability of target attainment in vivo.
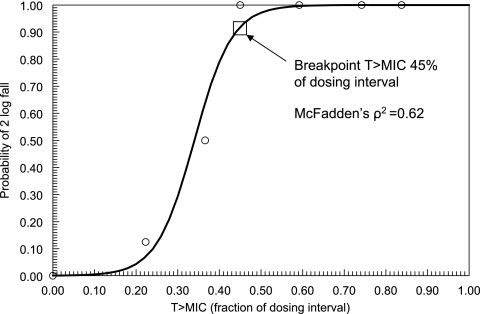
The logistic regression analysis revealed a statistically significant relationship between the magnitude of drug exposure, quantified in terms of T>MIC, and attainment of the microbiological target of a 2-log fall of CFU/g within the kidney (χ2 = 40.13; df = 1; P < 0.001) (Fig. 2). Classification and regression tree analysis revealed that a T>MIC for at least 45% of the dosing interval optimally separated mice attaining the target into high- and low-probability groups; this magnitude of drug exposure corresponded to a 94% probability of attaining the target (Fig. 2) and was employed as the drug exposure breakpoint which was bridged to humans.
FIG. 2.
Relationship between the continuous variable T>MIC and the probability of achieving a 2-log fall in log10CFU/g in the kidneys of mice infected with strain F/6862 (MIC, 0.125 mg/liter), as defined using logistic regression. The regression coefficients for the constant and T>MIC were −7.506 (P = 0.008) and 22.08 (P = 0.004), respectively. The breakpoint value of T>MIC for 45% of the dosing interval was defined using classification and regression tree analysis. A serum level above the MIC for at least 45% of the dosing interval optimally separated the population into groups with high and low probabilities of a 2-log fall within the kidney. Circles represent raw data obtained from eight mice (except for controls and the group in which the T>MIC was 0.83, which consisted of four mice).
Bridging to humans and the relationship between dose and susceptibility breakpoints.
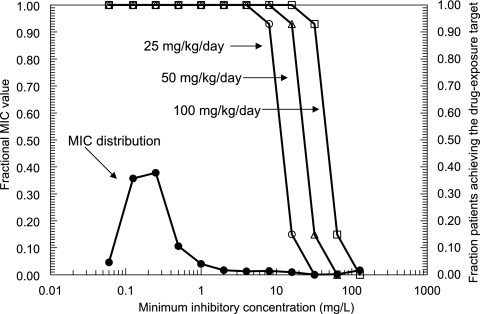
The proportion of the 9,999 simulated human patients in whom a dose of 5FC of 25, 50, or 100 mg/kg/day in four equally divided doses resulted in serum drug levels above the MIC for at least 45% of the dosing interval is shown in Fig. 3. The MIC90 for the 1,941 C. albicans strains was 1 mg/liter. The simulations of the 9,999 patients receiving total doses of 25, 50, and 100 mg/kg/day resulted in highly favorable and comparable overall fractional population target attainment rates of 98.0, 98.2, and 98.6%, respectively. The simulations suggested that the in vivo drug exposure target (i.e., T>MIC of ≥45%) was attained in at least 95% of simulated patients who were infected with an isolate (of C. albicans) with an MIC of 16 mg/liter or less and who received at least 100 mg/kg/day in four divided doses. This finding suggests that the MIC which defines 5FC resistance, using EUCAST methodology, is 32 mg/liter. Importantly, however, such a breakpoint is tenable only if a human dose of 100 mg/kg/day is used; a downward revision in dose to 50 or 25 mg/kg/day would require a simultaneous reduction in the susceptibility breakpoint to 16 or 8 mg/liter, respectively. Thus, Fig. 3 highlights that dose and susceptibility breakpoints are inextricably linked.
FIG. 3.
Fraction of the 9,999 simulated patients which achieved the drug exposure target (i.e., serum 5FC concentrations greater than the MIC for at least 45% of the dosing interval) following the administration of 5FC at 25, 50 and 100 mg/kg/day, depicted by open circles, triangles, and squares, respectively. The distribution of the MICs for 1,941 C. albicans isolates, obtained using the EUCAST method, is shown by the solid circles.
Exposure-response relationships for other strains.
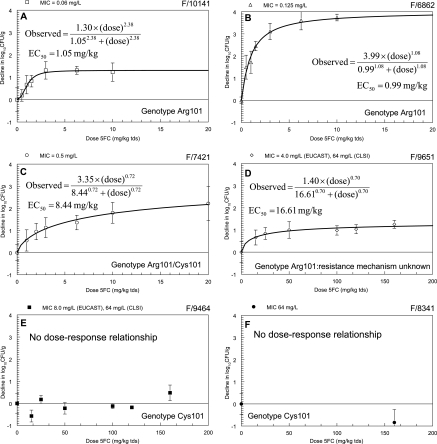
The dose-response relationships for each of the six strains of C. albicans are illustrated in Fig. 4. The fit of the population model was excellent (log-likelihood value of 20.33 and r2 of 99.1% for the observed versus predicted values after the Bayesian step). Isolates with higher MICs had higher estimates for their EC50s, indicating that the MIC of 5FC is a determinant of the concentration of 5FC that is required to induce an antifungal effect. Of note, however, is the fact that the MIC did not appear to exert any influence upon the extent of fungal killing induced by 5FC exposure (see Fig. 4); the maximum effect induced by 5FC, for example, between the susceptible strains F/10141 and F/6862 varied 2.8-fold.
FIG. 4.
Dose-response relationships for each of the study strains. Data are means ± SD. (A) F/10141 (MIC, 0.06 mg/liter; homozygous susceptible); (B) F/6862 (MIC, 0.125 mg/liter; homozygous susceptible); (C) F/7421 (MIC, 0.5 mg/liter; heterozygous); (D) F/9651 (MIC, 4.0 mg/liter; resistance mechanism unknown); (E) F/9464 (MIC, 8.0 mg/liter; homozygous resistant); (F) F/8341 (MIC, 64 mg/liter; homozygous resistant) (for this strain only the maximum possible dose was studied and growth was observed). The model fits from the population analysis and mean parameter estimates for each strain are shown. The EC50s vary 25-fold.
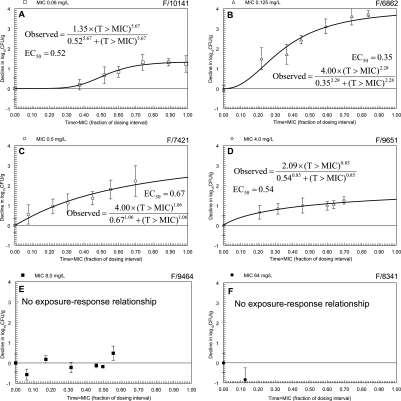
Figure 5, shows the T>MIC-versus-response relationships. The most striking consequence of expressing drug exposure in this manner was the convergence of the sigmoid-Emax relationships in the plane of the T>MIC axis. When drug effect was quantified in terms of the dose of 5FC, the EC50s varied 25-fold. Following the transformation and expression of drug effect in terms of the T>MIC, the EC50s varied approximately twofold, indicating that T>MIC accounts for a significant proportion of the residual system variance that was present in the dose-response relationships.
FIG. 5.
Relationship between the fraction of the dosing interval that serum 5FC concentrations are above the MIC (T>MIC) and the observed response for each of the study strains. The model was fitted to the data using a population methodology; r2 = 99.2%. The importance of the T>MIC in accounting for the exposure-response relationships is highlighted by the fact that the estimates for the EC50s now vary approximately twofold. The decline in log10CFU/g varies between strains and is independent of the 5FC MIC.
Effect of in vivo growth.
The estimates for the means and dispersions for the parameters describing the in vivo growth of the four strains obtained from the population analysis are summarized in Table 2. The fit of the model was highly acceptable; the coefficient of determination for the observed versus predicted values obtained after the Bayesian step was r2 = 0.97 (P < 0.001). Of particular note is the difference in the rates of in vivo growth between the four strains, with the estimates for Kg ranging from 0.173 to 0.308 h−1. The linear regression between Emax and Kg is shown in Fig. 6; while a linear relationship appeared tenable, the regression was not statistically significant (P = 0.22).
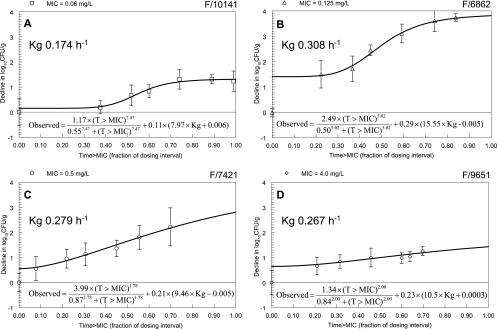
The fits of a standard sigmoid Emax model and an expanded model (Fig. 7) which incorporated the growth constant, Kg, to the data were both highly acceptable; in the case of the former, the coefficient of determination for the observed versus predicted values after the Bayesian step was 99.2% and the log-likelihood value was 9.40. The fit of the expanded model, in which the in vivo growth rate was allowed to influence the estimate of drug effect, yielded the same coefficient of determination (r2 = 99.2%), but the model produced a more likely solution (log-likelihood values of 26.92 versus 9.40 for the expanded versus standard models, respectively (twice difference in likelihood value χ2 = 35; df = 3; P < 0.001), indicating that the rate of in vivo growth exerted an influence on the observed antifungal effect.
FIG. 7.
Expanded model describing the effect of 5FC. The exposure-response relationships are influenced by both the fraction of the dosing interval that the serum concentrations of 5FC are above the MIC (T>MIC) and the growth rate (Kg).
DISCUSSION
A vital question regarding any anti-infective drug is the magnitude of drug exposure which optimizes the probability of engendering a favorable outcome within a patient population. Experimental systems are likely to play an increasingly important role in the derivation and validation of antifungal breakpoints. This study addresses an approach by which experimental data can be acquired and the implications bridged to humans. The challenges for the determination of antifungal breakpoints in experimental pharmacodynamic models include (i) establishing the appropriate in vivo therapeutic end point which is also likely to be valid for humans and (ii) establishing the probability with which one wishes to attain that target.
In terms of the end point, the most straightforward measure of outcome is a dichotomous variable, such as survival, microbiological clearance, or the resolution of an infectious syndrome (see, for example, methodology employed by Drusano et al. (12, 13) and Andes and Craig (1). In the majority of pharmacodynamic models, however, the biomarker is a continuous variable, and the experimental design is such that sterilization of the affected site is rarely achieved. Consequently, if pharmacodynamic models are to be used for breakpoint definition, a cutoff value must be sought and applied. In the pharmacodynamic literature, two end points have been used: (i) the attainment of stasis (i.e., the reduction of the infectious burden to the level observed at the initiation of therapy) and (ii) some proportional reduction in the infectious burden (e.g., E50 or E90) (see for example references 2 and 6). There is no universally applicable end point; the choice depends on the context. For severe infections, orders of logarithmic killing are probably required; for other infections, a less stringent end point may suffice. In the current study, we attempted to link various orders of logarithmic killing with survival; a 2-log fall induced after 24 h of therapy was associated with prolongation in survival. As shown in Table 3, we could equally have used a 50% reduction in infectious burden and obtained the same result.
The probability with which one wishes to attain the target must also be explicitly defined. If the drug exposure required to achieve a mean 2-log fall was used as the pharmacodynamic target, then only approximately 50% of mice would attain that target; such a response rate would be clinically unacceptable. Ideally one would prefer that a high proportion of the population attain the microbiological target of interest. Using logistic regression, we demonstrated that if serum levels were greater than the MIC for 45% of the dosing interval, there was a 94% probability within the murine population of achieving a 2-log fall in fungal tissue burden. As demonstrated in Fig. 2, progressively higher drug exposures are required to further increase the probability of attaining the target, but the gains are small. Conversely, in circumstances in which drug exposure is suboptimal, a proportion of drug recipients may still respond; i.e., the response rate is not necessarily zero.
The British Society for Medical Mycology (7) and the CLSI (20) have published susceptibility breakpoints for 5FC against Candida spp. According to the British Society for Medical Mycology, the breakpoint for sensitive is ≤1.0 mg/liter, that for intermediate susceptibility is 2.0 to 8.0 mg/liter, and that for resistant ≥ 16 mg/liter (7). The CLSI breakpoints are as follows: susceptible, ≤4.0 mg/liter; intermediate susceptibility, 8.0 to 16.0 mg/liter; and resistant, ≥32 mg/liter (20). EUCAST has yet to publish susceptibility breakpoints for 5FC; in this regard, the current study provides the following perspectives that may be useful in this process. First, 5FC resistance could be defined by an MIC of ≥32 mg/liter, although this is strictly contingent upon a dose of 100 mg/kg/day being used; the use of a smaller dose would require a simultaneous downward revision of the susceptibility breakpoint. Second, if 100 mg/kg/day is to be used, there is no requirement to define an intermediate resistant category; such a construct would be useful only for dosages of 25 to 50 mg/kg/day to indicate that a higher dose would be required to treat certain strains for which therapy would likely fail at the lower dose (e.g., if 25 mg/kg/day was used, isolates with MICs of 8 and 16 could be designated “susceptible dose dependent” to indicate that 100 mg/kg/day would be required to maximize the probability of therapeutic success; there are parallels to draw here with susceptibility breakpoints for fluconazole as defined by the CLSI [20]). Finally, there is an interplay between the effect induced by various simulated doses, as assessed by fractional target attainment rate. As demonstrated in Fig. 4, the fractional population attainment rates for 25, 50, and 100 mg/kg/day are comparable simply because the vast majority of isolates have an MIC of ≤0.25 mg/liter. These data suggest that the dose of 5FC for the treatment of disseminated candidiasis due to C. albicans could be lowered (with concomitant reduction in the 5FC susceptibility breakpoint, as discussed above). Importantly, however, these results may not apply to non-C. albicans species of Candida, to other yeasts such as Cryptococcus neoformans, or to the treatment of infections within sanctuary sites such as the central nervous system.
A pharmacodynamic approach also provides an opportunity to reflect upon the predictive value of an MIC or other in vitro measures of drug potency, such as the drug resistance genotype. The MICs of 5FC for C. albicans may be difficult to read because of trailing, thus raising the question as to which is the “right” MIC. Clearly, the MIC of strain F/9464, which was consistently estimated at 8.0 mg/liter using EUCAST methodology, is likely to be falsely low given the lack of any observed exposure-response relationship, despite seemingly adequate levels of drug exposure. For this strain, an MIC of ≥64 as determined using CLSI methodology better predicts the lack of an in vivo response. Conversely, however, an MIC of 4.0 mg/liter for isolate F/9651, as determined using the EUCAST method, does predict the response to 5FC, whereas the estimate of ≥64 mg/liter produced by the CLSI method does not (falsely high). These results suggest that both methodologies misclassify certain strains, and consequently, further technical refinements are warranted (see, for example, reference 24). The determination of the 5FC resistance genotype may be a useful adjunct to more conventional techniques, especially for strains with reduced susceptibility without frank resistance.
One of the most significant findings of the current analyses is that the rate of in vivo growth appears to be an important and additional determinant of the drug effect. Decreased antimicrobial susceptibility has been described in the setting of reduced growth rates induced by nutrient deficiencies, noxious insults, organisms in a stationary phase of growth, or organisms growing within biofilms (4, 8, 25). The mechanism by which the rate of in vivo growth is related to the antifungal effect is unclear. An explanation which specifically relates to 5FC involves its mechanism of action. Since the period of rapid DNA synthesis occupies a finite time within the cell cycle (9) and is independent of the growth rate, organisms that are rapidly growing spend a higher proportion of their time synthesizing DNA; this may render these strains more susceptible to the action of 5FC.
In summary, experimental models of disseminated candidiasis enable a further understanding of exposure-response relationships and therefore can play a central role in the provision of decision support in the process of setting susceptibility breakpoints. Further research is required to provide a better understanding of the factors related to both the host and fungus which determine the outcome of antimicrobial therapy.
Acknowledgments
We are indebted to the EUCAST Antifungal Susceptibility Testing Committee for providing the 5FC MIC distribution data.
William Hope is supported by an unrestricted educational grant from Merck & Co. This study was supported by a grant from Valeant Pharmaceuticals and the Fungal Research Trust.
Footnotes
Published ahead of print on 5 September 2006.
REFERENCES
- 1.Andes, D., and W. A. Craig. 1998. In vivo activities of amoxicillin and amoxicillin-clavulanate against Streptococcus pneumoniae: application to breakpoint determinations. Antimicrob. Agents Chemother. 42:2375-2379. [DOI] [PMC free article] [PubMed] [Google Scholar]
- 2.Andes, D., K. Marchillo, T. Stamstad, and R. Conklin. 2003. In vivo pharmacokinetics and pharmacodynamics of a new triazole, voriconazole, in a murine candidiasis model. Antimicrob. Agents Chemother. 47:3165-3169. [DOI] [PMC free article] [PubMed] [Google Scholar]
- 3.Andes, D., and M. van Ogtrop. 2000. In vivo characterization of the pharmacodynamics of flucytosine in a neutropenic murine disseminated candidiasis model. Antimicrob. Agents Chemother. 44:938-942. [DOI] [PMC free article] [PubMed] [Google Scholar]
- 4.Baillie, G. S., and L. J. Douglas. 1998. Effect of growth rate on resistance of Candida albicans biofilms to antifungal agents. Antimicrob. Agents Chemother. 42:1900-1905. [DOI] [PMC free article] [PubMed] [Google Scholar]
- 5.Bennett, J. E., W. E. Dismukes, R. J. Duma, G. Medoff, M. A. Sande, H. Gallis, J. Leonard, B. T. Fields, M. Bradshaw, H. Haywood, Z. A. McGee, T. R. Cate, C. G. Cobbs, J. F. Warner, and D. W. Alling. 1979. A comparison of amphotericin B alone and combined with flucytosine in the treatment of cryptoccal meningitis. N. Engl. J. Med. 301:126-131. [DOI] [PubMed] [Google Scholar]
- 6.Booker, B. M., P. F. Smith, A. Forrest, J. Bullock, P. Kelchlin, S. M. Bhavnani, R. N. Jones, and P. G. Ambrose. 2005. Application of an in vitro infection model and simulation for reevaluation of fluoroquinolone breakpoints for Salmonella enterica serotype Typhi. Antimicrob. Agents Chemother. 49:1775-1781. [DOI] [PMC free article] [PubMed] [Google Scholar]
- 7.British Society for Mycopathology. 1984. Laboratory methods for flucytosine (5-fluorocytosine). Report of a Working Group of the British Society for Mycopathology. J. Antimicrob. Chemother. 14:1-8. [PubMed] [Google Scholar]
- 8.Brown, M. R., P. J. Collier, and P. Gilbert. 1990. Influence of growth rate on susceptibility to antimicrobial agents: modification of the cell envelope and batch and continuous culture studies. Antimicrob. Agents Chemother. 34:1623-1628. [DOI] [PMC free article] [PubMed] [Google Scholar]
- 9.Cooper, S. 1979. A unifying model for the G1 period in prokaryotes and eukaryotes. Nature 280:17-19. [DOI] [PubMed] [Google Scholar]
- 10.Cutler, R. E., A. D. Blair, and M. R. Kelly. 1978. Flucytosine kinetics in subjects with normal and impaired renal function. Clin. Pharmacol. Ther. 24:333-342. [DOI] [PubMed] [Google Scholar]
- 11.D'Argenio, D. Z., and A. Schumitzky. 1997. ADAPT II. A program for simulation, identification, and optimal experimental design. User manual. Biomedical Simulations Resource, University of Southern California, Los Angeles. [Online.] http://bmsr.esc.edu/.
- 12.Drusano, G. L., D. E. Johnson, M. Rosen, and H. C. Standiford. 1993. Pharmacodynamics of a fluoroquinolone antimicrobial agent in a neutropenic rat model of Pseudomonas sepsis. Antimicrob. Agents Chemother. 37:483-490. [DOI] [PMC free article] [PubMed] [Google Scholar]
- 13.Drusano, G. L., S. L. Preston, C. Fowler, M. Corrado, B. Weisinger, and J. Kahn. 2004. Relationship between fluoroquinolone area under the curve: minimum inhibitory concentration ratio and the probability of eradication of the infecting pathogen, in patients with nosocomial pneumonia. J. Infect. Dis. 189:1590-1597. [DOI] [PubMed] [Google Scholar]
- 14.Drusano, G. L., S. L. Preston, C. Hardalo, R. Hare, C. Banfield, D. Andes, O. Vesga, and W. A. Craig. 2001. Use of preclinical data for selection of a phase II/III dose for evernimicin and identification of a preclinical MIC breakpoint. Antimicrob. Agents Chemother. 45:13-22. [DOI] [PMC free article] [PubMed] [Google Scholar]
- 15.Ette, E. I., P. J. Williams, Y. H. Kim, J. R. Lane, M. J. Liu, and E. V. Capparelli. 2003. Model appropriateness and population pharmacokinetic modeling. J. Clin. Pharmacol. 43:610-623. [PubMed] [Google Scholar]
- 16.Francis, P., and T. J. Walsh. 1992. Evolving role of flucytosine in immunocompromised patients: new insights into safety, pharmacokinetics, and antifungal therapy. Clin. Infect. Dis. 15:1003-1018. [DOI] [PubMed] [Google Scholar]
- 17.Hope, W. W., L. Tabernero, D. W. Denning, and M. J. Anderson. 2004. Molecular mechanisms of primary resistance to flucytosine in Candida albicans. Antimicrob. Agents Chemother. 48:4377-4386. [DOI] [PMC free article] [PubMed] [Google Scholar]
- 18.Hope, W. W., P. A. Warn, A. Sharp, P. Reed, B. Keevil, A. Louie, D. W. Denning, and G. L. Drusano. 2005. Surface response modeling to examine the combination of amphotericin B deoxycholate and 5-fluorocytosine for treatment of invasive candidiasis. J. Infect. Dis. 192:673-680. [DOI] [PubMed] [Google Scholar]
- 19.Leary, R., R. Jelliffe, A. Schumitzky, and M. van Guilder. 2001. An adaptive grid, non-parametric approach to pharmacokinetic and dynamic (PK/PD) models, p. 389-394. In Proceedings, Fourteenth IEEE Symposium on Computer-Based Medical Systems. IEEE Computer Society, Bethesda, Md.
- 20.National Committee for Clinical Laboratory Standards. 1997. Reference method for broth dilution antifungal susceptibility testing of yeasts. Approved standard M27-A2. National Committee for Clinical Laboratory Standards, Wayne Pa.
- 21.Rex, J. H., M. A. Pfaller, J. N. Galgiani, M. S. Bartlett, A. Espinel-Ingroff, M. A. Ghannoum, M. Lancaster, F. C. Odds, M. G. Rinaldi, T. J. Walsh, and A. L. Barry. 1997. Development of interpretive breakpoints for antifungal susceptibility testing: conceptual framework and analysis of in vitro-in vivo correlation data for fluconazole, itraconazole, and Candida infections. Clin. Infect. Dis. 24:235-247. [DOI] [PubMed] [Google Scholar]
- 22.Rex, J. H., M. A. Pfaller, T. J. Walsh, V. Chaturvedi, A. Espinel-Ingroff, M. A. Ghannoum, L. L. Gosey, F. C. Odds, M. G. Rinaldi, D. J. Sheehan, and D. W. Warnock. 2001. Antifungal susceptibility testing: practical aspects and current challenges. Clin. Microbiol. Rev. 14:643-658. [DOI] [PMC free article] [PubMed] [Google Scholar]
- 23.Rodriguez-Tudela, J. L., F. Barchiesi, J. Bille, E. Chryssanthou, M. Cuenca-Estrella, D. Denning, J. P. Donnelly, B. Dupont, W. Fegeler, C. Moore, M. Richardson, and P. E. Verweij. 2003. Method for the determination of minimum inhibitory concentration (MIC) by broth dilution of fermentative yeasts. Clin. Microbiol. Infect. 9:I-VIII. [Google Scholar]
- 24.te Dorsthorst, D. T., P. E. Verweij, J. F. Meis, and J. W. Mouton. 2005. Relationship between in vitro activities of amphotericin B and flucytosine and pH for clinical yeast and mold isolates. Antimicrob. Agents Chemother. 49:3341-3346. [DOI] [PMC free article] [PubMed] [Google Scholar]
- 25.Tuomanen, E., R. Cozens, W. Tosch, O. Zak, and A. Tomasz. 1986. The rate of killing of Escherichia coli by beta-lactam antibiotics is strictly proportional to the rate of bacterial growth. J. Gen. Microbiol. 132:1297-1304. [DOI] [PubMed] [Google Scholar]
- 26.Vermes, A., R. A. Math t, I. H. van der Sijs, J. Dankert, and H. J. Guchelaar. 2000. Population pharmacokinetics of flucytosine: comparison and validation of three models using STS, NPEM, and NONMEM. Ther. Drug Monit. 22:676-687. [DOI] [PubMed] [Google Scholar]


