Abstract
Gene expression studies employing high throughput real time PCR methods require finding uniform conditions for optimal amplification of multiple targets, often a daunting task. We developed a primer database, qPrimerDepot, which provides optimized primers for all human and mouse RefSeq genes. These primers are designed to amplify desired templates under unified annealing temperature. For most intron-bearing genes, primers flank one of the largest introns thus minimizing background noise due to genomic DNA contamination. The qPrimerDepot database can be accessed at http://primerdepot.nci.nih.gov/ and http://mouseprimerdepot.nci.nih.gov/.
INTRODUCTION
Real time PCR (RT-PCR) can rapidly, reproducibly and quantitatively determine changes in gene expression (1). Although microarray analysis can measure large scale gene expression levels simultaneously, its hybridization-related variation often demands validation by other methods. Routinely, RT-PCR is used to verify the observation from microarray studies. However, several artifacts can confound the analysis including: (i) amplification of undesired template secondary to mispriming or annealing at inappropriate temperatures; and (ii) susceptibility to RNA contamination with genomic DNA, especially when collecting samples from tumor tissues (2). Though the problem of genomic contamination is partially addressed by DNase treatment this method is often incomplete and its protracted use often diminishes the sensitivity of detection. This is a costly problem particularly when the detection of rare transcripts in precious tissue samples is desired (3).
Low cost methods for detecting fluorescent dyes which bind to double stranded DNA, such as SYBR Green, are most widely used and suitable for high throughput screening. Since these dyes are not sequence specific, careful consideration should be given to avoid generating extraneous amplicons. One of the obstacles to high throughput RT-PCR gene expression studies in which multiple unique transcripts are simultaneously measured in 96 or 384 well formats, is the necessity to individually optimize each assay for each target (4). Currently, the criteria for successful determination by quantitative RT-PCR require that: (i) the optimal amplicon should be located in a non repetitive region without segments of low complexity, (ii) the optimal amplicon size should be ∼100 bp to ensure the efficiency of Taq polymerase processivity, (iii) if possible, primers should be designed to flank intron–exon borders or primers anneal at a splice junction to distinguish genomic DNA from cDNA template, and (iv) primers have similar melting temperatures with 20–70% GC content (5,6). It is a laborious and error-prone chore to design RT-PCR primers that meet these requirements. Available resources for pre-designed primers are limited. RTPrimerDB (http://medgen.ugent.be/rtprimerdb/), an online database, provides experimentally verified primer sets for 2699 human and 487 mouse genes (7,8). PrimerBank (http://pga.mgh.harvard.edu/primerbank/) is a well known resource that covers most known human (33 741) and mouse (27 681) genes (9). However, its primer algorithm is not designed to span introns and is therefore more prone to amplify contaminating genomic sequences. Here we describe qPrimerDepot, a primer database for RT-PCR analysis of >99% of human (23 400) and mouse (18 733) RefSeq genes. These primers sets are designed to be used under uniform annealing temperatures to facilitate their application in large scale high throughput assays. Moreover, to reduce the noise from contaminating genomic DNA (6), over 90% of the primer sets are designed to produce amplicons bridging exon:exon junctions of intron-bearing genes.
MATERIALS AND METHODS
Data processing
Sequences file (refMrna.zip) and intron/exon information tables (refGene.txt.gz) of 23 463 human and 18 737 mouse RefSeq genes (UCSC hg17 and mm6) were downloaded from UCSC genome browser (http://hgdownload.cse.ucsc.edu/).
To assure amplicons free of repetitive elements and sequences of low complexity (10), we utilized Biowulf, a high-performance Linux cluster at the National Institutes of Health, to mask the repetitive elements using the RepeatMasker application with built-in MaskerAid (11).
Primer3 (12) was used to design primers for each RefSeq entry, with the following parameters: for intronless genes (5.5% of human RefSeq genes and of 12.4% of mouse RefSeq genes), primers were set to be between 17 and 27 bp with 20 bp as optimum, and melting temperature was set to be between 57 and 63°C with 60°C as optimum, all other parameters, such as PRIMER_SELF_ANY and PRIMER_SELF_END, were set to default (8.0 and 3.0, respectively) to assure low self-complementarity. All cDNA amplions were 90–150 bp in size to ensure Taq polymerase efficiency. For 99% of intron-bearing genes (94.5% human genes and 88.6% mouse genes bear at least one intron), primers were designed to flank or cross an exon-intron border in which the intron was one of the top three largest in the gene of interest. Thus, contamination by genomic DNA would generate either a longer product, which can be detected by melting curve analysis, or no product if the contamination template length (intron > 3 Kb) is too long for Taq polymerase to traverse during the extension period.
The BLAST algorithm was used via the NIH biowulf Linux cluster to evaluate all primers against corresponding RefSeq databases. The criteria for possible mis-priming requires that both primers have at least 15 matches in another RefSeq entry (i.e. expectation value, e < 1) (13,14). The BLAST result revealed that 891 of human and 420 of mouse primers may mis-prime to other RefSeq sequences. Sequence alignments of query and hit RefSeq using the BLAST2 algorithm (15) were performed and primer pairs which had <80% identities were filtered out of the database. Annotations are presented in the user interface for the individual primer sets that could ‘mis-prime’ another RefSeq gene with >80% identity. The sources of these mis-primed RefSeq will vary, but may include redundancy within the RefSeq database, transcript variants and paralogs of high sequence similarity. Each of these possibilities can be assessed by a direct link that is provided to in silico PCR (http://genome.ucsc.edu/cgi-bin/hgPcr?command=start) for all primer pair sets. This link allows the user to rapidly identify amplicon locations in the mouse and human genomes so that primer specificity can be visually assessed and validated.
qPrimerDepot can be accessed at http://primerdepot.nci.nih.gov/ or http://mouseprimerdepot.nci.nih.gov/ by querying the database with a RefSeq ID or a gene name. Batch query service is available upon request if user provides standard gene name or accession number. Flat files and MySQL dump file which have all primer information are also available upon request.
Experimental validation
Reverse transcription was applied with Omniscript RT Kit following manufacturer's protocol (Qiagen). A 20 μl RT reaction included 2 μg Universal reference RNA (Stratagen), 1 μM Oligo-dT primer, 2 μl of 10× RT buffer, 0.5 mM each dNTP, 10 U of RNase inhibitor, 4 U of Omniscript Reverse Transcriptase, and DEPC-treated water. The reaction mix was incubated at 37°C for 60 min. After the reaction, the mix was diluted 1:5 with water for PCR analysis.
Primer sequences were extracted from our database and synthesized by Integrated DNA Technologies (Coralville, IA, USA). Quantitative RT-PCR was carried out in a DNA Engine Opticon-2 Real Time PCR Detection System (MJ Research). In brief, each 20 μl reaction mix comprises 0.3 μM primers (both 5′ and 3′ primers), 1 μl template from reverse transcription and 10 μl 2 × QuantiTect SYBR Green PCR Master Mix (Qiagen). Each reaction mix was incubated at 95°C for 15 min, 40 cycles of 95°C for 15 s and 60°C for 1 min. A melting curve analysis which read every 0.3°C from 65 to 95°C was followed to assess the homogeneity of a PCR product. Real-time PCR results were analyzed using the software provided by the manufacturer.
RESULTS AND DISCUSSION
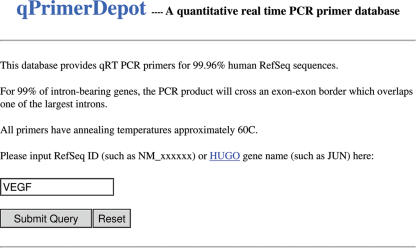
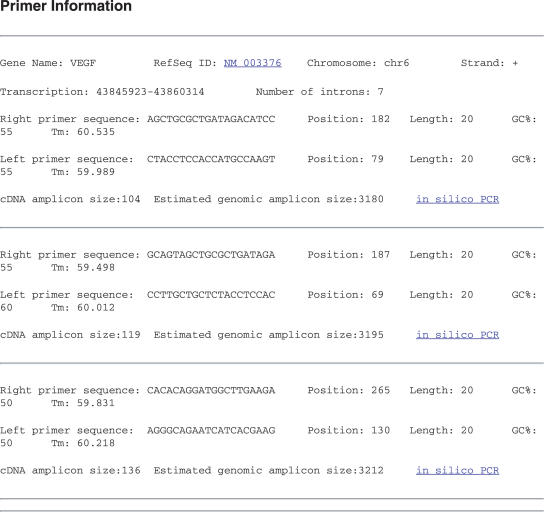
Our database comprises pre-designed primers for 42 133 mouse and human RefSeq genes (Table 1). For most genes three unique sets of primers are provided (96.3% of total). The database provides a simple user interface where the user may enter either the HUGO approved gene symbol or the RefSeq gene identifier (Figure 1). The database graphic output provides information on the primary transcript location, number of introns, primer sequence, primer length, GC%, amplicon size, and genomic amplicon size. Also a direct link is provided for location of the genomic amplicon by in silico PCR (Figure 2).
Table 1.
Summary statistics for qPrimerdepot primerDb
| Intron-bearing (%) | Intronless (%) | All entries (%) | ||
|---|---|---|---|---|
| Homo sapiens | ||||
| Intron-bearing genes | 22 176 | 100.00 | 94.51 | |
| Primer overlap an intron | 21 910 | 98.80 | 93.38 | |
| No intron considered | 212 | 0.96 | 0.90 | |
| Intronless genes | 1287 | 100.00 | 5.49 | |
| Primer provided for intronless genes | 1278 | 99.30 | 5.45 | |
| RefSeq genes | 23 463 | 100.00 | ||
| Total genes with primer design | 23 400 | 99.73 | ||
| Mus musculus | ||||
| Intron-bearing genes | 16 411 | 100.00 | 87.59 | |
| Primer overlap an intron | 16 293 | 99.28 | 86.96 | |
| No intron considered | 115 | 0.70 | 0.61 | |
| Intronless genes | 2326 | 100.00 | 12.41 | |
| Primer provided for intronless genes | 2325 | 99.96 | 12.41 | |
| RefSeq genes | 18 737 | 100.00 | ||
| Total genes with primer design | 18 733 | 99.98 | ||
Figure 1.
Web input interface for qPrimerDepot (see text).
Figure 2.
Web output interface for qPrimerDepot (see text).
To experimentally evaluate the primer quality, 288 genes were arbitrarily selected from a list of genes known to function in the immune response. 288 primer sets were retrieved from the database and synthesized in 96-well plates. Universal human reference RNA was reverse transcribed and used as template in PCR to examine the quality of the primers.
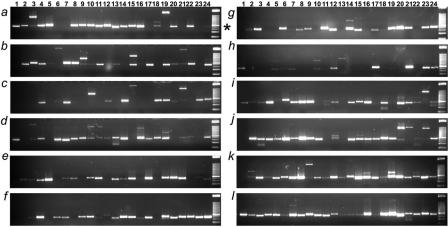
Given the variation of transcript abundance, melting curve analysis followed by gel electrophoresis has been suggested to verify RT-PCR products (6). Melting curve analysis revealed that 94.1% generate unique product. Visualization by the less sensitive ethidium bromide stain shows that >70% of the primer sets produce an amplicon of the correct molecular weight that will amplify and be detected as a single species by quantitative PCR (Figure 3). Several of the failures detected by gel electrophoresis are likely due to very low abundance transcripts in the universal RNA, imperfect primer design, unanticipated high secondary mRNA structure, or erroneous exon annotation in UCSC Genome Browser. Approximately 88.5% of primer sets produced no product in the absence of reverse transcriptase and the remaining sets produced detectable product only beyond 34 cycles of amplification possibly, due to primer dimers.
Figure 3.
Validation of pPrimerDepot primer sets on 3% ethidium bromide stained agarose/acrylamide (3:1) gels after 38 cycles of amplification. Asterisk indicates 125 bp size marker.
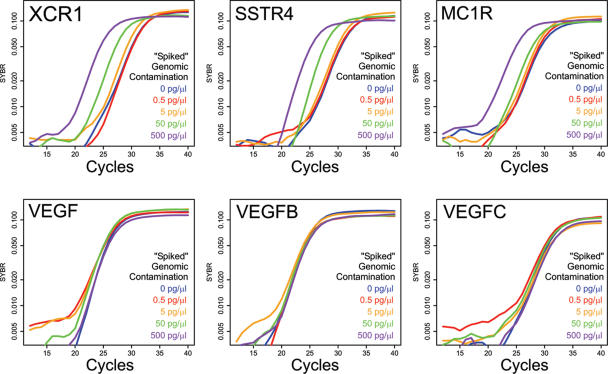
The resistance of most qPrimerDepot primer sets to contaminating input genomic DNA is illustrated in Figure 4. Here the real-time amplification profiles of three intron-bearing genes (VEFG,VEGFB and VEGFC) was compared to that of three non intron-bearing genes (XCR1, SSTR4 and MC1R) after challenge with increasing concentrations of contaminating genomic DNA (0.5–500 pg/μl). As demonstrated in Figure 4, all three intron-bearing genes show robust resistance to >500 pg/μl of input genomic DNA. This is in stark contrast to the three non intron-bearing genes where as little as 5 pg/μl produces a significant false signal.
Figure 4.
Real-time PCR amplification profiles generated using qPrimerDepot primer sets for non intron-bearing (XCR1, SSTR4, MC1R) and intron-bearing (VEFG, VEGFB, VEGFC) genes compared after the addition of increasing amounts of contaminating genomic DNA.
CONCLUSION
Taking advantage of the intron/exon inventory of RefSeq genes and Primer3, a paradigm primer design tool, we designed primers which are contamination resistant for 99% of human and mouse RefSeq genes (Table 1). Since the majority of the primer sets will amplify desired templates under unified annealing temperatures, high throughput multiplex analysis is achievable at a reasonable cost. Empirical screening and validation of primer set performance conservatively suggests that 70–90% of the primer set designs are likely to perform effectively ‘right out of the box’ with no need to adjust the conditions of amplification. Therefore, qPrimerDepot is a valuable resource for qRT applications, especially in those circumstances requiring high throughput detection of rare transcripts in curated and/or patient-derived samples that often contain unavoidable contamination with genomic DNA.
Acknowledgments
This project has been supported by funds from the Intramural Research Program of the NIH, National Cancer Institute, Centers for Cancer Research and the National Institute on Aging. Funding to pay the Open Access publication charges for this article was provided by the Intramural Research Program of the NIH, National Cancer Institute, Centers for Cancer Research.
Conflict of interest statement. None declared.
REFERENCES
- 1.Walker N.J. A technique whose time has come. Science. 2002;296:557–559. doi: 10.1126/science.296.5567.557. [DOI] [PubMed] [Google Scholar]
- 2.Kitlinska J., Wojcierowski J. RNA isolation from solid tumor tissue. Anal. Biochem. 1995;228:170. doi: 10.1006/abio.1995.1331. [DOI] [PubMed] [Google Scholar]
- 3.Bustin S.A. Quantification of mRNA using real-time reverse transcription PCR (RT–PCR): trends and problems. J. Mol. Endocrinol. 2002;29:23–39. doi: 10.1677/jme.0.0290023. [DOI] [PubMed] [Google Scholar]
- 4.Shaffer C. PCR gains momentum with new applications. Genetic Engineering News. 2005;25:24–29. [Google Scholar]
- 5.Bustin S.A. Absolute quantification of mRNA using real-time reverse transcription polymerase chain reaction assays. J. Mol. Endocrinol. 2000;25:169–193. doi: 10.1677/jme.0.0250169. [DOI] [PubMed] [Google Scholar]
- 6.Ausubel F.M., Brent R., Kingston R.E., Moore D.D., Seidman J.G., Smith J.A., Struhl K. New York: John Wiley & Sons; 2005. Current protocols in molecular biology. [Google Scholar]
- 7.Pattyn F., Speleman F., De Paepe A., Vandesompele J. RTPrimerDB: the Real-Time PCR primer and probe database. Nucleic Acids Res. 2003;31:122–123. doi: 10.1093/nar/gkg011. [DOI] [PMC free article] [PubMed] [Google Scholar]
- 8.Pattyn F., Robbrecht P., De Paepe A., Speleman F., Vandesompele J. RTPrimerDB: the real-time PCR primer and probe database, major update. Nucleic Acids Res. 2006;34:D684–D688. doi: 10.1093/nar/gkj155. [DOI] [PMC free article] [PubMed] [Google Scholar]
- 9.Wang X., Seed B. A PCR primer bank for quantitative gene expression analysis. Nucleic Acids Res. 2003;31:e154. doi: 10.1093/nar/gng154. [DOI] [PMC free article] [PubMed] [Google Scholar]
- 10.Jurka J. Repbase Update: a database and an electronic journal of repetitive elements. Trends Genet. 2000;16:418. doi: 10.1016/s0168-9525(00)02093-x. [DOI] [PubMed] [Google Scholar]
- 11.Bedell J.A., Korf I., Gish W. MaskerAid: a performance enhancement to RepeatMasker. Bioinformatics. 2000;16:1040–1041. doi: 10.1093/bioinformatics/16.11.1040. [DOI] [PubMed] [Google Scholar]
- 12.Rozen S., Skaletsky H. Primer3 on the WWW for general users and for biologist programmers. Methods Mol. Biol. 2000;132:365–386. doi: 10.1385/1-59259-192-2:365. [DOI] [PubMed] [Google Scholar]
- 13.Altschul S.F., Gish W., Miller W., Myers E.W., Lipman D.J. Basic local alignment search tool. J. Mol. Biol. 1990;215:403–410. doi: 10.1016/S0022-2836(05)80360-2. [DOI] [PubMed] [Google Scholar]
- 14.Wang X., Seed B. Selection of oligonucleotide probes for protein coding sequences. Bioinformatics. 2003;19:796–802. doi: 10.1093/bioinformatics/btg086. [DOI] [PubMed] [Google Scholar]
- 15.Tatusova T.A., Madden T.L. BLAST 2 S, a new tool for comparing protein and nucleotide sequences. FEMS Microbiology Lett. 1999;174:247–250. doi: 10.1111/j.1574-6968.1999.tb13575.x. [DOI] [PubMed] [Google Scholar]


