Abstract
Natural antisense transcripts (NATs) are reverse complementary at least in part to the sequences of other endogenous sense transcripts. Most NATs are transcribed from opposite strands of their sense partners. They regulate sense genes at multiple levels and are implicated in various diseases. Using an improved whole-genome computational pipeline, we identified abundant cis-encoded exon-overlapping sense–antisense (SA) gene pairs in human (7356), mouse (6806), fly (1554), and eight other eukaryotic species (total 6534). We developed NATsDB (Natural Antisense Transcripts DataBase, http://natsdb.cbi.pku.edu.cn/) to enable efficient browsing, searching and downloading of this currently most comprehensive collection of SA genes, grouped into six classes based on their overlapping patterns. NATsDB also includes non-exon-overlapping bidirectional (NOB) genes and non-bidirectional (NBD) genes. To facilitate the study of functions, regulations and possible pathological implications, NATsDB includes extensive information about gene structures, poly(A) signals and tails, phastCons conservation, homologues in other species, repeat elements, expressed sequence tag (EST) expression profiles and OMIM disease association. NATsDB supports interactive graphical display of the alignment of all supporting EST and mRNA transcripts of the SA and NOB genes to the genomic loci. It supports advanced search by species, gene name, sequence accession number, chromosome location, coding potential, OMIM association and sequence similarity.
INTRODUCTION
Recent studies showed that not only prokaryotic, but also eukaryotic genomes contain abundant genes that at least partially overlap with another gene encoded by the opposite strand at the same genomic loci (1–9). If the overlap involves exonic regions of both genes, they are defined as cis-encoded natural antisense transcripts (cis-NATs) and the pairs are named sense–antisense (SA) gene pairs; otherwise, the pairs are named non-exon-overlapping bidirectional (NOB, or exon–intron overlapping) gene pairs; if the transcripts at a genomic locus are derived from the same strand, they are called non-bidirectional (NBD) transcripts (6,8). NATs have long been known to be involved in gene expression regulations in prokaryotic cells (1,2). In the past 10 years they have also been found to play multiple roles in eukaryotic gene regulation, such as X-inactivation, genomic imprinting, alternative splicing, RNA stability, transport and translational regulation (3–5). Abnormal changes of antisense transcription have been associated with serious diseases such as cancer and schizophrenia (7,10,11). NOB transcripts have been suggested to play roles in the regulation of pre-mRNA processing and have possible pathological associations (12,13).
Whole-genome searches have identified thousands of SA gene pairs in mammals (6,14,15), and hundreds in fly (6,16), worm (6,17) and plants (18,19). We recently developed a computational pipeline to identify SA and NOB gene pairs in 10 species, the most comprehensive collection at the time (6). Two key steps in the pipeline were the reliable mapping of the expressed sequence tag (EST) and mRNA transcripts to genomic sequences and the correct determination of the transcription orientation of ESTs. Here, we report an improved pipeline that imposes more stringent quality control filter on EST-to-genome mapping and uses more evidence to infer the transcript orientation of ESTs. We used the pipeline to identify over 50% more SA and NOB gene pairs in 11 species, including human, mouse, fly, worm, sea squirt, chicken, rat, frog, zebrafish, cow and dog, resulting in the largest collection of SA to date (for details see the next section).
The importance and abundance of SA and NOB gene pairs requires a database system for efficient storage, retrieval and display. However, current databases, SADB (http://fantom31p.gsc.riken.jp/s_as/), Sense/Antisense Database (http://bistro.mscs.mu.edu/antisense/index.cgi) and LEADS-Antisensor (http://www.labonweb.com/cgi-bin/antisense/AS.cgi), are inadequate for several reasons. SADB includes only SA and NOB genes in mouse, last updated in February 2005. SADB Database includes only human and mouse SA genes and LEADS-Antisensor includes only human SA genes, both of which have not been updated since 2003 and do not include NOB genes. None of the existing databases includes other important species and their collection of SA and NOB genes is limited. Furthermore, their annotation and graphical display of the antisense transcripts is limited.
Based on the significantly enlarged set of SA and NOB genes we identified in 11 genomes, we developed NATsDB (Natural Antisense Transcripts DataBase, http://natsdb.cbi.pku.edu.cn/), updated quarterly. NATsDB includes extensive annotations and hyperlinks to external databases. It allows users to study whether their gene of interest has antisense transcripts, whether there is sufficient supporting evidence of the transcript orientation, such as splicing sites, poly(A) signals and tails, what is the exact overlapping pattern, whether they are conserved across different species and what is the expression profile of the sense and antisense genes. This multiple-species, highly annotated database can facilitate the study of the function, conservation, and evolution of SA and NOB genes.
IMPROVED PIPELINE TO IDENTIFY SA AND NOB GENE PAIRS
We recently reported a rapid pipeline to identify SA pairs based on UniGene sequences (20) and GoldenPath (21) chromosome mapping data (6). In short, we filtered the GoldenPath genome mapping data to determine the exact chromosomal coordinates of mRNAs or ESTs. Because many ESTs have been known to be mis-oriented, we combined multiple evidence to infer the correct orientation for mRNAs and ESTs, including sequence type (mRNA or EST), CDS annotation, poly(A) signal/tail and consensus splicing junctions. Based on the genomic coordinates, we then grouped the orientation-reliable sequences into SA, NOB, and NBD clusters and selected representative sequences within each cluster to remove redundancy. Finally, we classified the SA gene pairs into six subtypes including ‘Convergent’ (3′–3′ or tail–tail overlap), ‘Divergent’ (5′–5′ or head–head overlap), ‘Complete’ (full overlap), ‘Contained’, ‘Intronic’ and ‘Others’.
Here we improved the above pipeline to further increase its accuracy and coverage. First, more stringent filtering of the GoldenPath mapping data was performed to retain higher-quality mRNA/EST mapping to the genomic sequences. We required mapping length ≥150 bp, identity ≥96%, coverage within mapping ≥97% and coverage within whole transcript ≥75%. If a transcript was mapped to multiple genomic loci, only the best mapping was retained; if more than one nearly identical best mapping existed (difference in BLAT scores <5%), the transcript was discarded to avoid ambiguity. We also discarded transcripts that were mapped to somatic DNA recombination hotspots of the immunoglobulin or T-cell receptor in the international ImMunoGeneTics information system (IMGT) (22) because of the difficulty to infer the exact genomic location of these genes.
Second, we kept our previous pipeline to infer the transcription orientation for mRNAs and spliced ESTs (6), while adopting the strategy by Engstrom et al. (15) for unspliced ESTs. First, if an unspliced EST had a poly(A) [or poly(T)] tail, then its orientation was determined to be the original (or the opposite) orientation. Second, if its standard poly(A) signal agreed with its direction annotation, it was considered to have the correct orientation. Third, if it came from an ‘orientation reliable’ EST library as defined below, it was considered to have the correct orientation. For each EST library, we determined the orientation of spliced ESTs and compared it with their direction annotation, i.e. 3′ sequencing or 5′ sequencing. If the proportion of spliced ESTs with correct direction annotation in a library was >99% at the 99% confidence level, the library was considered ‘orientation reliable’ and the direction annotation of the unspliced ESTs in the library was adopted. Engstrom et al. (15) proved that such combination of evidences was reliable and sensitive to infer the orientation of unspliced ESTs. For our human dataset, 1 139 001 (50%) of unspliced ESTs could be assigned orientation using this strategy whereas only 317 846 (14%) could have been assigned orientation using our previous pipeline (6).
Using this improved pipeline we identified 7356 SA pairs in human, 6806 SA pairs in mouse, 1607 in rat, 1554 in fly, and hundreds of each in worm, sea squirt, chicken, frog, zebrafish, cow and dog. We also identified thousands of NOB pairs. The statistics is shown in Table 1. We compared the mouse SA dataset in NATsDB with that in SADB, using the cross-reference information available on FANTOM3's FTP site to map clone IDs to accession numbers. We found that 89.8% of the SA loci in SADB could be mapped to <50% of mouse SA clusters in NATsDB. Thus despite using different transcript datasets and genome assemblies, NATsDB was able to cover the majority of SADB. At the same time, NATsDB covers 50% more new data for mouse as well as data for 10 other species not included in SADB.
Table 1.
Input data source and content statistics of NATsDB
| Species | UniGene build version | GoldenPath genome version | Number of orientation reliable sequences mapped on to exact genomic location | Percentage of mRNAs + Spliced ESTs (%) | Number of SA clusters | Number of NOB clusters | Number of NBD clusters | Percentage of SA genesa(%) | Average overlap length of SA pairs |
|---|---|---|---|---|---|---|---|---|---|
| Human | 193 | hg18 | 4 494 665 | 74.7 | 7356 | 1296 | 18 863 | 40.7 | 345 |
| Mouse | 155 | mm8 | 2 100 305 | 81.3 | 6806 | 821 | 18 019 | 40.9 | 355 |
| Rat | 154 | rn4 | 463 787 | 61.6 | 1607 | 726 | 28 463 | 9.7 | 229 |
| Fly | 44 | dm2 | 310 319 | 86.5 | 1554 | 352 | 8311 | 25.6 | 290 |
| Sea squirt | 18 | ci2 | 414 454 | 89.4 | 993 | 176 | 10 862 | 15.0 | 254 |
| Cow | 77 | bosTau2 | 536 939 | 80.1 | 866 | 291 | 22 640 | 6.9 | 221 |
| Frog | 29 | xenTro2 | 630 019 | 75.9 | 830 | 259 | 22 305 | 6.8 | 312 |
| Chicken | 30 | galGal2 | 299 931 | 74.0 | 873 | 202 | 17 067 | 9.1 | 266 |
| Zebrafish | 91 | danRer4 | 522 259 | 87.5 | 593 | 303 | 20 483 | 5.3 | 306 |
| Worm | 28 | ce2 | 291 395 | 87.5 | 470 | 315 | 17 910 | 4.8 | 116 |
| Dog | 15 | canFam2 | 203 772 | 75.8 | 302 | 213 | 15 112 | 3.7 | 152 |
aPercentage of SA genes = 2*‘Number of SA Clusters’/(2*‘Number of SA Clusters’ + 2*‘Number of NOB Clusters’ + ‘Number of NBD Clusters’).
INTERACTIVE WEB INTERFACE FOR BROWSING AND SEARCH
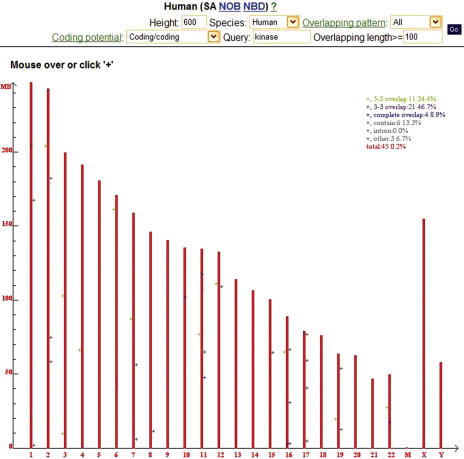
Users can browse NATsDB by cluster type (SA, NOB or NBD), species and genomic location. They can also limit the selection by the six classes of SA overlapping patterns, minimum overlapping length, coding potential of the genes involved and UniGene description of the transcripts (Figure 1). NATsDB intersects all the criteria and shows the corresponding genomic loci.
Figure 1.
The browser interface of NATsDB: Limited by the criteria specified by the user in the top part of the page, the browser marks on the human chromosomes all SA pairs that involve coding genes on both strands, at least one of which has ‘kinase’ in its description, with overlapping length ≥100 bp. The x-axis of the figure at the bottom of the page shows the chromosomes. ‘+’ signs marked on the chromosome in different colors denote different classes of SA pairs.
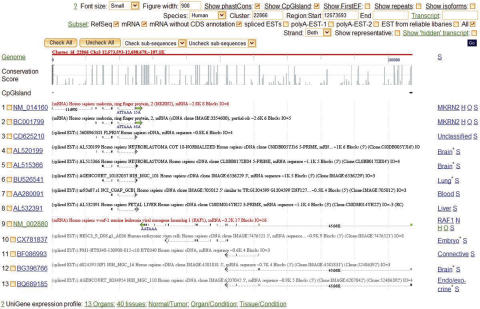
To display each SA, NOB or NBD cluster, we implemented an interactive web interface using PHP (http://www.php.net/) and GD (http://www.boutell.com/gd/) graphical library. The graphical browser displays the alignment of all transcripts to the genomic sequence to show the overlapping patterns (for SA and NOB). Figure 2 shows one known SA pair in human, MKRN2/RAF1 (23). By default only the representative sequences are shown, as some genomic loci may have hundreds or even thousands of known mRNA and EST transcripts, but users can choose to view all transcripts. Users can also interactively select subsets of transcripts for display using combinations of several criteria including RefSeq (24) mRNAs, spliced ESTs, polyadenlyated ESTs, and/or transcripts from plus, minus or both of the strands.
Figure 2.
Loci browser showing human SA gene pair, MKRN2/RAF1: The control panel on top allows users to interactively select all or subsets of all sequences. Below the control panel, the browser displays, from top to bottom, the chromosome coordination (‘Genome’), phastCons conservation score (‘Conservation Score’), selected supporting mRNA/EST sequences with representative sense and antisense transcripts marked in red, and links to expression profiles of the ESTs. Gene name, tissue information, Homologene link, OMIM link and sequence link appear on the right-hand side of each transcript. For more details, please refer to http://natsdb.cbi.pku.edu.cn/nats_help.php.
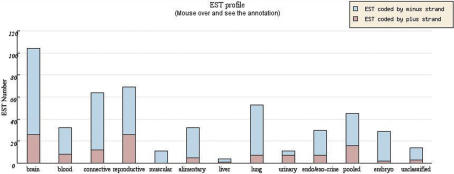
The loci browser also displays several types of important information about the transcripts and hyperlinks to external databases such as GoldenPath (21), Homologene (20), BodyMap-Xs (25) and OMIM (26). Exon/intron structure, poly(A) signals and tails, CpG island and First Exon prediction (27) are shown to support the transcript's orientation. The single-nucleotide phastCons conservation scores (28) were imported from GoldenPath so that users can visually check the difference in conservation between overlapping and non-overlapping regions which might indicate biological significance of the pairing between sense and antisense transcripts (15). If an ‘H’ appears at the right end of a transcript line, it can be clicked to open a list of homologous genes, if any, in the other 11 species, cross-reference by Homologene (20). Expression profiling of the SA and NOB gene pairs may provide important information about the pairs' interaction. We used data in BodyMap-Xs (25) to profile the expression of transcripts in NATsDB across 13 organs, 40 tissues and normal versus pathological conditions (Figure 3). Finally, a hyperlink to OMIM, denoted by ‘O’, appears at the right end of a transcript line if the gene has been previously linked to disease.
Figure 3.
Expression profile of MKRN2/RAF1 is shown as bar plot, based on all spliced ESTs derived from the plus strand (MKRN2) and minus strand (RAF1) of this genomic locus. Users could change the criteria in the control panel on the loci page to select any other subsets of ESTs to profile the sense and antisense genes, such as only polyadenylated ESTs [with poly(A) tail or signal].
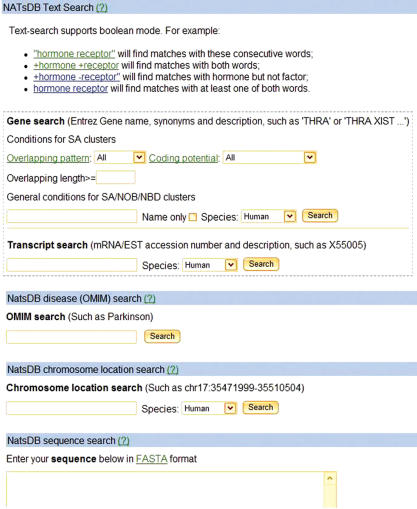
We implemented several search options in NATsDB (Figure 4). Boolean operators are supported for all text searches. Users can search for genes with Entrez Gene names, synonyms, and descriptions given the conditions including overlapping pattercoding potential and minimum overlapping length of representative SA pairs, or search for transcripts with mRNA/EST accession numbers or descriptions. They can search for genes in NATsDB that are listed in OMIM to be involved in disease(s). Users can also specify a genomic location and retrieve all SA/NOB/NBD clusters in that region. Finally, users can search NATsDB using BLAST (Blastn, Tblastn or Tblastx) to find SA/NOB/NBD sequences similar to the query sequence of their interest.
Figure 4.
The search interface of NATsDB NATsDB supports multiple search methods including free text search, OMIM disease search, chromosomal location search and BLAST sequence search.
Data in NATsDB are stored in a MySQL 5.0 (http://www.mysql.com/) relational database, which comprises 80 tables and requires ∼20 GB of storage. MySQL indexes were extensively created to speed up online query. All the representative SA and NOB pairs are free to download. We will continue to maintain NATsDB with a major update every quarter. Similar to Ensembl (29), we archive older releases and make them accessible for users.
DISCUSSION
Although genome browsers such as GoldenPath (21) and Ensembl (29) can display a specific genomic locus with cDNAs and ESTs aligned to it, users interested in the study of antisense transcription would need to know a priori which loci to open or manually check each locus one by one to find SA and NOB pairs. Thus despite the tremendous general utility of GoldenPath and Ensembl, databases such as NATsDB are necessary for the study of antisense beyond single-gene scale. NATsDB also displays other features not available in the general browsers such as poly(A)/poly(T) signals and tails. As more EST and genomic sequence data become available, we will continue to enrich NATsDB with more SA/NOB pairs in more species.
Acknowledgments
We thank the two anonymous reviewers for insightful suggestions. We thank Drs Shunong Bai and Zicai Liang for helpful discussions, Dr Osamu Ogasawara of DDBJ for support of BodyMap-Xs, and Shuqi Zhao and Ying Sun of Center for Bioinformatics for maintenance of computing resources. This work was supported by China Ministry of Science and Technology High Tech 863 Programs, China Ministry of Education ‘Program for New Century Excellent Talents in University’ and the NIH Intramural Research Program, NIDA, DHSS. Funding to pay the Open Access publication charges for this article was provided by China Ministry of Education ‘Program of Introducing Talents of Discipline to Universities’ (B06001).
Conflict of interest statement. None declared.
REFERENCES
- 1.Wagner E.G., Simons R.W. Antisense RNA control in bacteria, phages, and plasmids. Annu. Rev. Microbiol. 1994;48:713–742. doi: 10.1146/annurev.mi.48.100194.003433. [DOI] [PubMed] [Google Scholar]
- 2.Rogozin I.B., Spiridonov A.N., Sorokin A.V., Wolf Y.I., Jordan I.K., Tatusov R.L., Koonin E.V. Purifying and directional selection in overlapping prokaryotic genes. Trends Genet. 2002;18:228–232. doi: 10.1016/s0168-9525(02)02649-5. [DOI] [PubMed] [Google Scholar]
- 3.Vanhee-Brossollet C., Vaquero C. Do natural antisense transcripts make sense in eukaryotes? Gene. 1998;211:1–9. doi: 10.1016/s0378-1119(98)00093-6. [DOI] [PubMed] [Google Scholar]
- 4.Carmichael G.G. Antisense starts making more sense. Nat. Biotechnol. 2003;21:371–372. doi: 10.1038/nbt0403-371. [DOI] [PubMed] [Google Scholar]
- 5.Borsani O., Zhu J., Verslues P.E., Sunkar R., Zhu J.K. Endogenous siRNAs derived from a pair of natural cis-antisense transcripts regulate salt tolerance in Arabidopsis. Cell. 2005;123:1279–1291. doi: 10.1016/j.cell.2005.11.035. [DOI] [PMC free article] [PubMed] [Google Scholar]
- 6.Zhang Y., Liu X.S., Liu Q.-R., Wei L. Genome-wide in silico identification and analysis of cis natural antisense transcripts (cis-NATs) in ten species. Nucleic Acids Res. 2006;34:3465–3475. doi: 10.1093/nar/gkl473. [DOI] [PMC free article] [PubMed] [Google Scholar]
- 7.Lavorgna G., Dahary D., Lehner B., Sorek R., Sanderson C.M., Casari G. In search of antisense. Trends Biochem. Sci. 2004;29:88–94. doi: 10.1016/j.tibs.2003.12.002. [DOI] [PubMed] [Google Scholar]
- 8.Chen J., Sun M., Kent W.J., Huang X., Xie H., Wang W., Zhou G., Shi R.Z., Rowley J.D. Over 20% of human transcripts might form sense–antisense pairs. Nucleic Acids Res. 2004;32:4812–4820. doi: 10.1093/nar/gkh818. [DOI] [PMC free article] [PubMed] [Google Scholar]
- 9.Yelin R., Dahary D., Sorek R., Levanon E.Y., Goldstein O., Shoshan A., Diber A., Biton S., Tamir Y., Khosravi R., et al. Widespread occurrence of antisense transcription in the human genome. Nat. Biotechnol. 2003;21:379–386. doi: 10.1038/nbt808. [DOI] [PubMed] [Google Scholar]
- 10.Korostishevsky M., Kaganovich M., Cholostoy A., Ashkenazi M., Ratner Y., Dahary D., Bernstein J., Bening-Abu-Shach U., Ben-Asher E., Lancet D., et al. Is the G72/G30 locus associated with schizophrenia? single nucleotide polymorphisms, haplotypes, and gene expression analysis. Biol. Psychiatr. 2004;56:169–176. doi: 10.1016/j.biopsych.2004.04.006. [DOI] [PubMed] [Google Scholar]
- 11.Korneev S., O'Shea M. Natural antisense RNAs in the nervous system. Rev. Neurosci. 2005;16:213–222. doi: 10.1515/revneuro.2005.16.3.213. [DOI] [PubMed] [Google Scholar]
- 12.Reis E.M., Louro R., Nakaya H.I., Verjovski-Almeida S. As antisense RNA gets intronic. Omics. 2005;9:2–12. doi: 10.1089/omi.2005.9.2. [DOI] [PubMed] [Google Scholar]
- 13.Reis E.M., Nakaya H.I., Louro R., Canavez F.C., Flatschart A.V., Almeida G.T., Egidio C.M., Paquola A.C., Machado A.A., Festa F., et al. Antisense intronic non-coding RNA levels correlate to the degree of tumor differentiation in prostate cancer. Oncogene. 2004;23:6684–6692. doi: 10.1038/sj.onc.1207880. [DOI] [PubMed] [Google Scholar]
- 14.Kiyosawa H., Yamanaka I., Osato N., Kondo S., Hayashizaki Y. Antisense transcripts with FANTOM2 clone set and their implications for gene regulation. Genome Res. 2003;13:1324–1334. doi: 10.1101/gr.982903. [DOI] [PMC free article] [PubMed] [Google Scholar]
- 15.Engstrom P.G., Suzuki H., Ninomiya N., Akalin A., Sessa L., Lavorgna G., Brozzi A., Luzi L., Tan S.L., Yang L., et al. Complex loci in human and mouse genomes. PLoS Genet. 2006;2:e47. doi: 10.1371/journal.pgen.0020047. [DOI] [PMC free article] [PubMed] [Google Scholar]
- 16.Misra S., Crosby M.A., Mungall C.J., Matthews B.B., Campbell K.S., Hradecky P., Huang Y., Kaminker J.S., Millburn G.H., Prochnik S.E., et al. Annotation of the Drosophila melanogaster euchromatic genome: a systematic review. Genome Biol. 2002;3:RESEARCH0083. doi: 10.1186/gb-2002-3-12-research0083. [DOI] [PMC free article] [PubMed] [Google Scholar]
- 17.Chen N., Stein L.D. Conservation and functional significance of gene topology in the genome of Caenorhabditis elegans. Genome Res. 2006;16:606–617. doi: 10.1101/gr.4515306. [DOI] [PMC free article] [PubMed] [Google Scholar]
- 18.Osato N., Yamada H., Satoh K., Ooka H., Yamamoto M., Suzuki K., Kawai J., Carninci P., Ohtomo Y., Murakami K., et al. Antisense transcripts with rice full-length cDNAs. Genome Biol. 2003;5:R5. doi: 10.1186/gb-2003-5-1-r5. [DOI] [PMC free article] [PubMed] [Google Scholar]
- 19.Wang X.J., Gaasterland T., Chua N.H. Genome-wide prediction and identification of cis-natural antisense transcripts in Arabidopsis thaliana. Genome Biol. 2005;6:R30. doi: 10.1186/gb-2005-6-4-r30. [DOI] [PMC free article] [PubMed] [Google Scholar]
- 20.Wheeler D.L., Barrett T., Benson D.A., Bryant S.H., Canese K., Church D.M., DiCuccio M., Edgar R., Federhen S., Helmberg W., et al. Database resources of the National Center for Biotechnology Information. Nucleic Acids Res. 2005;33:D39–D45. doi: 10.1093/nar/gki062. [DOI] [PMC free article] [PubMed] [Google Scholar]
- 21.Karolchik D., Baertsch R., Diekhans M., Furey T.S., Hinrichs A., Lu Y.T., Roskin K.M., Schwartz M., Sugnet C.W., Thomas D.J., et al. The UCSC Genome Browser Database. Nucleic Acids Res. 2003;31:51–54. doi: 10.1093/nar/gkg129. [DOI] [PMC free article] [PubMed] [Google Scholar]
- 22.Lefranc M.P., Giudicelli V., Kaas Q., Duprat E., Jabado-Michaloud J., Scaviner D., Ginestoux C., Clement O., Chaume D., Lefranc G. IMGT, the international ImMunoGeneTics information system. Nucleic Acids Res. 2005;33:D593–D597. doi: 10.1093/nar/gki065. [DOI] [PMC free article] [PubMed] [Google Scholar]
- 23.Gray T.A., Azama K., Whitmore K., Min A., Abe S., Nicholls R.D. Phylogenetic conservation of the makorin-2 gene, encoding a multiple zinc-finger protein, antisense to the RAF1 proto-oncogene. Genomics. 2001;77:119–126. doi: 10.1006/geno.2001.6627. [DOI] [PubMed] [Google Scholar]
- 24.Pruitt K.D., Maglott D.R. RefSeq and LocusLink: NCBI gene-centered resources. Nucleic Acids Res. 2001;29:137–140. doi: 10.1093/nar/29.1.137. [DOI] [PMC free article] [PubMed] [Google Scholar]
- 25.Ogasawara O., Otsuji M., Watanabe K., Iizuka T., Tamura T., Hishiki T., Kawamoto S., Okubo K. BodyMap-Xs: anatomical breakdown of 17 million animal ESTs for cross-species comparison of gene expression. Nucleic Acids Res. 2006;34:D628–D631. doi: 10.1093/nar/gkj137. [DOI] [PMC free article] [PubMed] [Google Scholar]
- 26.Hamosh A., Scott A.F., Amberger J., Bocchini C., Valle D., McKusick V.A. Online Mendelian Inheritance in Man (OMIM), a knowledgebase of human genes and genetic disorders. Nucleic Acids Res. 2002;30:52–55. doi: 10.1093/nar/30.1.52. [DOI] [PMC free article] [PubMed] [Google Scholar]
- 27.Davuluri R.V., Grosse I., Zhang M.Q. Computational identification of promoters and first exons in the human genome. Nature Genet. 2001;29:412–417. doi: 10.1038/ng780. [DOI] [PubMed] [Google Scholar]
- 28.Siepel A., Bejerano G., Pedersen J.S., Hinrichs A.S., Hou M., Rosenbloom K., Clawson H., Spieth J., Hillier L.W., Richards S., et al. Evolutionarily conserved elements in vertebrate, insect, worm, and yeast genomes. Genome Res. 2005;15:1034–1050. doi: 10.1101/gr.3715005. [DOI] [PMC free article] [PubMed] [Google Scholar]
- 29.Birney E., Andrews D., Bevan P., Caccamo M., Cameron G., Chen Y., Clarke L., Coates G., Cox T., Cuff J., et al. Ensembl 2004. Nucleic Acids Res. 2004;32:D468–D470. doi: 10.1093/nar/gkh038. [DOI] [PMC free article] [PubMed] [Google Scholar]


