

Abstract
Experiments were conducted on several synthetic and expressed peptides from the PEVK region of titin, the giant muscle protein. Different secondary structure prediction methods based on amino acid sequence gave estimates ranging from over 70% alpha helical to no helix (totally disordered) for the polyE peptide corresponding to human exon 115. Circular dichroism (CD) experiments demonstrated that both the positively charged PPAK modules and the negatively charged PolyE repeats had similar spectral properties with disordered secondary structure predominating. Gel permeation chromatography showed that both PPAK and polyE peptides had 2 to 4 times larger Stokes radii than expected from their molecular mass. Mixtures of the oppositely charged titin peptides caused no change in apparent secondary structure as observed by circular dichroism or migration properties using native gel electrophoresis. Similarly addition of calcium did not alter the CD spectra or peptide electrophoretic mobility of the individual peptides or their mixtures. The properties of both the PPAK and polyE type peptides suggest that both had most of the characteristic properties to be classified as intrinsically disordered proteins.
Keywords: titin, muscle, circular dichroism, native electrophoresis, ionic interaction, secondary structure prediction, intrinsically disordered proteins
Introduction
Titin, also known as connectin, is the giant rubber like protein spanning half of the sarcomere in striated muscle. It has multiple functions including sarcomere assembly, sarcomere stability maintenance [1], passive tension generation [2, 3] and serine/threonine kinase activity [4,5]. The over 3 million Dalton molecular weight makes it the largest protein in nature. Much of its molecular structure is composed of around 300 repeats of two types — immunoglobin and fibronectin III [6,7]. A series of 45-amino acid repeats was also found in the Z-line region [8]. In addition, serine-proline repeats (taken as the potential phosphorylation sites) have been found in both titin's amino [9] and carboxyl termini [10]. I-band titin, which connects the Z-line and the A-band region of titin, contains three serial-linked motifs from amino-terminal to carboxy-terminal: the folded Ig domains, the unique PEVK motif which has around 75% of its amino acid residues formed by proline (P), glutamic acid (E), valine (V) and lysine (K), and the N2 inserts [7]. The length of the PEVK segment is correlated with the sarcomere elongation ability; hence it is believed that this part of titin is a major region of the protein's elasticity [7].
It has been assumed that the PEVK segment is a random coil with little regular secondary structure, and the entropy based worm-like-chain would explain the elastic mechanism [11-13]. Other work focusing on the conformation of PEVK peptides has suggested that this region may contain some secondary structure [14-18]. Two types of repeat domains have been identified in the PEVK region [17]. PPAK, the 26-28 residue repeat named for the four amino acids that often constitute the beginning of the motif, occurs in groups of 2-12, and these regions are separated by polyE motifs, composed of approximately 45% glutamic acid (E). The PPAK motifs constitute 75% of the amino acid number and the polyE motifs occupy the remainder of the soleus PEVK sequence. Shorter PEVK regions occur in other muscles; the shortest occurs in the cardiac N2B with less than 200 amino acids, all of the PPAK type [7]. Interestingly, the pI values fluctuate between ∼10 for the PPAK domains and ∼3-4 for the polyE domains. These regular alternating modules with opposite charge suggest there may be ionic interaction between these segments [17].
The purpose of the current work was two fold: (1) to determine the secondary structure of the polyE domains from the titin PEVK and (2) to test for interaction between the oppositely charged PPAK and polyE domains. A 28 residue PPAK peptide (P28) and 2 polyE peptides (P19 and P12) have been chemically synthesized. In addition PEVK peptides E115 (exon 115 domain, polyE type), E137 (exon 137 domain, polyE type) and E112-114 (exons 112-114, three PPAK type modules linked together) have been expressed and purified from E coli. The P28 peptide was selected as being the most similar to the PPAK consensus sequence [17]. The E115 and E137 were chosen since the former is the largest polyE peptide and the latter is commonly found in cardiac titin from humans, rats, and dogs [19]. Also the E112-114 PPAK module has been found in virtually all PEVK clones from the same species [19]. Individual and various combinations of the oppositely charged peptides have been examined using circular dichroism and native gel electrophoresis techniques.
Materials and methods
RNA isolation, cDNA synthesis, and PCR cloning
Frozen human left ventricle was pulverized in liquid nitrogen and the RNA isolated using TRIZOL Reagent (Invitrogen Life Technologies, Carlsbad, CA). The concentration and purity of the isolated RNA was determined by spectrophotometry at wavelengths of 260 and 280 nm. RNA was stored at −80°C. The cDNA synthesis was conducted using the thermoscript RT-PCR system (Invitrogen, Carlsbad, CA). The cDNA was primed using random hexamers at 50°C for 50 minutes. After transcription, RNA was digested with RNase H at 37°C for 20 minutes. Three coding regions representing titin exon 112-114, exon 115, and exon 137 were obtained from human cDNA by PCR using Taq polymerase (Invitrogen, Carlsbad, CA) with pairs of oligonucleotide primers that include added enzyme restriction sites in both sense and antisense primers. Primers for E115 (the polypeptide coded by exon 115), E112-114(the polypeptide coded by exon 112-113-114) and E137 (the protein coded by exon 137) were designed based on the human titin gene sequence (GenBank Accession number AJ277892) and are listed in Table 1.
Table 1.
Primers used and predicted amplicon size (S, sense; AS, antisense)
| Protein | Primer sequence | Amplicon size (bp) | |
|---|---|---|---|
| S | 5′-CTTTTCCCGGATCCATCCCTCCTGTGGTTGC-3′ | ||
| E112-114 | 231 | ||
| AS | 5′-CGCCCTCGAGTCATTATTTTGCTGGAATTAAGGTAGTAG-3′ | ||
| S | 5′-GAGGCCATGGTCCCTGAAATCATTGATGTA-3′ | ||
| E115 | 424 | ||
| AS | 5′-GGGACTCGAGTTCATAGACCTCCTTTTGAA-3′ | ||
| S | 5′-GCCGCGGATCCGTAACTATAATGGAAGAGAAAG-3′ | ||
| E137 | 225 | ||
| AS | 5′-CCGGCTCGAGTGTGATGTATTCTTCATGC-3′ | ||
The pGEX-6P-1 vector (Amersham Phamacia Biotech, GE Health, Piscataway, NJ) was double digested with NcoI and the XhoI, and the pET-28b(+) (Novagen, Madison, WI) vector was double digested with BamHI and XhoI. The digestion products were run on a 1% gel, and the major fragment of each vector was reclaimed and purified with a gel extraction kit (Qiagen, Valencia, CA).
The human cDNA was denatured at 94 °C for 4 min; then Taq polymerase was added for 30 cycles of PCR with 30 sec denaturation, 30 sec of annealing at 55 °C, and 30 sec of extension at 72 °C. The PCR products were electrophoretically separated on 1.5% agarose gels containing ethidium bromide. Target bands were then recovered and purified with a gel extraction kit (Qiagen, Valencia, CA). Then the PCR product of E115 was restriction digested with NcoI and XhoI and ligated into pET-28b(+) which had previously been digested with the same restriction enzymes. The products of E137 and E112-114 were inserted in the pGEX-6P-1 vector via the 5' BamHI site from the sense primer and the 5' XhoI site from the antisense primer. The recombined plasmids of E115 were initially transferred to the E. coli DH5α strain; plasmids with E137 and E112-114 inserts were transferred to E. coli JM105 for clone screening and maintenance. Plasmids were purified using Qiagen kits, and clones were screened by restriction digestion firstly and then by sequencing at the University of Wisconsin Biotechnology Center. Sequences were aligned with the Genbank sequence using DNAMAN. Clones with correct inserts were identified and plasmids transferred to the E. coli BL21(DE3)pLysS (Novagen, Madison, WI) strain for fusion protein expression.
Expression and Purification of the Fusion Proteins
A single colony of E. coli cells containing a recombinant pGEX-6p-1 plasmid was placed in 5 ml of 2 X YTA medium (Tryptone 16g/l, Yeast extract 10g/l, NaCl 5g/l, ampicillin 100μg/ml) and then incubated for 12-15 hours at 37°C with vigorous shaking. The culture was then diluted to 1:100 into fresh pre-warmed 2 X YTA medium and grown at 37°C with shaking (about 3 hours) until the A600 reached approximately 1.0. Next 100mM IPTG was added to the culture medium to a final concentration of 0.1 mM, and the culture was incubated overnight at room temperature. The culture was centrifuged at 7,700 × g for 10 minutes at 4°C to sediment the cells. The pellet was frozen at −20°C for at least 30 minutes to rupture the cell membranes. GST-tag fusion proteins (E137 and E112-114) and His-tag fusion proteins (E115) were purified according to Novagen (Madison, WI) protocols. The GST-tag was cleaved with PreScission Protease (Amersham Pharmacia Biotech, GE Health, Piscataway, NJ). E115 contains 144 amino acids including 2 extra amino acids from the vector at the amino terminus and two extras plus a 6 member histidine tag at the carboxyl end. The 72 amino acid E112-114 and the 73 amino acids E137 both have 5 extra amino acids at the amino end after the GST tag was cleaved.
Peptide Molecular Weight and Purity Confirmation
The purities of synthetic and expressed peptides were confirmed by matrix-assisted laser desorption ionization time-of-flight mass spectroscopy (MALDI-TOF). The three expressed human PEVK region peptides were estimated to be more than 95% pure as determined by 12% SDS-PAGE (Fig. 1).
Fig. 1.

SDS polyacrylamide gel of a molecular mass standard and purified human PEVK segments expressed in E .coli. Note that the E115 and E137 had significantly larger apparent molecular mass than values obtained by sequence calculation or mass spectrometry (see Table 2).
Sample Preparation for CircularDichroism Spectrometry
The peptides used in this study and some of their properties are listed in Table 2. One mg of each of the synthetic peptides (P12, P19 and P28) was placed on the top of 1 ml of the appropriate buffer (10mM or 50 mM potassium phosphate, pH 7.5) in a 1.5 ml Microfuge tubes. After 15 minutes, samples were mixed. Then these samples and the expressed peptides were dialyzed using Irradiated Membrane (MWCO 500, Spectra/Por) in the same buffer in which they were dissolved. Normally buffer was changed 4 times with the last change going overnight. After dialysis was completed, samples were filtered through 0.45 μm syringe driven filters (Millex-HV, Millipore); fifty ml of dialysis buffer was also filtered for later use in sample dilution.
Table 2.
Peptide properties.
| Protein | Calculated molecular mass (Da) | Size obtained from SDS gel (∼Da) | Residue number | pI | Amino acid sequence |
|---|---|---|---|---|---|
| P28 | 2984.66 | - | 28 | 9.88 | PPAKVPEVPKKPVPEKKVPVPAPKKVEA |
| P19 | 2237.40 | - | 19 | 3.47 | EVLPEEEEVLPEEEEVLPE |
| P12 | 1411.53 | - | 12 | 3.71 | EVLPEEEEVLPE |
| E112-114 | 7781.53 | <10,000 | 72 | 10.12 |
GPLGSIPPVVAPPIPLLLPTPEEKKPPPKRIEVTKKAVKKDAKKVVAKP KEMTPREEIVKKPPPPTTLIPAK |
| E115 | 17802.27 | 35,000 | 144 | 4.44 |
MVPEIIDVSSKAEEVKIMTITRKKEVQKEKEAVYEKKQAVHKEKRVFI ESFEEPYDELEVEPYTEPFEQPYYEEPDEDYEEIKVEAKKEVHEEWEED FEEGQEYYEREEGYDEGEEEWEEAYQEREVIQVQKEVYELEHHHHH H |
| E137 | 9282.63 | 15,000 | 73 | 3.91 |
GPLGSVTIMEEKERAYTLEEEAVSVQREEEYEEYEEYDYKEFEEYEPT EEYDQYEEYEEREYERYEEHEEYIT |
Amino acids appearing as bold characters come from the expression vectors.
Peptide Concentration Determination
Synthetic and expressed protein fragment concentrations were measured by assay of amino groups using a TNBS assay [20]. A 0.05 ml peptide sample or buffer and 0.5 ml 6% w/v H2SO4, 0.45 ml ddH2O were placed in 1 ml airtight vials (Spectra) and then mixed. Oxygen was flushed out with a light stream of nitrogen before firmly tightening the cap. The reaction mixture was incubated at 100–105°C for 12-15 hours. Acid in the samples was then neutralized with 6% w/v NaOH to pH 7.0. Two tenth ml of hydrolyzed peptides or glutamic acid standard samples were pipetted into 1.5 ml microfuge tubes. Two tenths ml freshly prepared bicarbonate solution (4%, w/v, pH 8.5) and 0.2 ml freshly prepared TNBS (2, 4, 6 trinitrobenzene 1-sulfonic acid, 0.05% (w/v)) were added with mixing. The mixtures were incubated at 42°C for 2 hours. Then 0.2 ml SDS (10% w/v) and 0.1 ml 1 N HCl were added. Samples were assayed in triplicate with the absorbance measured at 335 nm. Peptide concentrations were calculated assuming full reactivity with all the released alpha amino groups in the peptide (2 per lysine, 0 for proline, 1 for all others).
Circular Dichroism Measurements
All spectra were obtained in an Aviv 202 Circular Dichroism Spectrometer equipped with Igor Pro software (WaveMetrics) for data analysis. Quartz cells of 0.1 cm path were used. Spectra were recorded with a 1.0 nm bandwidth and resolution of 0.1 nm in the wavelength range from 190 to 260 nm; constant nitrogen flow was used to flush away oxygen. Spectra presented were obtained after subtracting values obtained with buffer alone. Content of different secondary structure was estimated using the CONTIN, SELCON, and CDSSTR methods [21].
Polyacrylamide Gel Electrophoresis
SDS gels (12%) were used to examine the purity of the expressed peptides [22]. Native gels (10%, no SDS) were run using an adaptation of the method of Fairbanks and coworkers [23]. Peptides were dialyzed in Tris-HCl (20mM, pH 7.5) and their concentration determined by TNBS assay described above. Different molar ratios of PPAK and polyE type peptides were mixed together either with 2 mM EDTA or with 1mM CaCl2 in the gels and electrophoresis buffers.
Gel Permeation Chromatography of Titin Peptides
Standard proteins (bovine serum albumin (Mr 66,000), ovalbumin (45,000), carbonic anhydrase (29,000), cytochrome c (12,400), and aprotinin (6,500) and the expressed titin peptides were applied individually to a 4.6mm × 250 mm TSK3000 column attached to a Waters 2795 HPLC. Proteins were eluted at a flow rate of 0.1 ml/min using 10 mM potassium phosphate buffer (pH 7.5) and detected with a Waters 2996 diode array (scanned from 205 to 400 nm). The titin peptide elution volumes were compared with standard proteins of known Stokes radius.
Results
Prediction of Peptide Secondary Structure
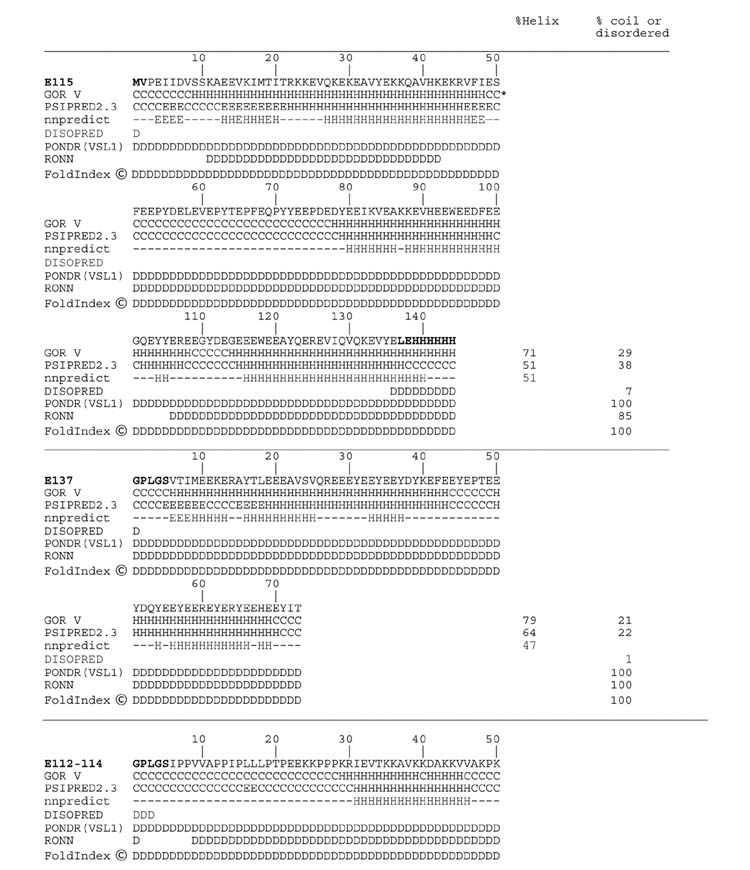
The protein secondary structure analysis programs GOR V [24], PSIPRED2.3 [25], nnpredict [26], DISOPRED [27], PONDR(VSL1) [28], RONN [29] and FoldIndex [30](all based on protein sequence) were applied in the current study (Table 3). The GOR, PSIPRED, and nnpredict methods predicted approximately 50 to 70% alpha helix content in the E115 and E137 expressed peptides. In contrast PONDR, RONN and FoldIndex, methods designed to identify disordered regions in proteins, predict that the same two peptides are 90 to 100% disordered. The results using DISOPRED indicated very limited disordered content. Structure predictions with the E112-114 peptide were more consistent; all programs except the DISOPRED indicated a predominance of random coil or disordered structure (Table 3). It is clear that these programs are inconsistent and several give serious errors in secondary structure prediction with the PEVK type peptides.
Table 3.

Multiple secondary structure predictions of the expressed titin PEVK peptides
Circular Dichroism study of secondary structure of PPAK type and polyE type peptides
Circular dichroism spectra were obtained on the synthetic and expressed peptides, and the raw data were converted to molar ellipticity. Several spectra are shown in Fig. 2 and Fig. 3. All the peptides had fairly similar patterns with each having major minimum in the region near 200 nm. A shoulder was evident in the 210 to 230 nm region for the P28 (Fig. 2) and E115 peptides (Fig. 3). In particular there was no evidence of alpha helical minima at 208 and 222 nm, the latter of which is more prominent. The positive band in the 225-235 nm region that is characteristic of polyproline II helix was also absent from all the PEVK peptide spectra.
Fig. 2.

Molar ellipticities of P28, P19 and P12. Conditions: 10 mM potassium phosphate, pH 7.5, 25° C.
Fig. 3.

Molar ellipticities of E112-114, E115 and E137. Conditions:10 mM potassium phosphate, pH 7.5, 25° C.
The program package CDPro [21] was used to estimate the approximate secondary structure proportions of α-helix, β-sheet, β-turn, PPII and unordered coils in the peptides. In all of the chemically synthesized and expressed peptides, unordered coils were the major secondary structure identified.
Effects of pH and temperature on peptide circular dichroism spectra
Spectra of the synthetic peptides were obtained under a variety of temperature and pH conditions in 100 mM potassium phosphate (Table 4). More negative values were observed for both the P28 (PPAK type) and P19 (polyE type) in the physiological pH range than in the acidic or basic regions. Also the values of the negative ellipticities were reduced with increasing temperatures. However, there was no evidence of any sharp transition with change in temperature or pH. Increasing the salt concentration to 500 mM KCl in 10 mM potassium phosphate reduced the minima values about 15% but did not affect the overall shape of the spectra (data not shown). The spectra in all cases were typical of proteins or peptides that are known to lack significant alpha helix or beta structure.
Table 4.
Effects of temperature and pH on circular dichroism ellipticity minima. Conditions:100 mM potassium phosphate, pH 7.5.
| Peptide-temperature[unk]pH | 4 | 5 | 6 | 7.5 | 9 | 10 |
|---|---|---|---|---|---|---|
| P28 5°C | - | −45512 | −42982 | −39147 | −39180 | - |
| P28 25°C | −34247 | −42719 | −39950 | −35039 | −36017 | −26819 |
| P28 45°C | −30945 | −38093 | −36452 | −30858 | −32429 | −23714 |
| P28 65°C | −27617 | −33949 | −32525 | −27059 | −29688 | −20182 |
| P19 5°C | −39720 | −48377 | −51449 | −44536 | −43707 | - |
| P19 25°C | −34851 | −42965 | −45423 | −38932 | −39788 | −30764 |
| P19 45° | −30766 | −37950 | −40116 | −34330 | −34830 | −27195 |
| P19 65°C | −27617 | −33851 | −34759 | −30038 | −29688 | −22815 |
Study of the interaction between PPAK type and polyE type peptides
Circular dichroism results were also obtained from mixtures of synthetic peptide samples in 10mM phosphate buffer. The single peptide samples of P12 (0.05 mM in 10mM KPO4, pH 7.5), P19 (0.05 mM in 10mM KPO4, pH 7.5) and P28 (0.04 mM in 10mM KPO4, pH 7.5) were measured with CD respectively at 25°C (Fig. 4). Also samples prepared from equal molar mixtures of P12 and P28 (0.025mM each in 10mM KPO4, pH 7.5), P19 and P28 (0.025mM each in 10mM KPO4, pH 7.5), and P12 and P19 (0.025mM each in 10mM KPO4, pH 7.5) were measured. If there is no intermolecular interaction that alters the structure of either peptide, then the measured ellipticity of the mixture should be the sum of the ellipticities of the single peptides with the same concentration in the mixture. The data presented in the figures were averages from three individual experiments. In the mixture of P19 and P28, the calculated minimum was at 198 nm with an ellipticity of −37.07 mdeg and the measured minimum was at 199 nm with an ellipticity of −36.10 mdeg. In the mixture of P12 and P28 (figure not shown), the calculated minimum was at 198 nm with the ellipticity of −31.32 mdeg and the measured minimum was at 199 nm with a molar ellipticity of −31.12 mdeg. The mixture of P19 and P12 (figure not shown) was used as a negative control since no interaction would be expected between the similarly charged peptides. The calculated minimum was at 198nm with a molar ellipticity of −27.35 mdeg and the measured minimum was at 199 nm with a molar ellipticity of −27.12 mdeg. From these data, there appeared to be insignificant secondary structure alteration whether or not the oppositely charged peptides (P19 and P28 or P12 and P28) formed putative complexes.
Fig. 4.

CD spectra of a mixture of 0.025 mM P19 and 0.025 mM P28. Conditions:10 mM potassium phosphate, pH 7.5, 25° C. “Math P19+P28” depicts the expected ellipticity from the two peptides measured individually if no structural change occurred due to an interaction.
CD experiments were also obtained from mixtures of synthetic peptides with expressed peptides and oppositely charged expressed peptides in 10 mM phosphate buffer (Table 5). The data is shown in Table 5 and the interaction between E112-114 and P19 is shown in Fig. 5. The potential interaction between E112-114 and P28 as a negative control is shown in Fig. 6. In each case the calculated and observed minima and ellipticity values were within the errors of the measurements. Thus no evidence for structural rearrangement was observed.
Table 5.
Results from PEVK region expressed fragment - synthetic peptide mixtures
| Peptides in the Sample (A+B) | Concentration of the Peptides (mM) | Wavelength Minima (nm) |
θ (mdeg) |
||
|---|---|---|---|---|---|
| Measured value | Calculated value | Measured value | Calculated value | ||
| E112-114 +P19 | 0.0025 | 199 | 199 | −6.40548 | −6.59282 |
| E112-114 + P28 | 0.003 | 200 | 200 | −9.25989 | −9.19196 |
| E115+P28 | 0.0015 | 199 | 200 | −9.27396 | −9.24156 |
| E115+P19 | 0.0015 | 200 | 200 | −8.81245 | −8.98144 |
| E137+P28 | 0.003 | 197 | 199 | −7.27662 | −7.54097 |
| E137+P19 | 0.003 | 199 | 197 | −8.34217 | −8.06494 |
Fig. 5.

CD spectra of a mixture of 0.0025 mM E112-114 and 0.0025 mM P19. Conditions:10 mM potassium phosphate, pH 7.5, 25° C. “Math E112-114 + P19” depicts the expected ellipticity (from mixtures of the two peptides measured individually) if no structural change occurred due to an interaction.
Fig. 6.

CD spectra for a mixture of 0.003 mM E112-114 plus 0.003 mM P28. Conditions:10 mM potassium phosphate, pH 7.5, 25° C. “Math E112-114 and P28” depicts the expected ellipticity (from mixtures of the two peptides measured individually) if no structural change occurred due to an interaction.
Native polyacrylamide gel electrophoresis studies of the interaction between PPAK and polyE type of peptides
Native gel electrophoresis was also used to analyze the possible interaction of PPAK and polyE type peptides. The polyE peptides E115 and E137 have negative charge at pH7.5, so as expected they migrated close to the dye front when the positive electrode is at the bottom of the gel. If an oppositely charged PPAK peptide was bound, then the migration of the complex should be retarded. Since there are a greater number of shorter PPAK peptides than the longer polyE peptides in the PEVK region, it was predicted that a single polyE peptide could potentially bind more than one PPAK peptides. The resulting retardation might be in proportion to the number of PPAK peptides bound, and the complexes should be detected on the native gel if the affinities are sufficiently high.
Oppositely charged peptides were mixed together in different molar ratios. The mixtures examined included E115 + P28, E137+P28, E112-114 + P19/P12, E115 + E112-114, E137 + E112-114. Parallel experiments were conducted with 1 mM Ca2+ added to the samples, gels and electrophoresis buffer. Two native gels are shown (Fig. 7). Compared to the single peptide E115 (A) or E137 (B) in lane 1, there was no altered migration observed with any of the mixtures at peptide molar ratios between 0.2 and 2. The same results were obtained in other experiments when 1mM Ca2+ is present (data not shown).
Fig. 7.

Native gel electrophoresis analysis of PEVK peptide mixtures. A. E115 + E112-114 mixed in different mole ratios. B. Mixtures of E137 + E112-114. No alteration in migration position of the polyE peptides occurred after addition of the oppositely charged 3-PPAK module.
Hydrodynamic Measurements of Expressed Titin Peptides
A characteristic of intrinsically disordered proteins is their unusually large Stokes radius compared to their true molecular mass [31]. The three expressed titin peptides were therefore applied individually to a TSK 3000 gel permeation column, and their elution positions compared to standards with spherical shapes. The results are shown in Fig. 8. The E112-114, E115, and E137 all had anomalously large apparent molecular sizes, with the apparent hydrodynamic volumes being 2 to 4 times larger than expected for compact globular proteins.
Fig. 8.

Stokes radius estimation of expressed titin PEVK peptides by gel permeation chromatography on a TSK3000 column. Cyt c - cytochrome c (Mr 12,700); CA - carbonic anhydrase (Mr 29,000), Oval - ovalbumin (Mr 45,000), BSA - bovine serum albumin (Mr 66,000).
Discussion
Circular dichroism and PEVK secondary structure
The current work is the first report on the structural properties of the PolyE (glutamic acid rich) regions of the titin PEVK. Contrary to the greater than 70% alpha helix content for the E115 and E137 PEVK fragments predicted by the GOR method [24] and the high helical content (∼50%) suggested by the psipred [25] and nnpredict [26] methods (Table 3), these peptides had CD spectra with minima between 200 and 205 nm (Fig. 2), and only minor proportions of predicted alpha helical content. The prediction of significant alpha helix content appears to be related to the fact that glutamic acid residues are often found in helices in typical globular proteins. The specific sequence order in the E115 and E137 is not related to the GOR helical content estimates. Five randomized versions of the E115 sequence resulted in predicted alpha helical contents of 71, 71, 65, 71, and 67%, values very similar to the predicted 71% obtained with the native sequence.
The CD spectra of short synthetic Poly E peptides had similar patterns of minima near 200 nm. In addition the poly E and PPAK type peptides (both the short single P28 and the longer sequentially connected fragment from exons 112, 113, and 114) had comparable CD profiles. The spectra from all of these polypeptides appeared similar to a previously expressed fragment TP1 (composed primarily of PPAK repeats) from human fetal titin [18].
Predictions of secondary structure proportions based on a set of standard proteins indicated a majority of unordered structure for both the poly E and PPAK type peptides. Previous NMR studies have suggested that polyproline II helix may constitute a significant proportion of the PEVK structure [18]. These workers found three polyproline II helix stretches (4, 6, and 5 residues each) in a 28 amino acid PEVK peptide of the PPAK type (human titin exon 172). Each of the polyproline II segments in this peptide contained a pair of consecutive prolines; however, such an unusual density of prolines is uniquely found in this single fetal exon since only one of 38 PEVK exons expressed in adult human heart contains more than a single pair of adjacent prolines [19]. The estimated polyproline content in the three expressed titin peptides was not correlated with the proline contents of these peptides. The E112-114 had 2 proline pairs, a proline trimer, and a proline tetramer with proline constituting 25% of total residues (Table 2). In contrast the E115 had six individual prolines that were all spaced at least four or more residues apart (4%) and the expressed E137 contained only two prolines (3%), one from the actual titin peptide and one from the vector leader sequence. Thus proline content does not seem to be related to the CD spectra of these peptides.
Recent work [32] has suggested that the polyproline II helix may be only a temporally transient structure. Small angle x-ray studies on peptides containing significant polyproline II content (based on CD) showed a much smaller radius of gyration than expected from an extended polyproline structure [32]. Their interpretation was that polyproline II may be a folding conformation of only one or two residues in a continuous flux with other conformations and not lead to an extended semi-rigid rod structure [32]. Ma and Wang [14] also have concluded that the titin PEVK fluctuated between polyproline, beta turn, and unordered structure. However, their use of temperature to reduce the polyproline II content and 40% trifluoroethanol to increase beta turn proportion are far from physiological conditions. Thus the relative amounts of different secondary structure in the PEVK and whether the amounts change in the intact protein remain open questions.
Potential interaction between PPAK and poly E type fragments
The alternating net charge between the PPAK and poly E type peptides in the PEVK suggested that there might be potential charge-charge interaction [17]. This idea has been supported by studies showing an ionic strength effect on dynamic stiffness, a property ascribed to titin in the muscle cell [11,33]. Very recent work also demonstrated an ionic strength dependence on the persistence length when single molecules of the fetal titin PEVK TP1 fragment were stretched in the atomic force microscope [34]. In the current study, however, circular dichroism measurements of mixtures of short peptides (P19 with P28) or mixtures of longer expressed peptides (E112-114 with either E115 or E137) gave no evidence for interaction between them. Our preliminary report on mixtures of PEVK peptides had shown a shift in the minima when the P28 and P19 peptides were mixed [35]. Those results were obtained using approximately 5 fold higher concentrations of peptide. The concentration dependence might indicate that interactions would only be observed at higher concentration because of a weak binding affinity, or it might be caused by spectral anomalies due to the sample concentrations exceeding the spectrometer's recommended range. Evidence for the latter was obtained when mixtures of P12 and P19 resulted in a significant shift in the minima (data not shown). Thus the current work provides no evidence for structural rearrangement when the peptide concentrations were in the spectrometer's acceptable range. Circular dichroism does not allow direct observation of interactions; an interaction could only be observed if a secondary structural change was induced by formation of a complex. It should be noted that the concentrations of the oppositely charged peptides are essentially infinite in the adjacent regions on the same molecule. Therefore weak ionic interactions may well occur in the cell that can not be observed by the limited concentration range of circular dichroism. The current studies only demonstrate that strong binding complexes are not formed that alter the secondary structures of the peptides tested.
Data from native gel electrophoresis also failed to show PPAK-poly E fragment interaction in the presence or absence of Ca2+. Similar to circular dichroism, native gel electrophoresis is only useful to detect strong binding between proteins. Labeit and coworkers showed that PEVK region is calcium sensitive and suggested that titin is a calcium dependent molecular spring [29]. They also found that the polyE peptide corresponding to exon 129 bound calcium. Electrophoresis of E115 and E137 (the two largest poly E titin exons) in the presence or absence of EGTA or mM levels of calcium resulted in identical protein mobilities. Calcium binding, if it occurred, would be expected to change the net charge and/or the shape of the peptide. Calcium binding would reduce the net negative charge and retard the peptide's mobility and/or might cause the peptide to be more compact and increase mobility. However, the only way that calcium binding could be occurring undetected would be if the charge difference and peptide compaction effects were equally offsetting. The sequence pattern among the different polyE peptides is much more variable than among the PPAK types. So it is possible that exon 29 binds calcium while the E115 and E137 do not. Our studies employed the latter peptides since they are typically found in human and dog cardiac N2BA clones (present in 16 of 16 clones) [19] while the exon 129 was found in none of these same cardiac clones. Thus the potential role of calcium binding to cardiac titin requires further study.
The analysis of secondary structure of the PEVK region peptides
Different types of protein secondary structures (helices, sheets, turns and coils) give rise to different CD spectra and the spectrum will be a linear combination of fractions of the type of secondary structures (see [36] for review). It is possible to mathematically calculate the secondary structure information for an unknown protein from its CD spectrum with the help of reference spectra. Structural predictions using CD de-convolution indicated that the main structure in these titin peptides is unordered coils, consistent with previous conformational studies on the PEVK TP1 fragment found in fetal titin [14-16]. The usual reference proteins for CD de-convolution are primarily globular proteins, and thus their application to such an unusual protein sequence as is found in the PEVK may be questioned. In addition the accuracy of structural prediction based on CD is much better for alpha helix than any of the other types of secondary structures [36]. The major conclusion that can be drawn is that the titin PEVK CD spectra are remarkably similar in spite of the major sequence and amino acid composition differences between the PPAK and poly E type peptides.
Titin PEVK and intrinsic protein disorder
There is increasing realization that not all proteins and regions of proteins adopt a single secondary and tertiary structure. Such proteins (and regions within) are referred to as intrinsically disordered proteins (abbreviated IDP)[37], natively unfolded [38], or intrinsically unordered or unstructured proteins (IUP)[39] (see [40] for a recent review). The IDP have a number of characteristic properties: (1) aberrant molecular weight as determined by SDS gel electrophoresis [39] or gel permeation [39,40]; (2) high net charge at neutral pH and low content of hydrophobic amino acids [41]; (3) CD spectra that are similar to denatured or random coil proteins (minima near 200 nm and lack of minima in the 210-230 nm range typical of alpha helix and beta structure) [38]; (4) amino acid compositional bias with higher contents of lysine-glutamic acid - proline and lower amounts of aromatic residues [42,43]; (5) absence of cooperative folding transitions when the protein is heated [39]; (6) sensitivity to proteolytic degradation [39]. Conditions (1), (2), (3), and (4) are clearly met by the polyE peptides E115 and E137 since they have elevated SDS gel apparent molecular mass (35 KDa vs 18 KDa actual and 15 KDa vs 8 KDa actual respectively, Table 2 and Fig. 1), high negative charge due to the preponderance of glutamic acid residues, CD spectra that fit the typical disordered pattern, and amino acid compositional bias. The absence of cooperative change upon heating was also observed with the PPAK P28 and polyE P19 synthetic peptides (Table 4). The E112-114 has an SDS molecular mass that is nearly correct, but this polypeptide has a high positive charge, the same type of CD pattern, amino acid bias, and lack of cooperative changes in folding upon heating as other intrinsically disordered proteins. All three expressed titin peptides (E112-114, E115, and E137) exhibit 2 to 4 times larger hydrodynamic volumes as expected for globular proteins of their respective molecular masses (Fig. 8). Thus most of the criteria for intrinsically disordered proteins are met by both the PPAK and polyE type PEVK peptides.
In many cases the complex of a disordered protein with its binding partner induces the formation of secondary structure [44, 45]. There was no evidence in the current study for secondary structure changes in mixtures of oppositely charged titin PEVK peptides. However, structural rearrangement does not always occur when an intrinsically disordered protein binds to its partner. For example, complexes between the intrinsically disordered protein α-synuclein and polycations cause the oligomerization of the protein but show no alteration in the protein's CD spectrum [46].
Previous work has indicated that the PEVK region is a potential site for protein interaction. With solid phase and surface plasmon resonance assays, a PEVK segment was found to adhere to thin filaments with its interaction with actin and nebulin occurred in a calcium/S100-sensitive way [15]. Granzier and coworkers also found that cardiac PEVK bound to S100 resulting a decrease of titin-based tension before muscle contraction [47]. Further studies will be necessary to determine whether weak charge - charge interactions also occur within the titin PEVK.
Acknowledgments
Circular dichroism data were obtained at the University of Wisconsin - Madison Biophysics Instrumentation Facility, which is supported by the University of Wisconsin - Madison and grants BIR-9512577 (NSF) and S10 RR13790 (NIH). The assistance of James Brown from the University of Wisconsin-Madison Biotechnology Center in conducting the gel permeation experiments is gratefully acknowledged. This work was supported by the College of Agricultural and Life Sciences, University of Wisconsin-Madison and by a grant from the National Institutes of Health (HL77196).
References
- 1.Trinick J. Trends Biochem Sci. 1994;19:405–409. doi: 10.1016/0968-0004(94)90088-4. [DOI] [PubMed] [Google Scholar]
- 2.Horowits R, Kempner ES, Bisher ME, Podolsky RJ. Nature. 1986;323:160–164. doi: 10.1038/323160a0. [DOI] [PubMed] [Google Scholar]
- 3.Wang K, McCarter R, Wright J, Beverly J, Ramirez-Mitchell R. Proc Natl Acad Sci U S A. 1991;88:7101–7105. doi: 10.1073/pnas.88.16.7101. [DOI] [PMC free article] [PubMed] [Google Scholar]
- 4.Mayans O, van der Ven PF, Wilm M, Mues A, Young P, Furst DO, Wilmanns M, Gautel M. Nature. 1998;395:863–869. doi: 10.1038/27603. [DOI] [PubMed] [Google Scholar]
- 5.Lange S, Xiang F, Yakovenko A, Vihola A, Hackman P, Rostkova E, Kristensen J, Brandmeier B, Franzen G, Hedberg B, Gunnarsson LG, Hughes SM, Marchand S, Sejersen T, Richard I, Edstrom L, Ehler E, Udd B, Gautel M. Science. 2005;308:1599–1603. doi: 10.1126/science.1110463. [DOI] [PubMed] [Google Scholar]
- 6.Labeit S, Barlow DP, Gautel M, Gibson T, Holt J, Hsieh CL, Francke U, Leonard K, Wardale J, Whiting A, Trinick J. Nature. 1990;345:273–276. doi: 10.1038/345273a0. [DOI] [PubMed] [Google Scholar]
- 7.Labeit S, Kolmerer B. Science. 1995;270:293–296. doi: 10.1126/science.270.5234.293. [DOI] [PubMed] [Google Scholar]
- 8.Gautel M, Goulding D, Bullard B, Weber K, Furst DO. J Cell Sci. 1996;109:2747–2754. doi: 10.1242/jcs.109.11.2747. [DOI] [PubMed] [Google Scholar]
- 9.Sebestyen MG, Wolff JA, Greaser ML. J Cell Sci. 1995;108:3029–3037. doi: 10.1242/jcs.108.9.3029. [DOI] [PubMed] [Google Scholar]
- 10.Gautel M, Leonard K, Labeit S. EMBO J. 1993;12:3827–3834. doi: 10.1002/j.1460-2075.1993.tb06061.x. [DOI] [PMC free article] [PubMed] [Google Scholar]
- 11.Linke WA, Ivemeyer M, Mundel P, Stockmeier MR, Kolmerer B. Proc Natl Acad Sci U S A. 1998;95:8052–8057. doi: 10.1073/pnas.95.14.8052. [DOI] [PMC free article] [PubMed] [Google Scholar]
- 12.Labeit S, Kolmerer B, Linke WA. Circ Res. 1997;80:290–294. doi: 10.1161/01.res.80.2.290. [DOI] [PubMed] [Google Scholar]
- 13.Linke WA, Ivemeyer M, Olivieri N, Kolmerer B, Ruegg JC, Labeit S. J Mol Biol. 1996;261:62–71. doi: 10.1006/jmbi.1996.0441. [DOI] [PubMed] [Google Scholar]
- 14.Ma K, Wang K. Biochem J. 2003;374:687–695. doi: 10.1042/BJ20030702. [DOI] [PMC free article] [PubMed] [Google Scholar]
- 15.Gutierrez-Cruz G, Van Heerden AH, Wang K. J Biol Chem. 2001;276:7442–7449. doi: 10.1074/jbc.M008851200. [DOI] [PubMed] [Google Scholar]
- 16.Ma K, Wang K. FEBS Lett. 2002;532:273–278. doi: 10.1016/s0014-5793(02)03655-4. [DOI] [PubMed] [Google Scholar]
- 17.Greaser M. Proteins. 2001;43:145–149. doi: 10.1002/1097-0134(20010501)43:2<145::aid-prot1026>3.0.co;2-b. [DOI] [PubMed] [Google Scholar]
- 18.Ma K, Kan L, Wang K. 2001;40:3427–3438. doi: 10.1021/bi0022792. [DOI] [PubMed] [Google Scholar]
- 19.Greaser ML, Krzesinski PR, Warren CM, Kirkpatrick B, Campbell KS, Moss RL. J Muscle Res Cell Motil. 2005;26:325–332. doi: 10.1007/s10974-005-9039-0. [DOI] [PubMed] [Google Scholar]
- 20.Hazra AK, Chock SP, Albers RW. Anal Biochem. 1984;137:437–443. doi: 10.1016/0003-2697(84)90110-6. 1984. [DOI] [PubMed] [Google Scholar]
- 21.Sreerama N, Woody RW. Anal Biochem. 2000;287:252–260. doi: 10.1006/abio.2000.4880. [DOI] [PubMed] [Google Scholar]
- 22.Fritz JD, Swartz DR, Greaser ML. Anal Biochem. 1989;180:205–210. doi: 10.1016/0003-2697(89)90116-4. [DOI] [PubMed] [Google Scholar]
- 23.Fairbanks G, Steck TL, Wallach DF. Biochemistry. 1971;10:2606–2617. doi: 10.1021/bi00789a030. [DOI] [PubMed] [Google Scholar]
- 24.Kloczkowski A, Ting K-L, Jernigan RL, Garnier J. Proteins. 2002;49:154–166. doi: 10.1002/prot.10181. [DOI] [PubMed] [Google Scholar]
- 25.Jones DT. J Mol Biol. 1999;292:195–202. doi: 10.1006/jmbi.1999.3091. [DOI] [PubMed] [Google Scholar]
- 26.Kneller DG, Cohen FE, Langridge R. J. Mol. Biol. 1990;214:171–182. doi: 10.1016/0022-2836(90)90154-E. [DOI] [PubMed] [Google Scholar]
- 27.Ward JJ, Sodhi JS, McGuffin LJ, Buxton BF, Jones DT. J Mol Biol. 2004;337:635–645. doi: 10.1016/j.jmb.2004.02.002. [DOI] [PubMed] [Google Scholar]
- 28.Obradovic Z, Peng K, Vucetic S, Radivojac P, Brown CJ, Dunker AK. Proteins. 2003;53(Suppl 6):566–572. doi: 10.1002/prot.10532. [DOI] [PubMed] [Google Scholar]
- 29.Yang ZR, Thomson R, McMeil P, Esnouf RM. Bioinformatics. 2005;21:3369–3376. doi: 10.1093/bioinformatics/bti534. [DOI] [PubMed] [Google Scholar]
- 30.Labeit D, Watanabe K, Witt C, Fujita H, Wu Y, Lahmers S, Funck T, Labeit S, Granzier H. Proc Natl Acad Sci U S A. 2003;100:13716–13721. doi: 10.1073/pnas.2235652100. [DOI] [PMC free article] [PubMed] [Google Scholar]
- 31.Zeev-Ben-Mordehai T, Rydberg EH, Solomon A, Toker L, Auld VJ, Silman I, Botti S, Sussman JL. Proteins. 2003;53:758–767. doi: 10.1002/prot.10471. [DOI] [PubMed] [Google Scholar]
- 32.Makowska J, Rodziewicz-Motowidlo S, Baginska K, Vila JA, Liwo A, Chmurzynski L, Scheraga HA. Proc Natl Acad Sci U S A. 2006;103:1744–1749. doi: 10.1073/pnas.0510549103. [DOI] [PMC free article] [PubMed] [Google Scholar]
- 33.Minajeva A, Kulke M, Fernandez JM, Linke WA. Biophys J. 2001;80:1442–1451. doi: 10.1016/S0006-3495(01)76116-4. [DOI] [PMC free article] [PubMed] [Google Scholar]
- 34.Forbes JG, Jin AJ, Ma K, Gutierrez-Cruz G, Tsai WL, Wang K. J Muscle Res Cell Motil. 2005;26:291–301. doi: 10.1007/s10974-005-9035-4. [DOI] [PMC free article] [PubMed] [Google Scholar]
- 35.Greaser ML, J. Dekeyser J, Damodaran S. Biophys. J. 2002;82:400a. 2002. [Google Scholar]
- 36.Greenfield NJ. Anal Biochem. 1996;235:1–10. doi: 10.1006/abio.1996.0084. [DOI] [PubMed] [Google Scholar]
- 37.Dunker AK, Lawson JD, Brown CJ, Williams RM, Romero P, Oh JS, Oldfield CJ, Campen AM, Ratliff CM, Hipps KW, Ausio J, Nissen MS, Reeves R, Kang C, Kissinger CR, Bailey RW, Griswold MD, Chiu W, Garner EC, Obradovic Z. J Mol Graph Model. 2001;19:26–59. doi: 10.1016/s1093-3263(00)00138-8. [DOI] [PubMed] [Google Scholar]
- 38.Uversky VN. Protein Sci. 2002;11:739–756. doi: 10.1110/ps.4210102. [DOI] [PMC free article] [PubMed] [Google Scholar]
- 39.Tompa P. Trends Biochem Sci. 2002;27:527–533. doi: 10.1016/s0968-0004(02)02169-2. [DOI] [PubMed] [Google Scholar]
- 40.Receveur-Brechot V, Bourhis JM, Uversky VN, Canard B, Longhi S. Proteins. 2006;62:24–45. doi: 10.1002/prot.20750. [DOI] [PubMed] [Google Scholar]
- 41.Uversky VN, Gillespie JR, Fink AL. Proteins. 2000;41:415–427. doi: 10.1002/1097-0134(20001115)41:3<415::aid-prot130>3.0.co;2-7. [DOI] [PubMed] [Google Scholar]
- 42.Hansen JC, Lu X, Ross ED, Woody RW. J Biol Chem. 2006;281:1853–1856. doi: 10.1074/jbc.R500022200. [DOI] [PubMed] [Google Scholar]
- 43.Romero P, Obradovic Z, Kissinger CR, Villafranca JE, Garner E, Guilliot S, Dunker AK. Pac Symp Biocomput. 1998:437–448. [PubMed] [Google Scholar]
- 44.Weathers EA, Paulaitis ME, Woolf TB, Hoh JH. FEBS Lett. 2004;576:348–52. doi: 10.1016/j.febslet.2004.09.036. [DOI] [PubMed] [Google Scholar]
- 45.Dyson HJ, Wright PE. Curr Opin Struct Biol. 2002;12:54–60. doi: 10.1016/s0959-440x(02)00289-0. [DOI] [PubMed] [Google Scholar]
- 46.Goers J, Uversky VN, Fink AL. Protein Sci. 2003;12:702–707. doi: 10.1110/ps.0230903. [DOI] [PMC free article] [PubMed] [Google Scholar]
- 47.Yamasaki R, Berri M, Wu Y, Trombitas K, McNabb M, Kellermayer MS, Witt C, Labeit D, Labeit S, Greaser M, Granzier H. Biophys J. 2001;81:2297–2313. doi: 10.1016/S0006-3495(01)75876-6. [DOI] [PMC free article] [PubMed] [Google Scholar]