

Abstract
The BCKDH (branched-chain α-keto acid dehydrogenase complex) catalyses the rate-limiting step in the oxidation of BCAAs (branched-chain amino acids). Activity of the complex is regulated by a specific kinase, BDK (BCKDH kinase), which causes inactivation, and a phosphatase, BDP (BCKDH phosphatase), which causes activation. In the present study, the effect of the disruption of the BDK gene on growth and development of mice was investigated. BCKDH activity was much greater in most tissues of BDK−/− mice. This occurred in part because the E1 component of the complex cannot be phosphorylated due to the absence of BDK and also because greater than normal amounts of the E1 component were present in tissues of BDK−/− mice. Lack of control of BCKDH activity resulted in markedly lower blood and tissue levels of the BCAAs in BDK−/− mice. At 12 weeks of age, BDK−/− mice were 15% smaller than wild-type mice and their fur lacked normal lustre. Brain, muscle and adipose tissue weights were reduced, whereas weights of the liver and kidney were greater. Neurological abnormalities were apparent by hind limb flexion throughout life and epileptic seizures after 6–7 months of age. Inhibition of protein synthesis in the brain due to hyperphosphorylation of eIF2α (eukaryotic translation initiation factor 2α) might contribute to the neurological abnormalities seen in BDK−/− mice. BDK−/− mice show significant improvement in growth and appearance when fed a high protein diet, suggesting that higher amounts of dietary BCAA can partially compensate for increased oxidation in BDK−/− mice. Disruption of the BDK gene establishes that regulation of BCKDH by phosphorylation is critically important for the regulation of oxidative disposal of BCAAs. The phenotype of the BDK−/− mice demonstrates the importance of tight regulation of oxidative disposal of BCAAs for normal growth and neurological function.
Keywords: branched-chain amino acid, branched-chain α-keto acid dehydrogenase complex, branched-chain α-keto acid dehydrogenase complex kinase (BDK), BDK knockout mice, epilepsy
Abbreviations: BCAA, branched-chain amino acid; BCAT, branched-chain amino acid aminotransferase; BCKA, branched-chain α-keto acid; BCKDH, branched-chain α-keto acid dehydrogenase complex; BDK, branched-chain α-keto acid dehydrogenase complex kinase; BDP, branched-chain α-keto acid dehydrogenase complex phosphatase; eIF, eukaryotic initiation factor; ES, embryonic stem; KH buffer, Krebs–Henseleit buffer
INTRODUCTION
The BCAAs (branched-chain amino acids; leucine, isoleucine, and valine) constitute an important subgroup of the indispensable amino acids. Leucine in particular plays a special role in the stimulation of protein synthesis [1], provision of amino groups for the synthesis of the neurotransmitter glutamate [2], inhibition of autophagy [3] and stimulation of the synthesis and secretion of insulin [4]. Although vital for normal physiological functions, excessive amounts of BCAAs are toxic and cause severe tissue damage, especially to the central nervous system, as evident from the neuropathology associated with maple syrup urine disease [5]. Since BCAAs cannot be stored in any form other than protein, it is necessary to remove BCAAs in excess of that needed for protein synthesis. Disposal of BCAAs involves transamination with 2-oxoglutarate to produce the corresponding BCKAs (branched-chain α-keto acids) by the BCAT (branched-chain amino acid amino transferase). The resulting BCKAs are oxidatively decarboxylated to their corresponding acyl-CoA esters by the BCKDH (BCKA dehydrogenase complex). The latter is the irreversible, rate-limiting step of the pathway that commits BCAAs to degradation. Regulation of BCKDH activity is therefore important for maintaining the proper levels of BCAAs in the body. BCKDH is regulated by a phosphorylation/dephosphorylation cycle, much like the pyruvate dehydrogenase complex. BCKDH is phosphorylated and inactivated by BDK (BCKDH kinase) and dephosphorylated and activated by BDP (BCKDH phosphatase) [6]. BDK is inhibited by αketoisocaproate produced by transamination of leucine [7]. When BCAAs are present in excess, the amount of BDK bound to the complex is reduced [8] and α-keto-isocaproate inhibits BDK activity, resulting in a highly dephosphorylated and active BCKDH that disposes of the excess BCAAs. When there is a danger of BCAAs becoming limiting for protein synthesis, as in the case of dietary protein starvation, the amount of BDK bound to the complex is increased [8] and the concentration of α-ketoisocaproate falls below the concentration that inhibits phosphorylation and inactivation of the BCKDH by BDK.
BCKDH is also subjected to allosteric regulation by NADH and branched-chain acyl-CoA ester, end products of the oxidative decarboxylation of the BCKAs [9,10]. Indeed, the primary reason we produced the BDK−/− (BDK knockout) mouse was to test whether regulation of the activity of the complex by phosphorylation is an important and necessary mechanism for regulation of BCKDH activity. A secondary reason was to produce a mouse model that is useful for investigation of the physiological importance of BCAA signalling. The phenotype of the BDK−/− mouse demonstrates that the activity of BCKDH cannot be adequately controlled in the absence of BDK. Lack of control of BCKDH activity by its kinase leads to over-oxidation of BCAAs, which in turn has severe effects on whole-body physiology, especially on the central nervous system.
EXPERIMENTAL
Generation of BDK−/− mice
Mice heterozygous for deletion of the BDK gene were obtained from Lexicon Genetics. ES (embryonic stem) cells (129/SvEvBrd) from the Lexicon Genetics OmniBank library of genetrapped mouse ES cell clones were infected with retroviral gene-trap vector VICTR48 [11] which integrated upstream of exon 2 of the BDK gene (Figure 1). An ES cell line with the BDK gene disrupted was injected into C57BL/6J blastocyts and implanted in pseudopregnant mothers. The pups were crossed with C57BL/6J mice obtained from the Jackson Laboratory. Genotypes were determined by analysis of genomic DNA by PCR. Heterozygous mice were backcrossed with C57BL/6J for six generations to reduce heterozygosity in the genetic background. After six generations, the heterozygous mice were crossed with each other to generate the wild-type, heterozygous and homozygous mice.
Figure 1. Disruption of the BDK gene and identification of BDK−/− mice.

(A) Method used to disrupt the BDK gene by Lexicon Genetics [11]. BTK, Bruton's tyrosine kinase exon; LTR, viral long terminal repeat; NEO, neomycin gene; pA, SV40 polyadenylation sequence; PGK, phosphoglycerate kinase 1 promoter; SA, splice acceptor sequence; SD, splice donor sequence. (B) Genotyping of BDK−/− mice by PCR analysis using genomic DNA isolated from BDK+/+, BDK+/− and BDK−/− mice. (C) Western blot analyses for BDK using protein extracts prepared from BDK+/+, BDK+/− and BDK−/− mice.
Growth curves and tissue weights
Mice were housed at 23±1 °C with light from 07:00 h to 19:00 h, and free access to water and a chow diet containing 18% protein (7017; Harlan Teklad) or a high protein semi-synthetic diet with 50% protein, 33% carbohydrate and 7% fat (F4638; Bio-Serv). Pellets of the diets were mixed with water when wet feed was given to weanling BDK−/− mice. All procedures involving animals were approved by the Institutional Animal Care and Use Committee of Indiana University School of Medicine. Breeding pairs of BDK−/− and BDK+/+ mice were established to produce BDK−/− and BDK+/+ mice respectively. To study the effect of extra dietary protein on growth, the high protein diet was given at the time breeding pairs were established and continued after weaning of the pups. Mice were weighed on the day of birth and weekly thereafter. At the end of 16 weeks mice were fasted from 09:00 h to 17:00 h before being killed by cervical dislocation. Tissues were removed and rapidly freeze clamped in liquid N2 and stored at −80 °C until use.
Enzyme assays
Extracts of tissues for the BCKDH assay were prepared as described previously [12]. BCKDH was concentrated from whole tissue extracts prior to assay by precipitation with 9% poly(ethylene glycol). The activities of BCKDH in the native form (actual activity) and dephosphorylated form (total activity) were determined spectrophotometrically by measuring the rate of NADH production with α-keto-isovalerate as substrate with a Cary 50 spectrophotometer (Varian) [12]. Total activity was measured after dephosphorylation of the complex with lambda protein phosphatase (New England Biolabs) [12].
Immunoblot analysis
Antisera for each component [the subunits of BCKA decarboxylase (E1) and the dihydrolipoyl transacylase (E2)] of BCKDH were generated against purified E1 and E2 components of isolated rat liver BCKDH [12]. A monoclonal antibody against BDK was a gift from Dr Yoshiharu Shimomura (Department of Materials Science and Engineering, Nagoya Institute of Technology, Nagoya, Japan). An antibody against eIF2α (eukaryotic initiation factor 2α)-[pS51] was purchased from Biosource. For Western blot analysis of various proteins, tissues were powdered under liquid nitrogen and protein was extracted with a buffer containing 10 mM Tris/HCl (pH 7.5), 1 mM EDTA, 0.5% (v/v) Triton X-100, 2% (v/v) adult bovine serum, 1 μM leupeptin, 10 μM Tos-Phe-CH2Cl (tosylphenylalanylchloromethane), 10 μg/ml trypsin inhibitor (from chicken egg white Type 11-0), 37 mM β-glycerophosphate and 50 mM potassium fluoride. Extracts were clarified by centrifugation at 14000 g for 10 min and supernatants were collected. Protein concentrations were determined by the Bradford method (Bio-Rad). Protein (50 μg) was separated by SDS/PAGE and transferred on to nitrocellulose membranes (Schleicher and Schuell BioScience) by the semi-dry method. Membranes were blocked with 50 g/l BSA in TBS-T [20 mM Tris/HCl (pH 7.5), 0.15 M NaCl and 0.1% (w/v) Tween 20]. Blots were incubated with the primary antibody in blocking buffer overnight at 4 °C, washed three times with TBS-T, and incubated with an anti-rabbit IgG–HRP (horseradish peroxidase) conjugate (Upstate) in blocking buffer for 1 h at room temperature (25 °C). Membranes were washed three times with TBS-T and incubated with Lumi-light Western blotting substrate (Roche). Membranes were exposed to Kodak X-Omat LS Film and developed according to the manufacturer's protocol.
Valine utilization by isolated diaphragms
Diaphragms from fed mice were excised and rinsed in KH (Krebs–Henseleit) buffer [13]. Blotted and weighed diaphragms were placed in Erlenmeyer flasks (10 ml) containing 1.5 ml of KH buffer (pH 7.4) supplemented with 5 mM glucose, 1 mM valine and 0.2% (w/v) BSA (non-esterified fatty acid free). The flasks were gassed with O2/CO2 (19:1), sealed with rubber stoppers and pre-incubated at 37 °C for 30 min in a shaking water bath (60 cycles/min). Diaphragms were removed from the flasks, blotted and transferred to new flasks containing 1.5 ml of KH buffer supplemented with 5 mM glucose, 1 m-units/ml insulin, 0.2% BSA and 1 mM valine containing 160 μCi/mmol [1-14C]valine. Flasks were flushed with O2/CO2 (19:1), sealed with rubber stoppers fitted with hanging centre wells (Kontes), and incubated for 1 h with shaking at 37 °C. For the termination of the reactions 100 μl of 60% (w/v) perchloric acid was injected into the reaction mixture and 250 μl of phenethylamine/methanol (1:1, v/v) was added into the centre wells for collecting the 14CO2 produced. The flasks were resealed with fresh rubber stoppers fitted with hanging centre wells. Hydrogen peroxide (350 μl of 30% w/v) was injected into the contents of the flask and 250 μl of phenethylamine/methanol solution (1:1, v/v) was added to the centre wells for collection of the 14CO2 generated by the decarboxylation of α-keto-isovalerate.
Measurement of amino acids
Following decapitation of the mice, blood was collected, kept on ice to coagulate and centrifuged (3000 g for 10 min at 4 °C) to obtain serum. Tissues were powdered under liquid nitrogen, weighed and extracted with 3 vol of 0.6 M perchloric acid for deproteinization. Precipitated proteins were removed by centrifugation, and the supernatants were neutralized with 4 M potassium carbonate. Brain and blood amino acid analyses were carried out with a Beckman 6300 automated amino acid analyser by the Quantitative Amino Acid Analysis Core of the Indiana University School of Medicine, Indianapolis, IN, U.S.A. The sum of the three BCAAs was also measured spectrophotometrically with leucine dehydrogenase (Toyobo) [14].
Histological examination of the brain
Female mice at 7, 14, 25 and 35 weeks of age were selected for histological examination of brain sections. Mice were anaesthetized by injecting Nembutal (70 mg/kg body weight) intraperitoneally. Saline was injected into the left ventricle of the heart to wash blood from the organs. This was followed by injection of 1:10 diluted buffered formalin. The brains were removed and fixed in 10% neutral formalin for 2 weeks. Brains were serially sectioned at 2–3 mm intervals in the coronal plane and submitted for processing and paraffin embedding. Sections of 4 μm were prepared and stained with haematoxylin and eosin. Multiple areas of the brains were examined.
Characterization of epilepsy in BDK−/− mice
Eleven female mice that were 6–8 months old were observed for 3 weeks. Mice were checked every third day from day 0 to day 21 for a total of eight observations. Each mouse was held by the tail for 20 s to determine if a seizure occurred. Seizure duration was measured and severity estimated according to the six-stage rating scale of Racine [15]: stage one is lip smacking; stage two is stage one plus head bobbing; stage three is stages one and two plus fore limb clonus; stage four is stages one to three plus rearing; stage five is stages one to four plus loss of balance and generalized tonus/clonus of fore limbs and hind limbs; stage six is death. The results were presented as the number of times a mouse had epilepsy out of eight observations, the average duration, the maximum severity and the average severity according to the Racine rating scale.
Statistical analysis
Results are expressed as means±S.E.M. for the indicated number of animals in each group. P<0.05 was considered significant (Student's t test).
RESULTS
Characteristics of BDK−/− mice
Genotyping of the mice was routinely accomplished by PCR analysis of genomic DNA (Figure 1B). BDK protein was totally absent from tissues of BDK−/− mice (Figure 1C). Mice heterozygous for BDK expressed about half the amount of BDK expressed in BDK+/+ mice, suggesting a gene-dosage effect on the expression of BDK protein.
Nearly expected numbers of wild-type, heterozygous and homozygous null mice were obtained from mating of heterozygous BDK mice (BDK+/+, 78; BDK+/−, 139; BDK−/−, 59). Fertility of BDK−/− mice was investigated with 14 pairs of BDK−/− male and female mice. Five litters were obtained within a month of setting up the 14 pairs, indicating BDK−/− mice are fertile. However, three of the breeding pairs required 8 weeks to produce litters and six of the breeding pairs failed to reproduce, indicating a decrease in fertility. This is in contrast with the BDK+/+ mice which delivered pups over 90% of the time within a month of setting up the pairs.
BCKDH activity is greater in tissues of BDK−/− mice
Actual and total BCKDH activities were higher in brain, heart, muscle and kidney of BDK−/− mice compared with BDK+/+ mice (Table 1). In BDK+/+ mice the complex was partially phosphorylated and only partially active in these tissues, whereas in BDK−/− mice the complex was completely dephosphorylated and therefore totally active (Table 1). Surprisingly, total BCKDH activities in these tissues of BDK−/− mice were also significantly greater than the corresponding total BCKDH activities in BDK+/+ mice. These results suggest that a constitutive activation of BCKDH occurs in these tissues of BDK−/− mice.
Table 1. Actual and total activities of BCKDH in liver, kidney, heart, skeletal muscle and brain of BDK+/+ and BDK−/− mice.
Values are means±S.E.M., n=4 for liver and kidney; n=3 for heart, skeletal muscle and brain. (*P<0.0001; **P<0.01; ***P<0.05). Before activation refers to activity of BCKDH in tissue extracts. After activation refers to activity of BCKDH in tissue extracts after enzymatic dephosphorylation.
| BCKDH activity (m-units/g of wet weight) | BCKDH | |||
|---|---|---|---|---|
| Tissue | BDK genotype | Before activation | After activation | Activity state (%) |
| Brain | +/+ | 31±3 | 48±5 | 65±4 |
| −/− | 81±10*** | 82±9*** | 99±3** | |
| Heart | +/+ | 144±34 | 237±48 | 61±7 |
| −/− | 579±18** | 538±31*** | 108±3*** | |
| Kidney | +/+ | 91±5 | 366±14 | 25±2 |
| −/− | 466±15* | 476±26*** | 98±3* | |
| Liver | +/+ | 862±26 | 851±33 | 101±2 |
| −/− | 723±75 | 709±75 | 102±1 | |
| Muscle | +/+ | <1 | 19±3 | <5 |
| −/− | 44±7 | 39±7 | 114±5* | |
A similar response to deleting BDK was not observed in the liver (Table 1). In contrast with other tissues, the BCKDH was completely active in the livers of BDK+/+ and BDK−/− mice (Table 1). Furthermore, there was a tendency for actual and total BCKDH activities to be slightly lower in the BDK−/− mice (Table 1). Reduced BCKDH activity in liver could be a compensatory response to reduced BCAA levels resulting from a greater rate of BCAA oxidation in the peripheral tissues of BDK−/− mice. Feeding rats a low protein diet reduces total BCKDH activity in the liver [16].
Greater amounts of BCKDH E1α and E1β protein are present in the brain, heart, skeletal muscle and kidney, but not in the liver, of BDK−/− mice
The finding that there was a greater total BCKDH activity in tissues of BDK−/− mice was unexpected given that down-regulation would have been a predicted physiological response. However, the greater total activity might be a consequence of enhanced expression of the BCKDH subunits, as found previously in rats fed a high protein diet [16]. Indeed, Western blot analysis revealed that greater amounts of E1α protein were present in the heart, kidney, muscle and brain of BDK−/− mice compared with the BDK+/+ mice (Figure 2). Longer exposure of these blots revealed that the E1β protein increased in parallel with E1α in these tissues (results not shown). In contrast, the relative amounts of the E2 protein were nearly identical for the two groups of mice (Figure 2), indicating that an increase in the amount of the transacylase component of the complex was not responsible for greater BCKDH activity. The findings are therefore consistent with an increase in the amount of E1, the decarboxylase component, being responsible for greater BCKDH activity. E1 is known to catalyse the rate-limiting reaction of the complex [17].
Figure 2. Increase in the amounts of BCKDH E1α subunit in various tissues of BDK−/− mice.

Western blot analysis of E2 and E1α subunits of BCKDH in the liver, brain, heart, kidney and muscle of BDK+/+ and BDK−/− mice and quantification of relative amounts of the E1α subunit of BCKDH in various tissues of BDK−/− (closed bars) mice compared with that of BDK+/+ (open bars). Extracts from an indicated tissue of all BDK+/+ and BDK−/− mice were run on one gel and subjected to Western blot analysis for determination of relative amounts of E1α in that tissue of BDK−/− mice compared with that of BDK+/+ mice. Images for each tissue of one BDK+/+ mouse and one BDK−/− mice were cropped from the resulting blots to make the composite figure given at the top. Comparisons of relative amounts of the proteins can be made for a given tissue but not across tissues. Results are means±S.E.M., n=3 (*P<0.05).
In contrast, the livers of BDK−/− mice and BDK+/+ mice showed levels of E1α protein (Figure 2) and E1β protein (results not shown) that were nearly identical, consistent with the finding that there was little difference in total BCKDH activity between the livers of BDK−/− and BDK+/+ mice (Table 1).
A small, but significant, difference in mobility on SDS/PAGE was seen for E1α protein from BDK−/− and BDK+/+ mice in all tissues examined, except for the liver (Figure 2). Given that phosphorylation decreases the mobility of the E1α protein on SDS/PAGE [18], these findings are consistent with considerable E1α phosphorylation in tissues from BDK+/+ mice, with the exception of liver, and no phosphorylation of E1α in tissues from BDK−/− mice.
To more directly address this issue, the mobility of E1α was measured after treatment of tissues extracts with lambda protein phosphatase to completely dephosphorylate the E1α component of the complex. This treatment increased the migration of E1α from BDK+/+ tissues to that identical with that of E1α from BDK−/− mice (results not shown). No change in mobility of E1α from BDK−/− tissues was induced by phosphatase treatment, confirming that that E1α was completely dephosphorylated in these mice (results not shown).
Increased oxidation of valine in the diaphragm of BDK−/− mice
The capacity to utilize valine was significantly greater in diaphragms from BDK−/− mice compared with diaphragms from BDK+/+ mice (Table 2). Diaphragms from BDK−/− mice oxidized valine to CO2 at a rate that was three times higher than diaphragms from BDK+/+ mice. Large amounts of α-keto-isovalerate accumulated in the incubation medium of diaphragms from BDK+/+ mice, whereas practically none of this transamination product of valine accumulated in the incubation medium of diaphragms from BDK−/− mice (Table 2). These findings are consistent with a low actual activity of BCKDH in muscle of BDK+/+ mice compared with 100% activity of BCKDH in muscle of BDK−/− mice. There appears to be a shift in the rate-limiting step for valine oxidation from oxidative decarboxylation in diaphragms from BDK+/+ mice to transamination in diaphragms from BDK−/− mice.
Table 2. Effect of BDK deficiency on valine oxidation by isolated diaphragms.
Total valine utilized, α-keto-isovalerate (α-KIV) accumulated and CO2 produced in μmol/g of wet weight/h in the diaphragms from BDK+/+ and BDK−/− mice. Values are means±S.E.M., n=3 (*P<0.05).
| Rate | ||
|---|---|---|
| BDK+/+ | BDK−/− | |
| CO2 production | 0.40±0.02 | 1.17±0.11* |
| α-KIV accumulation | 0.46±0.04 | 0.03±0.01* |
| Total valine utilization | 0.85±0.04 | 1.19±0.11* |
BCAAs are low in blood, brain, heart, muscle and kidney, but not in the liver, of BDK−/− mice
BCAAs were 50–60% lower in the blood and 70–75% lower in the brain of BDK−/− mice compared with BDK+/+ mice (Table 3). Concentrations of BCAAs were reduced by 55%, 50% and 70% respectively in heart, muscle and kidney of BDK−/− mice compared with BDK+/+ mice (Table 4). BCAAs also tended to be lower, but not statistically significant, in the livers of BDK−/− mice (Table 4). Although the BCKDH is also involved in the oxidative disposal of threonine and methionine [19,20], the concentrations of these amino acids were not affected in BDK−/− mice (Table 3). This is notable because the keto acids produced by deamination of threonine (2-oxobutyrate) and transamination of methionine (4-methylthio-2-oxobutyrate) are good substrates (Km values of 18–26 μM and 49 μM respectively) for BCKDH [19,20].
Table 3. Concentrations of amino acids in the serum and brains of BDK+/+ and BDK−/− mice.
Amino acid concentrations in μmol/g of wet weight for brain and μM for serum. Values are means±S.E.M., n=5 except for isoleucine in brain (n=4) (*P<0.0001; **P<0.01). Percentage reduction indicates how much each amino acid was reduced in BDK−/− mice.
| Amino acid concentration | ||||
|---|---|---|---|---|
| Tissue | Amino acid | BDK+/+ | BDK−/− | Percentage reduction |
| Brain | Valine | 173±27 | 49±14* | 72 |
| Leucine | 62±6 | 20±2* | 68 | |
| Isoleucine | 30±3 | 8±1** | 74 | |
| Serum | Valine | 208±12 | 105±12* | 49 |
| Leucine | 149±12 | 71±9** | 52 | |
| Isoleucine | 90±15 | 28±3** | 69 | |
| Threonine | 138.8±19.5 | 131.1±5.8 | 6 | |
| Methionine | 65.5±11.7 | 50.1±5.3 | 24 | |
Table 4. Concentrations of BCAAs in various tissues of BDK+/+ and BDK−/− mice.
Spectrophotometric quantification of BCAAs in liver, heart, kidney and muscles of BDK+/+ and BDK−/− mice. Amino acid concentrations in μmol/g of wet weight. Values are means±S.E.M., n=3 (*P<0.05).
| Concentration of BCAAs | ||
|---|---|---|
| Tissue | BDK+/+ | BDK−/− |
| Liver | 370±95 | 272±31 |
| Kidney | 390±50 | 194±14* |
| Heart | 279±27 | 125±22* |
| Muscle | 330±54 | 101±6* |
Lack of control of the BCKDH greatly affects the phenotype of BDK−/− mice
A significant difference in the body weights of BDK−/− and BDK+/+ mice was apparent after 2 weeks of age (Figure 3A). Weanling BDK−/− mice were smaller than BDK+/+ mice, and some of them died at weaning unless wet feed was provided. At 3 weeks of age BDK−/− mice were 15% shorter than BDK+/+ mice (6.10±0.04 cm compared with 7.13±0.02 cm, means±S.E.M., P<0.001). A delay in weaning of 1 week greatly improved survival of BDK−/− mice. During the third week, BDK+/+ mice showed a lag in weight gain that produced a plateau in the growth curve (Figure 3B). This was much more pronounced with BDK−/− mice, with all of the mice losing weight during the third week. This lag phase was followed by a steep increase in body weight during weeks 4–6, but there was a remarkable difference in the pattern of growth during this time between BDK−/− and BDK+/+ mice. BDK+/+ mice grew rapidly during the fourth week followed by a gradual reduction during weeks 5 and 6. Growth of BDK−/− mice was much slower than that of BDK+/+ mice during the fourth week and marginally, but significantly, faster during weeks 5 and 6. During the last 2 weeks of this period BDK−/− mice caught up with BDK+/+ mice to some extent. BDK−/− mice grew at about the same rate as BDK+/+ mice after week 6, with the difference in weights of mice at 12 weeks of age reflecting the extra weight gained by BDK+/+ mice during the early growth spurt. At 12 weeks of age male BDK−/− mice were 15% smaller than wild-type mice (28.9±0.7 g for BDK+/+ compared with 24.9±0.4 g for BDK−/−, means±S.E.M.; n=9 for BDK+/+; n=11 for BDK−/−; P<0.05).
Figure 3. Alterations in the pattern of the growth curve in BDK−/− mice.

(A) Growth curves of male BDK+/+ (□) and BDK−/− (■) mice fed on a chow diet. (B) Growth rates of male BDK+/+ (□) and BDK−/− (■) mice fed on a chow diet. (C) Growth curves of male BDK+/+ (□) and BDK−/− (■) mice fed on a high protein diet. (D) Growth rates of male BDK+/+ (□) and BDK−/− (■) mice fed on a high protein diet. Values are means±S.E.M., n=11 for BDK+/+ mice fed on a chow diet, n=7 for BDK−/− mice fed on a chow diet, n=4 for both BDK+/+ and BDK−/− mice fed on a high protein diet (*P<0.05).
BDK−/− mice showed a significant improvement in their growth and appearance when a high protein diet was given (Figure 3C). A growth pattern similar to that of the mice fed on a chow diet was followed by BDK−/− mice fed on a high protein diet (Figure 3D). BDK−/− mice on a high protein diet also lost body weight during the third week, however, the growth spurt during weeks 4–6 was much more robust as compared with BDK−/− mice on a chow diet. Interestingly, on a high protein diet, BDK−/− mice gained significantly more weight during the first week of their lives than BDK+/+ mice.
Tissue weights are affected in BDK−/− mice
Weights of brain, muscle and adipose tissue (relative to the whole body weight of BDK−/− mice fed on a chow diet) were 30%, 15% and 40% less respectively, compared with those of BDK+/+ mice (Table 5). The heart weight was not changed relative to total body weight, but liver and kidney weights were increased by approx. 10% (Table 5). Consistent with an improved growth in BDK−/− mice fed on a high protein diet, weights of brain, muscle and adipose tissue showed a significant increase as compared with tissues from BDK−/− mice fed on a chow diet. The weights of brain and adipose tissue were still less by 20% and 45% respectively, whereas the kidney weight was 30% greater in BDK−/− mice fed on a high protein diet compared with BDK+/+ mice fed on a high protein diet (Table 5).
Table 5. Weights of various tissues of BDK+/+ and BDK−/− mice.
Comparison of weights of various tissues relative to the total body weight (g/100 g) for BDK+/+ and BDK−/− mice. Weights of the adipose tissue and muscle correspond to the sum of the two epididymal fat pads and the sum of the two gastrocnemius muscles of the mice respectively. Values are means±S.E.M. n=11 for BDK+/+ mice and n=6 for BDK−/− mice on a chow diet; (*P<0.05) n=4 for BDK+/+ and BDK−/− mice on a high protein diet; (†P<0.05).
| Relative weight | ||||
|---|---|---|---|---|
| Chow diet | High protein diet | |||
| Tissue | BDK+/+ | BDK−/− | BDK+/+ | BDK−/− |
| Liver | 4.01±0.07 | 4.41±0.8* | 3.62±0.12 | 3.57±0.12 |
| Brain | 1.59±0.06 | 1.09±0.08* | 1.55±0.04 | 1.23±0.11† |
| Kidney | 1.29±0.02 | 1.46±0.03* | 1.32±0.02 | 1.71±0.13† |
| Heart | 0.61±0.03 | 0.61±0.04 | 0.54±0.02 | 0.53±0.04 |
| Adipose | 1.77±0.14 | 1.09±0.06* | 2.48±0.30 | 1.38±0.23† |
| Muscle | 0.90±0.02 | 0.78±0.06* | 1.12±0.03 | 0.99±0.09 |
The central nervous system is affected in BDK−/− mice
BDK−/− mice have an abnormal gait with a predilection to splay their hind limbs as shown in Figure 4(A). This is apparent in mice as young as 3 weeks. They also exhibited hind limb flexion, extension and clinching of the hind limbs to their body when hung by the tail, suggesting a defect in nerve function (Figure 4B). Although not completely lost, less clinching of the hind limbs to the body was noted in BDK−/− mice that were fed a high protein diet. At approx. 6–7 months of age, BDK−/− mice developed epileptic seizures, lasting for a few seconds to as long as 2 min (Figure 4C). The seizures could be evoked by touching, gently hanging the mouse by its tail for a few seconds or cage changing. The six-stage rating scale of Racine [15] was used to quantify seizure activity (Table 6). For example, eleven 6–7 month old BDK−/− female mice were tested every third day for 3 weeks for a total of eight observation periods (Table 6). Each mouse was held by the tail for 20 sec to determine whether a seizure would occur. Nine out of eleven mice experienced seizures at least twice, with a severity of five during the 3 week observation period. The seizure activity started with lip smacking followed by head bobbing and frequently progressed to fore limb clonus, rearing and generalized tonic/clonic seizure activity with foaming in the mouth. Severe seizures also induced whitening of the eyeballs and maximum extension of the hind limbs. Mice that experienced the latter usually died. One mouse seized during seven of the eight observation periods with an average severity of 4.3±0.6 and an average duration of 29.3±4.8 s. One mouse died during a seizure. Necropsy of these mice failed to reveal the cause of death. Histological examination of brain sections revealed an overall reduction in size of all parts of the brain rather than a disproportionate loss in volume of any one part. No structural abnormalities were apparent by histological examination.
Figure 4. Differences in the physical appearance of BDK−/− mice.

(A) Appearance of 5-week-old BDK−/− mice compared with that of 5 week old wild-type mice. Note the splayed hind limbs of the BDK−/− mice. (B) BDK−/− mice showing clinching of the hind limbs to the body. (C) BDK−/− mouse having an epileptic seizure.
Table 6. Frequency of epilepsy in old BDK−/− female mice.
Individual data are presented for eleven mice examined every third day for 3 weeks for a total of eight observations. Seizure occurrence indicates the number of seizures that occurred during the total observations. Severity was determined according to rating scale of Racine [15].
| Age (days) | Seizure occurrence | Maximum severity | Average severity | Average duration (s) |
|---|---|---|---|---|
| 219 | 7/8 | 5 | 4.3±0.6 | 29.3±4.8 |
| 193 | 0/8 | – | – | – |
| 203 | 3/8 | 5 | 5.0±0.0 | 31.3±7.4 |
| 188 | 6/8 | 5 | 4.3±0.7 | 26.3±4.7 |
| 188 | 3/8 | 5 | 5.0±0.0 | 28.3±3.7 |
| 188 | 0/8 | – | – | – |
| 189 | 6/8 | 5 | 3.7±0.8 | 23.7±3.7 |
| 245 | 4/8 | 5 | 4.0±1. | 42.5±11.4 |
| 247 | 4/4 | 6 | 4.5±0.9 | 33.8±8.2 |
| 247 | 4/8 | 5 | 3.8±0.9 | 22.0±3.9 |
| 233 | 2/8 | 5 | 3.0±0.2 | 16.0±1.0 |
Lowered leucine levels have been reported to induce phosphorylation of the α-subunit of eIF2, which results in lowered eIF2–GDP to eIF2–GTP exchange and lowered global protein synthesis due to translation inhibition [21]. Interestingly, there have been several reported links between eIF2α phosphorylation and epilepsy [40,41]. Consistent with the lowered levels of serum BCAAs in BDK−/− mice, we found a significant induction of phosphorylation of eIF2α in the brains of mutant mice in the absence of environmental stress, as compared with their wild-type counterparts (Figure 5).
Figure 5. Hyperphosphorylation of eIF2α protein in the brains of BDK−/− mice.
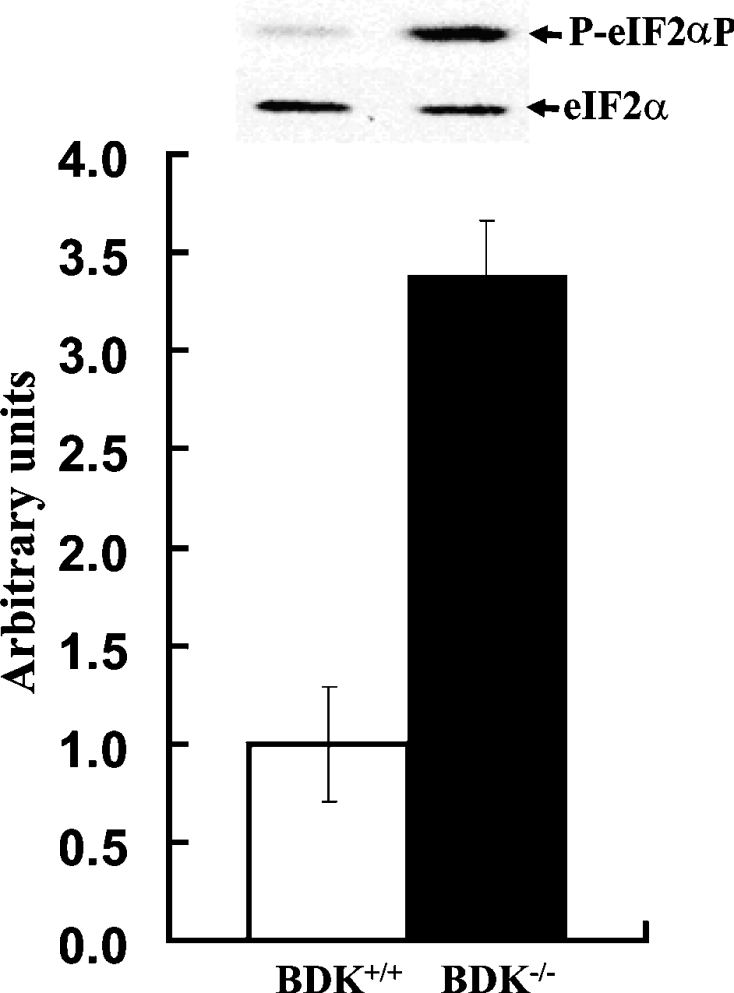
Phosphorylation (P-) of eIF2α on the inhibitory Ser51 is significantly increased whereas the total amount of eIF2α is not changed in the brains of 3-week-old BDK+/+ (open bars) and BDK−/− (closed bars) mice. Values are means±S.E.M., n=3 (*P<0.05).
DISCUSSION
Reduced levels of BCAAs and growth retardation occur in BDK−/− mice, indicating that phosphorylation is the most important mechanism for regulation of BCKDH activity. Other modes of regulation of BCAA catabolism, i.e. reduced expression of BCKDH components as observed in low protein fed rats [16] or feedback inhibition of the BCKDH by end products of the reaction [9,10], are unable to compensate for lack of regulation by phosphorylation. The action of BDK is therefore critical for the conservation of BCAAs. The finding that BCKDH is 100% active in all of the tissues of BDK−/− mice confirms that the phosphorylation state of the BCKDH is regulated by only one kinase, in contrast with the pyruvate dehydrogenase complex which is regulated by four kinases [22]. The BDK−/− mouse also provides a model for probing the affect of chronic BCAA deficiency on protein translation and growth. Most surprising was our finding that BDK−/− mice suffer convulsions, suggesting that these mice may prove useful as a model for human epilepsy and may provide insight into the role of BCAAs in normal brain function.
Activity state of BCKDH and the amount of E1 protein in tissues
The observation that BCKDH was 100% active in the liver of wild-type mice is consistent with previous work showing that BCKDH is fully active in the livers of rats fed a chow diet [23]. BDK is down-regulated by the high concentration of BCAAs present in chow diets and residual BDK activity is inhibited by α-keto-isocaproate. Low BDK activity in the liver of BDK+/+ mice and no BDK activity in the liver of BDK−/− animals accounts for the lack of difference in the activity states of BCKDH in the livers of these mice.
As expected from studies using rats [23], BCKDH was only partially active because of extensive phosphorylation in the brain, kidney, skeletal muscle and heart of BDK+/+ mice. In contrast, the BCKDH in these tissues of BDK−/− mice was fully active because the kinase is not present. Surprisingly, total BCKDH activity was further increased in these tissues of BDK−/− mice because of greater amounts of the E1 component. A similar phenomenon has been observed with low protein fed rats treated with the BDK inhibitor clofibrate [24]. Clofibrate increases BCKDH activity by inhibition of phosphorylation and by increasing the amount of E1 present in the liver [24]. A difference in stability of phosphorylated E1 compared with non-phosphorylated E1 towards proteolytic degradation could explain these findings. The affinity of E1 for the E2 component of the BCKDH is reduced by phosphorylation [25], perhaps making it more vulnerable to degradation by proteases. Phosphorylation of the pyruvate dehydrogenase complex on its E1α protein decreases the half-life of its E1 component [26]. Thus conditions that promote dephosphorylation may increase the stability and therefore increase the amount of BCKDH E1. In BDK−/− mice E1 is always dephosphorylated and may therefore be more stable, resulting in an increase in its amount.
Knocking out BDK lowers BCAAs
BCAT catalyses the first step of BCAA catabolism. The 2-oxoglutarate required can be limiting, but is normally available. BCKAs can be converted back into BCAAs by reversal of the reaction. BCKDH catalyses the oxidative decarboxylation of BCKA. BCKDH is normally only partially active, enabling accumulation of BCKAs and their conversion back to BCAAs. BCKDH is fully active in the tissues of BDK−/− mice, resulting in rapid oxidation of BCKAs, reduced regeneration of BCAAs and low levels of BCAAs. Findings with BDK−/− mice are consistent with the theory that BCKDH catalyses the rate-limiting step in the disposal of BCAAs and regulation of its activity by BDK-mediated phosphorylation is essential for conservation of BCAAs. Without the control normally exerted by phosphorylation, the activity of BCKDH should be able to completely eliminate BCAAs from the blood. The fact that a life-sustaining level of the BCAAs is maintained in BDK−/− mice suggests that the transamination of BCAAs to their keto acids limits their disposal, perhaps because of a limiting concentration of 2-oxoglutarate.
Threonine and methionine levels are maintained in BDK−/− mice
Threonine is converted into 2-oxobutyrate, a good substrate for the BCKDH [27], but threonine levels were well maintained in the blood of BDK−/− mice. This is probably because threonine oxidation occurs primarily in the liver [28]. Since BCKDH is fully active in the liver of BDK+/+ mice, loss of BDK activity has no additional effect on the activity of BCKDH in the liver of BDK−/− mice and therefore induces no difference in levels of threonine in these two groups of mice.
Two pathways are responsible for oxidative disposal of methionine [29]. The trans-sulfuration pathway produces 2-oxobutyrate, but this occurs in a late step of the pathway that is not likely to affect the overall rate of methionine utilization. The transamination pathway involves conversion of methionine into 4-methylthio-2-oxobutyrate, another good substrate for the BCKDH [19,20]. The finding of comparable levels of methionine in BDK−/− and BDK+/+ mice suggests that the rate of transamination of methionine to its 2-oxo acid limits this pathway. This would be consistent with previous indications that the transamination pathway is either not important in methionine catabolism or only functional when methionine is in great excess [29,30].
Growth inhibition in BDK−/− mice
Since BCAAs are indispensable amino acids, we predicted that BCAA deficiency due to uncontrolled oxidation would affect the growth of BDK−/− mice. Since the growth rate is fastest in foetal and early neonatal life, we expected BDK−/− mice would be most severely affected during these periods. However, no difference was observed in body weights of BDK+/+ and BDK−/− mice at birth nor during the first 2 weeks of life, suggesting that there was no limitation on protein synthesis in utero nor in the early neonatal period. It is known that the capacity of the neonatal rat for oxidizing leucine is very low at birth but increases over the next 14 days [31]. Assuming a similar pattern of development of the capacity for BCAA oxidation in mice, a low capacity for BCAA oxidation at birth may explain the lack of a difference in body weight during the neonatal period.
The growth curves of the BDK+/+ and BDK−/− mice exhibit interesting differences. A lag phase in the growth of BDK+/+ mice between 2 and 3 weeks of age coincides with a period of weight loss in BDK−/− mice. BDK+/+ mice experience a growth spurt immediately after the lag phase, whereas BDK−/− mice grow slowly for one more week before also experiencing a growth spurt. The growth pattern of BDK+/+ mice between the third and sixth weeks is similar to that of BDK−/− mice during the fourth and seventh weeks. The growth spurt is not only delayed by 1 week in BDK−/− mice, but also is not as robust as that of BDK+/+ mice. Growth arrest probably occurs in BDK−/− mice because the BCAAs are limiting for the growth due to uncontrolled oxidation by the BCKDH. Improved growth of the BDK−/− mice fed on a high protein diet supports this hypothesis. An increase in the dietary supply of BCAAs partially compensates for over-oxidation of BCAAs. The fact that brain and adipose are smaller in BDK−/− mice fed on a high protein diet suggests that regulation of BCKDH activity by BDK is critically important in these tissues even when dietary BCAAs are present in excess. The stunted growth of BDK−/− mice emphasizes the importance of conserving BCAAs by BCKDH phosphorylation during the most rapid period of growth in young animals.
Starvation for leucine inhibits protein translation via phosphorylation and inactivation of the protein translation factor eIF2α [21]. BDK−/− mice provide a model for studying the impact of reduced leucine on basal levels of protein synthesis. To begin to address this issue in the present study, the phosphorylation status of eIF2α was explored in tissues of BDK−/− mice. Hyperphosphorylation of eIF2α was observed in the brain but not in other tissues examined, arguing that regulation of translation via the eIF2α-mediated pathway is particularly sensitive to the concentration of BCAAs in nervous tissue.
BCAAs are required for synthesis of branched-chain fatty acids of mammalian hair [32]. Structural defects occur in the fibre cuticle of hair in patients with maple syrup urine disease [33]. Synthesis of 18-methyleicosanoic acid, a major branched-chain fatty acid covering the cuticle cells of hair [33], requires oxidation of isoleucine to its acyl-CoA ester by BCKDH. Although BDK−/− mice over-oxidize BCAAs which might be expected to increase the availability of substrate for the synthesis of these fatty acids, the amount of BCAAs supplied to cuticle cells is probably reduced because of the low concentration in the blood. A reduced supply of BCAAs to cuticle cells in BDK−/− mice may limit synthesis of branched-chain fatty acids and cause the lusterless appearance of their fur.
Differences in organ sizes in BDK−/− mice
The greater kidney and liver weights of BDK−/− mice is of interest. Consumption of a high protein diet has this same effect [34]. A high protein diet or amino-acid infusions [35] increase the glomerular filtration rate. Consumption of excess protein results in a greater metabolic energy demand in the liver for urea synthesis and in the kidney for urea excretion. Greater energy demand on an organ usually causes hypertrophy [34]. Low concentrations of BCAAs in BDK−/− mice limit protein synthesis and probably increase the rates of protein degradation and amino acid oxidation. These in turn place a greater demand for energy in the liver for urea synthesis and in the kidney for urea excretion. Feeding BDK−/− mice on a high protein diet supplies them with more amino acids and further increases total amino acid degradation. This increase in amino acid degradation causes an even greater increase in the kidney size.
Knocking out BDK causes epilepsy
Why BDK−/− mice display repetitive hind limb flexion and extension when hung by the tail and eventually develop epileptic seizures is not known. To our knowledge BCAA deficiency has not been reported to induce such signs of neurological dysfunction. On the other hand, chronic protein malnutrition promotes experimentally induced seizures in the rat [36] and isoleucine-deficient diets make rats more susceptible to the induction of seizures by the administration of pentylenetetrazole [37]. Epilepsy is more common in regions of the world where diets are often deficient in high quality proteins [38]. As observed in BDK−/− mice, a deficiency of indispensable amino acids induces hyperphosphorylation of eIF2α in the rat brain [39]. Phosphorylation of eIF2α in the brain has also been reported in pilocarpine-induced status epilepticus in mice [40] and human temporal lobe epilepsy [41]. Inhibition of protein translation initiation by eIF2α phosphorylation has been suggested to be responsible for neuronal cell injury and death in the latter condition [41]. On the other hand, Lu et al. [42] proposed that eIF2α phosphorylation is cytoprotective rather than damaging, because blocking protein synthesis initiation conserves energy and diverts glycine, cysteine and glutamate into glutathione synthesis. Phosphorylation of eIF2α also activates the expression of genes encoding enzymes involved in glutathione synthesis and protection against glutamate toxicity. It is therefore an open question as to whether increased phosphorylation of eIF2α in the brain of the BDK−/− mice is beneficial or detrimental. On one hand inhibition of the synthesis of a critical protein by phosphorylated eIF2α can be envisioned to cause cell damage that leads to the development of epilepsy. On the other, it is possible that eIF2α phosphorylation protects cells from epilepsy. As animals grow older, the efficiency of this protective mechanism may diminish and activation of eIF2α may no longer protect the brain against excitotoxicity that culminates in convulsions. Exploring the mechanism responsible for epilepsy in BDK−/− mice may provide an insight into the role of eIF2α phosphorylation.
A leucine–glutamate cycle operates between astrocytes and neurons [2,43]. Buffering of excess glutamate in neurons by α-keto-isocaproate derived from leucine may be critically important in preventing seizures [43]. Since leucine increases the threshold for picrotoxin-induced epilepsy [44] and reduces gluta-matergic neurotransmission [45], the low leucine concentration in the brain of BDK−/− mice may decrease the threshold for stress-induced epilepsy. Transamination of α-keto-isocaproate to leucine plays an important role in conversion of glutamate to 2-oxoglutarate in the brain [46]. Since completely active BCKDH in the brains of BDK−/− mice maintains a low concentration of α-ketoisocaproate, reduced transamination may promote glutamate accumulation in specific areas of the brain. In other words, because levels of leucine and its keto acid are reduced in the brains of BDK−/− mice, buffering of glutamate by transamination with α-keto-isocaproate may be inadequate during times of stress. Why seizures only develop after 6–7 months of age is a mystery. Perhaps buffering of glutamate by α-keto-isocaproate becomes more important with age.
As evident from the phenotype of BDK−/− mice, BDK plays an important role in conserving BCAAs by limiting their oxidation. Reduced concentrations of BCAAs have a variety of effects emphasizing the role played by these indispensable amino acids in a number of physiological processes. BDK−/− mice therefore provide a useful tool for investigating the mechanisms by which reduced BCAA concentrations cause defects in growth and development.
Acknowledgments
This work was supported by grants from the U.S. Public Health Service [NIH (National Institutes of Health) DK R01 19259 and DK R01 47844, to R.A.H.], the America Diabetes Association (to R.A.H.), the Grace M. Showalter Residuary Trust (to R.A.H.), the Riley Children's Foundation (to E.A.L.), and pre-doctoral (to M.A.J.) and post-doctoral (to N.H.J.) fellowships from the Midwest American Heart Association.
References
- 1.Kimball S. R., Jefferson L. S. Molecular mechanisms through which amino acids mediate signaling through the mammalian target of rapamycin. Curr. Opin. Clin. Nutr. Metab. Care. 2004;7:39–44. doi: 10.1097/00075197-200401000-00008. [DOI] [PubMed] [Google Scholar]
- 2.Hutson S. M., Lieth E., LaNoue K. F. Function of leucine in excitatory neurotransmitter metabolism in the central nervous system. J. Nutr. 2001;131:846S–850S. doi: 10.1093/jn/131.3.846S. [DOI] [PubMed] [Google Scholar]
- 3.Mordier S., Deval C., Bechet D., Tassa A., Ferrara M. Leucine limitation induces autophagy and activation of lysosome-dependent proteolysis in C2C12 myotubes through a mammalian target of rapamycin-independent signaling pathway. J. Biol. Chem. 2000;275:29900–29906. doi: 10.1074/jbc.M003633200. [DOI] [PubMed] [Google Scholar]
- 4.Lambert D. G., Hughes K., Atkins T. W. Insulin release from a cloned hamster B-cell line (HIT-T15): the effects of glucose, amino acids, sulphonylureas and colchicine. Biochem. Biophys. Res. Commun. 1986;140:616–625. doi: 10.1016/0006-291x(86)90776-x. [DOI] [PubMed] [Google Scholar]
- 5.Chuang D. T., Shih V. E. Maple syrup urine disease (branched-chain ketoaciduria) In: Scriverd C. R., Beaudet A. L., Sly W. S., Valle D., editors. Metabolic and Molecular Basis of Inherited Disease. 8th edn. New York: McGraw Hill; 2001. pp. 1971–2005. [Google Scholar]
- 6.Harris R. A., Popov K. M., Kedishvili N. Y., Zhao Y., Shimomura Y., Robbins B., Crabb D. W. Molecular cloning of the branched-chain α-keto acid dehydrogenase kinase and the CoA-dependent methylmalonate semialdehyde dehydrogenase. Adv. Enzyme Regul. 1993;33:255–265. doi: 10.1016/0065-2571(93)90022-6. [DOI] [PubMed] [Google Scholar]
- 7.Harris R. A., Paxton R., DePaoli-Roach A. A. Inhibition of branched chain α-ketoacid dehydrogenase kinase activity by α-chloroisocaproate. J. Biol. Chem. 1982;257:13915–13918. [PubMed] [Google Scholar]
- 8.Obayashi M., Sato Y., Harris R. A., Shimomura Y. Regulation of the activity of branched-chain 2-oxo acid dehydrogenase (BCODH) complex by binding BCODH kinase. FEBS Lett. 2001;491:50–54. doi: 10.1016/s0014-5793(01)02149-4. [DOI] [PubMed] [Google Scholar]
- 9.Parker P. J., Randle P. J. Partial purification and properties of branched-chain 2-oxo acid dehydrogenase of ox liver. Biochem. J. 1978;171:751–757. doi: 10.1042/bj1710751. [DOI] [PMC free article] [PubMed] [Google Scholar]
- 10.Boyer B., Odessey R. Kinetic characterization of branched chain keto acid dehydrogenase. Arch. Biochem. Biophys. 1991;285:1–7. doi: 10.1016/0003-9861(91)90321-9. [DOI] [PubMed] [Google Scholar]
- 11.Zambrowicz B. P., Friedrich G. A., Buxton E. C., Lilleberg S. L., Person C., Sands A. T. Disruption and sequence identification of 2000 genes in mouse embryonic stem cells. Nature. 1998;392:608–611. doi: 10.1038/33423. [DOI] [PubMed] [Google Scholar]
- 12.Obayashi M., Shimomura Y., Nakai N., Jeoung N. H., Nagasaki M., Murakami T., Sato Y., Harris R. A. Estrogen controls branched-chain amino acid catabolism in female rats. J. Nutr. 2004;134:2628–2633. doi: 10.1093/jn/134.10.2628. [DOI] [PubMed] [Google Scholar]
- 13.Krebs H. A., Henseleit K. Untersuchungen uber die Harnstoff-bildung imTierkorper. Hoppe-Seyler's Z. Physiol. Chem. 1932;210:33–66. [Google Scholar]
- 14.Livesey G., Lund P. Determination of branched-chain amino and keto acids with leucine dehydrogenase. Methods Enzymol. 1988;166:3–10. doi: 10.1016/s0076-6879(88)66003-4. [DOI] [PubMed] [Google Scholar]
- 15.Racine R. J. Modification of seizure activity by electrical stimulation. II. Motor seizure. Electroencephalogr. Clin. Neurophysiol. 1972;32:281–294. doi: 10.1016/0013-4694(72)90177-0. [DOI] [PubMed] [Google Scholar]
- 16.Zhao Y., Popov K. M., Shimomura Y., Kedishvili N. Y., Jaskiewicz J., Kuntz M. J., Kain J., Zhang B., Harris R. A. Effect of dietary protein on the liver content and subunit composition of the branched-chain α-keto acid dehydrogenase complex. Arch. Biochem. Biophys. 1994;308:446–453. doi: 10.1006/abbi.1994.1063. [DOI] [PubMed] [Google Scholar]
- 17.Yeaman S. J. The 2-oxo acid dehydrogenase complexes: recent advances. Biochem. J. 1989;257:625–632. doi: 10.1042/bj2570625. [DOI] [PMC free article] [PubMed] [Google Scholar]
- 18.Martha J., Kuntz, Paxton R., Shimomura Y., Goodwin G. W., Harris R. A. Phosphorylation affects the mobility of the E1 α-subunit of branched-chain 2-oxo acid dehydrogenase on sodium dodecyl suphate/polyacrylamide-gel electrophoresis. Biochem. Soc. Trans. 1986;14:1077–1078. [Google Scholar]
- 19.Jones S. M., Yeaman S. J. Oxidative decarboxylation of 4-methylthio-2-oxobutyrate by branched-chain 2-oxo acid dehydrogenase complex. Biochem. J. 1986;237:621–623. doi: 10.1042/bj2370621. [DOI] [PMC free article] [PubMed] [Google Scholar]
- 20.Paxton R., Scislowski P. W., Davis E. J., Harris R. A. Role of branched-chain 2-oxo acid dehydrogenase and pyruvate dehydrogenase in 2-oxobutyrate metabolism. Biochem. J. 1986;234:295–303. doi: 10.1042/bj2340295. [DOI] [PMC free article] [PubMed] [Google Scholar]
- 21.Hinnebusch A. G. Mechanism and regulation of initiator methionyltRNA binding to ribosomes. In: Sonenberg N., Hershey J. W. B., Mathews M. B., editors. Translational Control of Gene Expression. Cold Spring Harbor, New York: Cold Spring Harbor Laboratory Press; 2000. pp. 185–243. [Google Scholar]
- 22.Harris R. A., Popov K. M., Zhao Y., Kedishvili N. Y., Shimomura Y., Crabb D. W. A new family of protein kinases: the mitochondrial protein kinases. Adv. Enzyme Regul. 1995;35:147–162. doi: 10.1016/0065-2571(94)00020-4. [DOI] [PubMed] [Google Scholar]
- 23.Harris R. A., Powell S. M., Paxton R., Gillim S. E., Nagae H. Physiological covalent regulation of rat liver branched-chain α-keto acid dehydrogenase. Arch. Biochem. Biophys. 1985;243:542–555. doi: 10.1016/0003-9861(85)90531-4. [DOI] [PubMed] [Google Scholar]
- 24.Kobayashi R., Murakami T., Obayashi M., Nakai N., Jaskiewicz J., Fujiwara Y., Shimomura Y., Harris R. A. Clofibric acid stimulates branched-chain amino acid catabolism by three mechanisms. Arch. Biochem. Biophys. 2002;407:231–240. doi: 10.1016/s0003-9861(02)00472-1. [DOI] [PubMed] [Google Scholar]
- 25.Cook K. G., Bradford A. P., Yeaman S. J. Resolution and reconstitution of bovine kidney branched-chain 2-oxo acid dehydrogenase complex. Biochem. J. 1985;225:731–735. doi: 10.1042/bj2250731. [DOI] [PMC free article] [PubMed] [Google Scholar]
- 26.Morten K. J., Caky M., Matthews P. M. Stabilization of the pyruvate dehydrogenase E1α subunit by dichloroacetate. Neurology. 1998;51:1331–1335. doi: 10.1212/wnl.51.5.1331. [DOI] [PubMed] [Google Scholar]
- 27.House J. D., Hall B. N., Brosnan J. T. Threonine metabolism in isolated rat hepatocytes. Am. J. Physiol. Endocrinol. Metab. 2001;281:E1300–E1307. doi: 10.1152/ajpendo.2001.281.6.E1300. [DOI] [PubMed] [Google Scholar]
- 28.Le Floc'h N., Thibault J. N., Seve B. Tissue localization of threonine oxidation in pigs. Br. J. Nutr. 1997;77:593–603. doi: 10.1079/bjn19970059. [DOI] [PubMed] [Google Scholar]
- 29.Livesey G. Methionine degradation: anabolic and catabolic. Trends Biochem Sci. 1984;9:27–29. [Google Scholar]
- 30.Makar T. K., Nedergaard M., Preuss A., Hertz L., Cooper A. J. Glutamine transaminase K and omega-amidase activities in primary cultures of astrocytes and neurons and in embryonic chick forebrain: marked induction of brain glutamine transaminase K at time of hatching. J. Neurochem. 1994;62:1983–1988. doi: 10.1046/j.1471-4159.1994.62051983.x. [DOI] [PubMed] [Google Scholar]
- 31.Zhao Y., Denne S. C., Harris R. A. Developmental pattern of branched-chain 2-oxo acid dehydrogenase complex in rat liver and heart. Biochem. J. 1993;290:395–399. doi: 10.1042/bj2900395. [DOI] [PMC free article] [PubMed] [Google Scholar]
- 32.Jones L. N., Rivett D. E. The role of 18-methyleicosanoic acid in the structure and formation of mammalian hair fibres. Micron. 1997;28:469–485. doi: 10.1016/s0968-4328(97)00039-5. [DOI] [PubMed] [Google Scholar]
- 33.Jones L. N., Peet D. J., Danks D. M., Negri A. P., Rivett D. E. Hairs from patients with maple syrup urine disease show a structural defect in the fiber cuticle. J. Invest. Dermatol. 1996;106:461–464. doi: 10.1111/1523-1747.ep12343618. [DOI] [PubMed] [Google Scholar]
- 34.Hammond K. A., Janes D. N. The effects of increased protein intake on kidney size and function. J. Exp. Biol. 1998;201:2081–2090. doi: 10.1242/jeb.201.13.2081. [DOI] [PubMed] [Google Scholar]
- 35.Graf H., Stummvoll H. K., Luger A., Prager R. Effect of amino acid infusion on glomerular filtration rate. N. Engl. J. Med. 1983;308:159–160. doi: 10.1056/NEJM198301203080318. [DOI] [PubMed] [Google Scholar]
- 36.Forbes W. B., Stern W. C., Tracy C. A., Resnick O., Morgane P. J. Effect of chronic protein malnutrition on experimentally induced seizures in the rat. Exp. Neurol. 1978;62:475–481. doi: 10.1016/0014-4886(78)90069-9. [DOI] [PubMed] [Google Scholar]
- 37.Gietzen D. W., Dixon K. D., Truong B. G., Jones A. C., Barrett J. A., Washburn D. S. Indispensable amino acid deficiency and increased seizure susceptibility in rats. Am. J. Physiol. 1996;271:R18–R24. doi: 10.1152/ajpregu.1996.271.1.R18. [DOI] [PubMed] [Google Scholar]
- 38.Osuntokun B. O. The pattern of neurological illness in tropical Africa. Experience at Ibadan, Nigeria. J. Neurol. Sci. 1971;12:417–442. doi: 10.1016/0022-510x(71)90110-9. [DOI] [PubMed] [Google Scholar]
- 39.Gietzen D. W., Ross C. M., Hao S., Sharp J. W. Phosphorylation of eIF2α is involved in the signaling of indispensable amino acid deficiency in the anterior piriform cortex of the brain in rats. J. Nutr. 2004;134:717–723. doi: 10.1093/jn/134.4.717. [DOI] [PubMed] [Google Scholar]
- 40.Carnevalli L. S., Pereira C. M., Jaqueta C. B., Alves V. S., Paiva V. N., Vattem K. M., Wek R. C., Mello L. E., Castilho B. A. Phosphorylation of the α subunit of translation initiation factor 2 by PKR mediates protein synthesis inhibition in the mouse brain during status epilepticus. Biochem. J. 2006;397:187–194. doi: 10.1042/BJ20051643. [DOI] [PMC free article] [PubMed] [Google Scholar]
- 41.Petrov T., Rafols J. A., Alousi S. S., Kupsky W. J., Johnson R., Shah J., Shah A., Watson C. Cellular compartmentalization of phosphorylated eIF2α and neuronal NOS in human temporal lobe epilepsy with hippocampal sclerosis. J. Neurol. Sci. 2003;209:31–39. doi: 10.1016/s0022-510x(02)00461-6. [DOI] [PubMed] [Google Scholar]
- 42.Lu P. D., Jousse C., Marciniak S. J., Zhang Y., Novoa I., Scheuner D., Kaufman R. J., Ron D., Harding H. P. Cytoprotection by pre-emptive conditional phosphorylation of translation initiation factor 2. EMBO J. 2004;23:169–179. doi: 10.1038/sj.emboj.7600030. [DOI] [PMC free article] [PubMed] [Google Scholar]
- 43.Yudkoff M. Brain metabolism of branched-chain amino acids. Glia. 1997;21:92–98. doi: 10.1002/(sici)1098-1136(199709)21:1<92::aid-glia10>3.0.co;2-w. [DOI] [PubMed] [Google Scholar]
- 44.Skeie B., Petersen A. J., Manner T., Askanazi J., Jellum E., Steen P. A. Branched-chain amino acids increase the seizure threshold to picrotoxin in rats. Pharmacol. Biochem. Behav. 1992;43:669–671. doi: 10.1016/0091-3057(92)90393-t. [DOI] [PubMed] [Google Scholar]
- 45.Dufour F., Nalecz K. A., Nalecz M. J., Nehlig A. Metabolic approach of absence seizures in a genetic model of absence epilepsy, the GAERS: study of the leucine-glutamate cycle. J. Neurosci. Res. 2001;66:923–930. doi: 10.1002/jnr.10086. [DOI] [PubMed] [Google Scholar]
- 46.Yudkoff M., Daikhin Y., Nissim I., Horyn O., Lazarow A., Nissim I. Metabolism of brain amino acids following pentylenetetrazole treatment. Epilepsy Res. 2003;53:151–162. doi: 10.1016/s0920-1211(02)00260-7. [DOI] [PubMed] [Google Scholar]