Abstract
In biomineralized tissues such as bone, the recurring structural motif at the supramolecular level is an anisotropic stiff inorganic component reinforcing the soft organic matrix. The high toughness and defect tolerance of natural biomineralized composites is believed to arise from these nanometer scale structural motifs. Specifically, load transfer in bone has been proposed to occur by a transfer of tensile strains between the stiff inorganic (mineral apatite) particles via shearing in the intervening soft organic (collagen) layers. This raises the question as to how and to what extent do the mineral particles and fibrils deform concurrently in response to tissue deformation. Here we show that both mineral nanoparticles and the enclosing mineralized fibril deform initially elastically, but to different degrees. Using in situ tensile testing with combined high brilliance synchrotron X-ray diffraction and scattering on the same sample, we show that tissue, fibrils, and mineral particles take up successively lower levels of strain, in a ratio of 12:5:2. The maximum strain seen in mineral nanoparticles (≈0.15–0.20%) can reach up to twice the fracture strain calculated for bulk apatite. The results are consistent with a staggered model of load transfer in bone matrix, exemplifying the hierarchical nature of bone deformation. We believe this process results in a mechanism of fibril–matrix decoupling for protecting the brittle mineral phase in bone, while effectively redistributing the strain energy within the bone tissue.
Keywords: biomineralization, deformation mechanisms, in situ tensile testing, micromechanics of bone, synchrotron radiation
Bone is a hierarchically structured composite (1, 2) which at the nanometer range can be described as a combination of a stiff inorganic mineral phase of carbonated apatite together with a softer organic phase (principally type I collagen, with a small amount of proteoglycans and noncollageneous proteins) (1, 3). The collagen forms ≈100- to 200-nm-diameter fibrils, with thin elongated mineral platelets inside and on the surface (4). These mineralized fibrils are then arranged into higher levels of structural motifs such as fibril arrays and lamellae. Clearly, an understanding of the function of the higher organization levels (1) requires an understanding of the nanometer level material performance (3).
Although a detailed quantitative description of the deformation mechanisms at the nanoscale remains unclear, several mechanisms have been proposed to model bone deformation. These include shear transfer between mineral particles via intermediate ductile organic layers (5), slippage at the collagen–mineral interface (6), phase transformation of the mineral phase (7), sacrificial bond disruption between fibrils (8), microcracking (9), and uncracked ligament bridging (10).
At the molecular level, changes in the lattice spacings of the mineral phase (11, 12) have been described, showing prestrains and stress concentrations in the apatite phase. At the fibrillar level, Gupta and coworkers (13, 14) measured strain by tracking shifts in small angle X-ray diffraction peaks, when stress was applied to samples of parallel fibered bone. They showed that fibrillar strain is about half the tissue strain (14), which suggests that shearing occurs in the thin interfibrillar matrix layers. Beyond the yield point, the fibrillar strain tends toward a constant value, implying that decoupling of the fibrils and extrafibrillar matrix develops (13).
In this study, we combined in situ tensile testing of fibrolamellar bone with simultaneous small-angle X-ray scattering (SAXS) and wide-angle X-ray diffraction (WAXD) to measure the tissue, fibrillar, and mineral strain concurrently during tensile loading of single fibrolamellar bone packets. We show that the fibrils and the intrafibrillar mineral takes up successively lower fractions of the tissue strain in a ratio of 12:5:2, and both fibril and mineral strain develop as predicted by a lap-joint model for load transfer (5).
Results
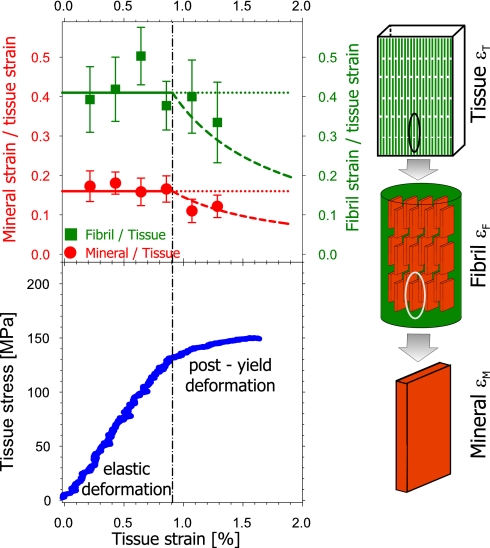
Sample tissue strain (εT) was monitored and compared with fibrillar and mineral strain (For details see Materials and Methods). Fig. 1 shows the variation of the ratios of fibril strain (εF) to tissue strain and mineral strain (εM) to tissue strain as a function of tissue strain. Both are shown as ratios, thus correcting for intersample variability. Also shown is a representative stress–strain curve for one bone sample and schematic illustrations of the bone model we are interpreting. Data points represent binned averages over a set of samples kept wet during testing (n = 29) (see details in Supporting Text, which is published as supporting information on the PNAS web site). Before the sample yield point (yield strain εTY = 0.91% for the example in Fig. 1 Lower) the elastic response results in an approximately constant fibril-to-tissue strain ratio (εF/εT) as well as a constant mineral-to-tissue strain ratio (εM/εT). We find that εF/εT is approximately constant at 0.41, whereas εM/εT stays almost constant at 0.16. Note how, for constant ratios of εF/εT and εM/εT below the yield point, the ratios should ideally form a straight line, as sketched by the horizontal colored lines in the upper figure. Conversely, if εF and εM do not increase further beyond the yield point, the ratios would decrease along concave downward lines, as indicated by the dashed lines.
Fig. 1.
Change in tissue, fibril, and mineral particle strain in bone with applied stress. (Upper) Ratio of fibril strain to tissue strain (εF/εT) and mineral strain to tissue strain (εM/εT), averaged over n = 29 samples. Solid lines are guides to the eye, showing the expected constant strain ratio before yield. Dashed lines show how the ratio would vary if the fibril and mineral strains remain constant beyond the yield point, marked with the vertical dashed line. Error bars are standard errors of the mean. (Lower) Typical stress–strain curve of bovine fibrolamellar bone packet, showing an initial elastic increase followed by a reduced slope beyond the elastic/inelastic transition at εTY = 0.91%. The schematic on the right illustrates the different hierarchical length scales at which strain is being measured simultaneously (tissue, fibril, and mineral nanoparticle).
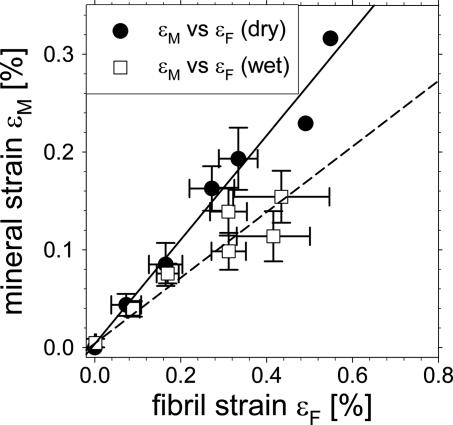
We find that mineral strain is linearly correlated to fibril strain, as shown in Fig. 2. This figure plots the binned mineral strain εM versus the binned fibril strain εF, both for the wet samples (n = 29) as well as a set of dry samples (n = 7). The slopes are calculated from linear regressions. The trends in εM/εF (given by the slope of the regression lines) depend on the hydration state of the samples. In hydrated samples (n = 29), the trend is ≈0.35, whereas for dry samples (n = 7) the trend is ≈0.53. Table 1 shows the fibril–tissue, mineral–fibril, and mineral–tissue regression slope values in both wet and dry states. It can be seen that the strain fraction contained in the embedded element (mineral within each fibril versus the mineralized fibers in the tissue) is smaller for the wet samples as compared with the dry samples. The slope of εF/εT is similar for dry and wet samples (within statistical error).
Fig. 2.
Correlation between mineral and fibril strain. Fibril and mineral strain are first binned in regular intervals of tissue strain, and then plotted versus each other. Open squares: wet, n = 29 samples, and filled circles: dry, n = 7 samples. Straight lines give linear regressions on the two data sets, and regression slopes give the mineral particle strain fraction in the enclosing fibril. Mineral particles take up a lower strain fraction in the fibrils when the tissue is wet. Slope for wet samples = 0.34 ± 0.15 and for dry samples = 0.53 ± 0.04. Error bars in the graph are standard errors of mean.
Table 1.
εF/εT, εM/εT, and εM/εF, calculated from linear regressions of binned data shown for wet and dry samples
| Parameter | Wet samples | Dry samples |
|---|---|---|
| Fibril to tissue strain, εF/εT | 0.41 ± 0.06 | 0.41 ± 0.02 |
| Mineral to tissue strain, εM/εT | 0.16 ± 0.01 | 0.24 ± 0.02 |
| Mineral to fibril strain, εM/εF | 0.34 ± 0.15 | 0.53 ± 0.0 |
| Elastic modulus ET, GPa | 11.5 ± 3.7 | 13.9 ± 3.4 |
| Stress concentration κ | 1.46 ± 0.15 | 1.58 ± 0.14 |
Elastic modulus ET is the average over wet (n = 29) and dry (n = 7) samples, respectively. Stress concentration factor κ calculated from (EM/ET) × 〈εM/εT〉 for each sample and averaged over all samples (see Fig. 2); errors represent standard errors of mean.
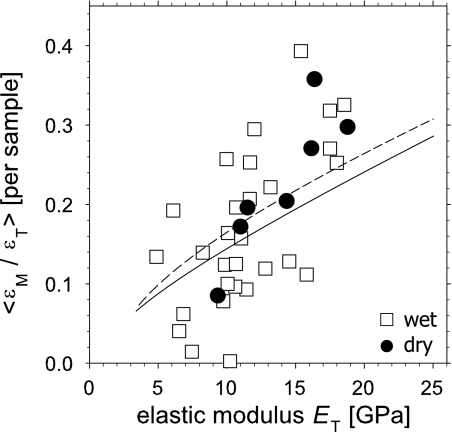
To bridge the gap between the nanoscale components and the tissue material properties, we compare the average mineral strain ratio for a given sample with its elastic modulus ET. We do this by calculating the slopes of linear regressions of εM vs. εT for each sample data set (regressions are made over the entire stress range up to fracture, and not just in the linear range). These slopes, denoted 〈εM/εT〉, are then compared with the elastic modulus ET of each sample. The data in Fig. 3 shows a significant but not close (P < 0.001, r2 = 0.39) linear correlation between 〈εM/εT〉 and the macroscopic elastic modulus ET. The equation for the linear correlation is 〈εM/εT〉 = −0.0232 + 0.0139 ET. For dry samples, the correlation is significant (P < 0.01, r2 = 0.79) and the equation is 〈εM/εT〉 = −0.0986 + 0.0196 ET. The average elastic modulus for wet samples was 11.5 ± 3.7 GPa, whereas for dry samples the modulus was higher on average: 13.9 ± 3.4 GPa), as given in Table 1. The average mineral strain ratios 〈εM/εT〉 for wet and dry samples was 0.17 ± 0.10 and 0.23 ± 0.09, respectively (errors are standard deviations).
Fig. 3.
Mineral strain ratio as a function of sample elastic modulus. The average mineral strain ratio 〈εM/εT〉 is plotted, per sample, versus the elastic modulus ET. Open squares: wet, n = 29 samples and filled circles: dry, n = 7 samples. Lines show the expected nonlinear correlation between mineral strain fraction 〈εM/εT〉 and elastic modulus ET when stresses are transferred within and between the mineralized fibrils in a hierarchical staggered arrangement (see Fig. 4 and Eq. 1). Solid, wet collagen; dashed, dry collagen.
Finally, we consider the stress concentration factor κ (11, 12), which is the ratio of stress in the mineral particles relative to stress in the tissue as a whole. Because mineral particles are elastic, we can calculate κ from (EM × εM)/(εT × ET), where EM and ET are the mineral modulus along the (0002) axis (≈100 GPa) and the sample tissue modulus, respectively. We make the approximation that κ ≈ EM × (〈εM/εT〉/ET). The results are given in Table 1, and show that for dry samples, the stress concentration is slightly larger (1.58) compared with wet samples (1.46).
Discussion
Our results directly demonstrate that tensile stress induces a coupled and cooperative deformation process at the nanometer level in the structural hierarchy of bone. In situ tensile testing with synchrotron X-ray diffraction measurements allows quantification of three hierarchical levels of strains. At the tissue, fibrillar, and mineral particle levels, the strains decrease in a ratio of ≈12:5:2. This hierarchical gradation, where stiff elements at smaller length scales take up less strain than those at larger scales (15), is numerically consistent with measurements of fibrillar strain in partially mineralized tendon (16) and parallel fibered bone (14). The general construction principle is of joining stiffer elements by a softer matrix to form the next hierarchical level (15). This results in composites that sustain large deformation, despite being composed of essentially undeformable particles at the nanoscale.
We note the striking observation that the strain εM in the mineral platelets has an average maximum value of 0.15–0.20% (Fig. 2). The fracture strain of bulk microporous apatite estimated from the known strength (≈100 MPa; ref. 17) and the tensile modulus (≈100 GPa; ref. 18) is ≈0.10%. Therefore, we conclude that the mineral nanoparticles in bone can sustain up to 2 times the fracture load of hydroxyapatite. Such an increase in strength is most likely due to the defect insensitivity of nanostructured biomineralized tissues (15, 19) implied by Griffith's theory (20).
Our measured stress concentration factor κ lies between 1.45 and 1.60. These values are somewhat lower than the values 2.2 ± 0.1 found by tensile loading of bovine femora (12) and the value 2.8 found in compression of canine fibulae (11). We do not have a clear explanation for the difference between these results. It is possible that the difference in bone type, the smaller sample geometry of single bone packets, the loading mode (tensile versus compressive in ref. 11), and lower degrees of hydration in previous experiments (11, 12) may all play an important role.
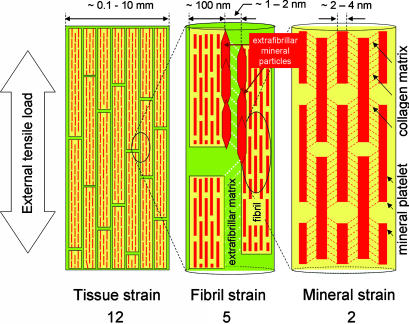
Load transfer between the mineral platelets has been suggested to occur by shear transfer in the organic matrix (5, 21), due to the high aspect ratio and large mismatch in mechanical properties between mineral particles (E ≈ 100 GPa) and collagen (E ≈ 1–2 GPa). Our measured result of a 5:2 ratio of fibrillar to mineral strain supports this hypothesis, as seen by the difference between fibril and mineral strain. Therefore, we exclude a parallel or Voigt model (20) of equal strains in the collagen and mineral phase. In our current interpretation of bone deformation at the nanoscale, the stresses are transferred in a zigzag manner, as sketched schematically in Fig. 4.
Fig. 4.
Schematic model for bone deformation in response to external tensile load at three levels in the structural hierarchy: at the tissue level (Left), fibril array level (Center), and mineralized collagen fibrils (Right). (Center) The stiff mineralized fibrils deform in tension and transfer the stress between adjacent fibrils by shearing in the thin layers of extrafibrillar matrix (white dotted lines show direction of shear in the extrafibrillar matrix). The fibrils are covered with extrafibrillar mineral particles, shown only over a selected part of the fibrils (red hexagons) so as not to obscure the internal structure of the mineralized fibril. (Right) Within each mineralized fibril, the stiff mineral platelets deform in tension and transfer the stress between adjacent platelets by shearing in the interparticle collagen matrix (red dashed lines indicate shearing qualitatively and do not imply homogeneous deformation).
The observed differences between wet and dry bone (Table 1) emphasize the sensitivity of the load transfer mechanisms and stiffness to the state of the organic matrix. A stiffer organic matrix would lead to more effective load transfer to the mineral platelets and that, in turn, would cause the composite to be stiffer, as well as increase the strain fraction carried by the mineral phase. In our experiments, a drying of the collagen (and its subsequent stiffening) increased εM/εT and ET (Table 1). It may be speculated that structural changes in the organic matrix, known to occur in certain bone diseases (22, 23), could make the bone stiffer and more predisposed to fracture in this manner: simply by overloading the mineral phase.
Our samples express a substantial biological variance in mechanical properties, with elastic moduli ranging from ≈5 to ≈23 GPa. We believe this arises due to intersample variability in mineral content and fiber orientation of the small samples that were used. A variation of elastic modulus from <5 GPa to >32 GPa in low-porosity samples (<5%) has been reported within a very narrow range of 23–28 weight % calcium, equivalent to a mineral volume fraction of 0.40–0.52 (24). However, the average moduli of our samples of 11.5 ± 3.7 GPa (wet) and 13.9 ± 3.4 GPa (dry) are consistent with other measurements of macroscopic specimens (25, 26).
The scheme of hierarchical bone deformation sketched in Fig. 4 involves a load transfer at the mineral/collagen and fibril/extrafibrillar matrix interface. As a result, not only are the strains at the various scales different, but the tissue stress is a weighted sum of contributions from each component, similar to a series (Reuss) composite model (20). Consequently, the effective tissue modulus can be written in terms of the strains at the different hierarchical levels (15) and the material parameters at the nanoscale as follows
Here, ΦM is the mineral volume fraction in the fibril and EM = 100 GPa and EC = 2.0 GPa (wet) and 4.0 GPa (dry) are the tensile moduli of the mineral and collagen phase in the mineralized fibril. Eef is a contribution from the extrafibrillar matrix. The mineral strain ratio εM/εT can also be written in terms of these material parameters (Supporting Text). As stated above, we believe variation of the intrafibrillar mineral content ΦM across samples leads to the spread in ET values in Fig. 3. Therefore, if we allow the mineral content ΦM to range from 0.0 to 1.0 in Eq. 1 as well as in the relation for εM/εT (keeping all other parameters constant), we find a nonlinear positive correlation between model predictions for εM/εT versus ET (solid and dashed curves in Fig. 3), similar to what is seen experimentally.
We have thus shown quantitatively that the hierarchical design of bone (mineral platelets versus collagen, and fibril versus extrafibrillar matrix) at the nanometer scale leads to a hierarchical and coupled deformation mechanism at the nanoscale under tensile load. This appears to increase the maximum strain of the mineral platelets by preventing crack nucleation below a critical size (19). The organic matrix plays a crucial role in the amount of strain transferred to the mineral platelets. We believe that the effective load sharing mechanism between mineral and collagen may result in damage shielding, which prevents the fibrils from being exposed to excessive strains. The hierarchy of deformation mechanisms observed in bone may guide us in designing new strong nanocomposite materials.
Materials and Methods
Sample Preparation.
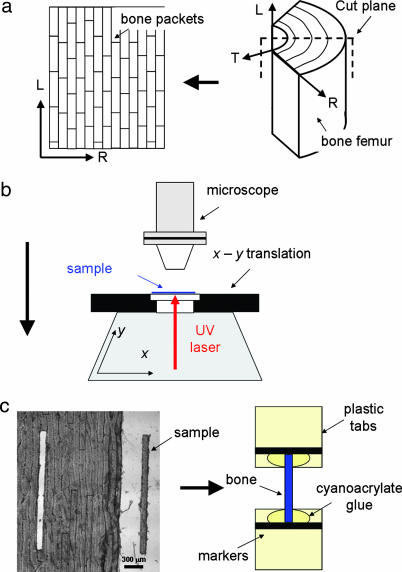
Fresh bovine bone was obtained from the femur of a 12-month-old ox, and all soft tissue was removed. The bone was sawed into pie-shaped sections (Fig. 5a) with continuous water irrigation and wrapped in phosphate-buffered saline (PBS)-soaked gauzes. The sections were stored at −22°C until further use. For the experiments, thawed bone sections were cut by using a inner blade 300-μm saw (Leica SP1600, Leica Microsysteme Vertrieb, Bensheim, Germany) producing 50-μm-thick × ≈1 cm × ≈1 cm sheets along the radial-longitudinal plane (Fig. 5a Left). These bone sheets were placed on a microscope slide in PBS, covered with a glass-slip and cut using a UV-laser microdissection system (P.A.L.M MicroBeam C, P.A.L.M Microlaser Technologies AG, Bernried, Germany). Samples with dimensions 50 μm × 150 μm × 3 mm were produced, constantly ensuring that each sample was confined to a single fibrolamellar bone packet (Fig. 5c Left). Plastic tabs (≈8 mm × 2 mm) were glued to both ends of every sample. These were used as grips during loading, marked with horizontal black lines serving as guides for optical tracking of sample elongation by video extensometry (14, 27). (See Fig. 5c Right and Fig. 6Inset A.)
Fig. 5.
Sample preparation setup. (a) Appearance of 50- to 100-μm-thick and ≈1-cm-wide fibrolamellar bone sheets (Left) after sectioning from pie-shaped sectors of bovine femoral bone (Right). L (longitudinal, parallel to bone long axis), R (radial, from center of bone to periosteum), and T (tangential to bone surface) denote the approximate coordinate system used. (b) A UV laser (1–2 μm diameter at focus) is rastered repeatedly (up to 10 times) over the bone sheets in the form of the elongated sample shape, until the sample is separated from the surrounding tissue, and can be removed. (c) (Left) A typical sample lying next to the source sheet from which it was taken. (Right) Schematic of sample mounted on plastic grips with cyanoacrylate glue.
Fig. 6.
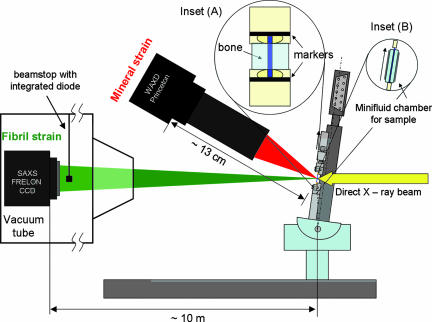
In-beam microtensile schematic: Microtensile setup is inclined to the direct X-ray beam at 1/2 (2θ[0002]) ≈ 8.3° [where 2θ[0002] is the Bragg angle for (0002) hydroxyapatite c-axis reflection at λ = 0.0995 nm] to ensure that the strain from only the crystallites with c-axis along the tensile axis of the sample is measured. Sample is kept wet by enclosing within cellophane slips containing a water drop (Inset B). Tissue strain εT is determined by tracking marker lines (Inset A) in images taken by a CCD camera (not shown). SAXS and WAXD 2D images are recorded simultaneously by the FRELON 2000 CCD and Princeton Instruments CCD detectors respectively. The integrated diode on the beamstop is used for intensity normalization.
Microtensile Testing.
The samples were mounted in a custom built microtensile stage (Fig. 6), fitted with a 250-g load cell (ALD MiniUTC, A. L. Design, Buffalo, NY) and a DC motor translation stage (M-126.DG, Physik Instrumente, Karlsruhe, Germany). Tissue strain εT was measured as the percent increase of distance between the two optical markers on the grips at either end of the sample. This was determined from images obtained by using a Basler A101f monochrome CCD camera (Basler Vision Technologies, Ahrensburg, Germany). The microtensile stage and video optics were controlled through custom software (Labview V. 7.0, National Instruments, München, Germany). The machine compliance was measured to be 0.42 μm/N by calculating the measured stiffness of 1, 2, 10, and 20 layers of 1 mm wide × 26 μm thick × 3 mm long aluminum foil strips and extrapolating to infinite stiffness of the aluminium layer (Supporting Text). For typical stress-strain curves, the compliance correction reduces the measured strain by ≈1–2%.
Measuring strain from markers placed just beyond the glue bonds of the bone to the sample (as opposed to placing markers directly on the sample) can introduce an error in the tissue strain measurement. As described in the Supporting Text, this was corrected for by carrying out a series of control experiments in the lab where we were able to place markers both on the grips beyond the glue bonds as well as directly on the bone. We find that the grip marker method results in a slight underestimate of the tissue strain, and that the values have to be multiplied by a factor of 1.19 to get sample strain (Supporting Text). All tissue strain values were corrected by this factor.
To keep the samples wet during the test, two pieces of thin cellophane (2 mm × 2 mm wide) were carefully placed on front and back sides of the sample, held in place by a drop of water. The cellophane was sufficiently light to stay hanging on the sample placed in the beam, due to the surface tension of the water. With water droplets surrounding each bone sample in this manner, we ensured the wetness of the samples within evaporation proof minifluid chambers throughout each experiment (Fig. 6 Inset B). In some experiments the cellophane chamber was substituted by an automated syringe drip system, which applied water to the sample at user specified intervals.
Synchrotron X-Ray Diffraction and Scattering Measurements.
The microtensile stage was mounted in beamline ID2, at the European Synchrotron Radiation Facility (ESRF, Grenoble, France) (28). Synchrotron radiation was used to measure the SAXS and WAXD patterns. In the SAXS region of reciprocal space, the meridional stagger D of collagen molecules in the fibril lead to an axial diffraction pattern. Percent changes in the positions of the peaks of such diffraction patterns provide measures of the fibril strain εF (14). The mineral particles consist of apatite, which has a hexagonal cubic structure with the c-axis oriented predominantly along the fibril direction (29). The fibril direction is, on average, along the tensile direction in the sample, as seen from SAXS images of the fibril meridional pattern (14). In the WAXD region of reciprocal space, if samples are oriented at 1/2 the Bragg diffraction angle 2θ[0002] to the direct X-ray beam, as shown in Fig. 6, then percentage shifts in the position of the (0002) peak intensity along the vertical direction give the mineral strain εM along the tensile stretch direction.
The beam wavelength was λ = 0.995 Å, and beam cross-section at the sample was ≈200 μm wide × 40 μm high. A FRELON 2000 CCD detector connected to an X-ray image intensifier TTE (TH 49–427 from Thomson CSF, now Thales Electron Devices, Moirans, France) was used for reading the SAXS pattern, and a Princeton Instruments (Princeton, NJ) CCD detector with Proxitronic Image Intensifier was used for reading the WAXD pattern (30). A beamstop with integrated diode was used for normalization of the spectra to absolute scattering intensities (28). SAXS and WAXD frames were collected concurrently by using SPEC (Certified Scientific Software, Boston, MA) with automatic correction for dark field current (30). Spatial distortion correction for the SAXS patterns was done by putting a grid in front of the detector (grid spacing of 5 mm) and obtaining the image at the position of the grid (31). Sample to detector distance for the FRELON 2000 detector was 10.0 m ± 3 mm measured with linear encoder and mechanical measurement (32) and for the Princeton Instruments detector the distance was 12.94 ± 0.2 cm, measured with a calibration standard (PBBA, or parabromobenzoic acid) (30). SAXS data frames had a resolution of 1,024 × 1,024 pixels and a pixel size of 164.4 × 164.7 μm2. WAXD data frames had a pixel resolution of 896 (vertical) × 416 (horizontal) and pixel size of 86.2 × 86.9 μm2.
Samples were stretched to failure at a constant motor velocity of 1 μm/s, and SAXS/WAXD measurements were made at various points along the stress-strain curve. Exposure time for the frames was 0.1 s. Note that the X-ray irradiation of the sample was blocked between exposures.
Data Analysis.
For both SAXS and WAXD data analysis, we used the method outlined in Urban et al. (30), employing radial integration of 2D SAXS or WAXD frames over azimuthal sectors. To see the variation of fibril and mineral strain along the tensile axis, SAXS and WAXD frames were integrated in narrow pie shaped sectors of 10° angular width and centered along the tensile axis (see details in, which are published as supporting information on the PNAS web site). After integration, custom scripts were used for automated peak fitting of the intensity profile around the first-order reflection from the meridional collagen SAXS pattern, and around the (0002) reflection from the apatite WAXD pattern (Fig. 9). The peak function used for the fitting of the mineral WAXD pattern was a Gaussian with a linear background term. Since the SAXS peak showed a small degree of asymmetry (Fig. 9a Inset) the peak function used for fitting the first order collagen peak was an exponentially modified Gaussian (EMG), combined with a linear background term. The peak positions obtained were used to determine the collagen fibril D-period and the (0002) crystallographic lattice spacing for the mineral. At nonzero tissue strain values, εF and εM were defined as the percentage increase in fibril D-period and (0002) lattice spacing relative to the unstressed sample state.
When binning the large number of data points obtained for a range of samples into bins of tissue strain εT, if more than one point from a single sample lay in a bin, the average of the points was taken for the sample value in that bin, whereas if only one point lay in the bin, it was taken as the sample value. Points from different samples lying in each given bin were averaged, and errors were calculated (standard deviations and standard error of means). This procedure avoids statistical artifacts caused when one sample may have a disproportionate weight in a particular bin due to more than one measurement point. See Fig. 10, which is published as supporting information on the PNAS web site, for a schematic illustration of the binning procedure. Variables binned were mineral strain εM, fibril strain εF, mineral strain/tissue strain εM/εT, fibril strain/tissue strain εF/εT, and tissue stress σ.
Raman Spectroscopy.
We tested the effect of UV–laser microdissection on bone, by comparing Raman spectra before and after UV–laser microdissection. Raman spectra were taken with a confocal scanning Raman microscope with a 532-nm laser (CRM200, WITec, Ulm, Germany). A cantilever shaped section was cut out of the bone, and a unique point was marked and measured before and after laser cutting. No significant difference of the Raman spectra in the organic and inorganic phase was found (Fig. 11, which is published as supporting information on the PNAS web site).
Supplementary Material
Acknowledgments
We thank T. Narayanan and P. Panine for excellent support at beamline ID2, European Synchrotron Radiation Facility (ESRF); G. Benecke, M. Kerschnitzki, P. Leibner, A. M. Martins, W. Nierenz, and H. Pitas for technical assistance at MPI-KG, the Max Planck Society for support; and the European Union (EU)/ESRF for travel funding for H.S.G., P.Z., and W.W. J.S. was supported by EU Marie Curie EST Fellowship on Biomimetic Systems, MEST-CT-2004-504465.
Abbreviations
- SAXS
small-angle X-ray scattering
- WAXD
wide-angle X-ray diffraction.
Footnotes
The authors declare no conflict of interest.
This article is a PNAS direct submission.
References
- 1.Weiner S, Wagner HD. Annu Rev Mater Sci. 1998;28:271–298. [Google Scholar]
- 2.Currey JD. Science. 2005;309:253–254. doi: 10.1126/science.1113954. [DOI] [PubMed] [Google Scholar]
- 3.Fratzl P, Gupta HS, Paschalis EP, Roschger P. J Mater Chem. 2004;14:2115–2123. [Google Scholar]
- 4.Hassenkam T, Fantner GE, Cutroni JA, Weaver JC, Morse DE, Hansma PK. Bone. 2004;35:4–10. doi: 10.1016/j.bone.2004.02.024. [DOI] [PubMed] [Google Scholar]
- 5.Jager I, Fratzl P. Biophys J. 2000;79:1737–1746. doi: 10.1016/S0006-3495(00)76426-5. [DOI] [PMC free article] [PubMed] [Google Scholar]
- 6.Mercer C, He MY, Wang R, Evans AG. Acta Biomaterialia. 2006;2:59–68. doi: 10.1016/j.actbio.2005.08.004. [DOI] [PubMed] [Google Scholar]
- 7.Carden A, Rajachar RM, Morris MD, Kohn DH. Calcif Tissue Int. 2003;72:166–175. doi: 10.1007/s00223-002-1039-0. [DOI] [PubMed] [Google Scholar]
- 8.Fantner G, Hassenkam T, Kindt JH, Weaver JC, Birkedal H, Pechenik L, Cutroni JA, Cidade GAG, Stucky GD, Morse DE, Hansma PK. Nat Mater. 2005;4:612–616. doi: 10.1038/nmat1428. [DOI] [PubMed] [Google Scholar]
- 9.Zioupos P. J Biomech. 1999;32:209–211. doi: 10.1016/s0021-9290(98)00146-8. [DOI] [PubMed] [Google Scholar]
- 10.Nalla RK, Kinney JH, Ritchie RO. Nat Mater. 2003;2:164–168. doi: 10.1038/nmat832. [DOI] [PubMed] [Google Scholar]
- 11.Almer JD, Stock SR. J Struct Biol. 2005;152:14–27. doi: 10.1016/j.jsb.2005.08.003. [DOI] [PubMed] [Google Scholar]
- 12.Borsato KS, Sasaki N. J Biomech. 1997;30:955–957. doi: 10.1016/s0021-9290(97)00044-4. [DOI] [PubMed] [Google Scholar]
- 13.Gupta HS, Wagermaier W, Zickler GA, Hartmann J, Funari SS, Roschger P, Wagner HD, Fratzl P. Int J Fracture. 2006;139:425–436. [Google Scholar]
- 14.Gupta HS, Wagermaier W, Zickler GA, Aroush DRB, Funari SS, Roschger P, Wagner HD, Fratzl P. Nano Lett. 2005;5:2108–2111. doi: 10.1021/nl051584b. [DOI] [PubMed] [Google Scholar]
- 15.Gao HJ. Int J Fracture. 2006;138:101–137. [Google Scholar]
- 16.Gupta HS, Messmer P, Roschger P, Bernstorff S, Klaushofer K, Fratzl P. Phys Rev Lett. 2004;93:158101–158101. doi: 10.1103/PhysRevLett.93.158101. [DOI] [PubMed] [Google Scholar]
- 17.Yamamuro T, Hench LL, Wilson J. CRC Handbook of Bioactive Ceramics. Boca Raton, FL: CRC Press; 1990. [Google Scholar]
- 18.Ruys AJ, Wei M, Sorrell CC, Dickson MR, Brandwood A, Milthorpe BK. Biomaterials. 1995;16:409–415. doi: 10.1016/0142-9612(95)98859-c. [DOI] [PubMed] [Google Scholar]
- 19.Gao HJ, Ji BH, Jager IL, Arzt E, Fratzl P. Proc Natl Acad Sci USA. 2003;100:5597–5600. doi: 10.1073/pnas.0631609100. [DOI] [PMC free article] [PubMed] [Google Scholar]
- 20.Hull D, Clyne TW. An Introduction to Composite Materials. Cambridge, UK: Cambridge Univ Press; 1996. [Google Scholar]
- 21.Kotha SP, Kotha S, Guzelsu N. Composites Sci Technol. 2000;60:2147–2158. [Google Scholar]
- 22.Landis WJ. Bone. 1995;16:533–544. doi: 10.1016/8756-3282(95)00076-p. [DOI] [PubMed] [Google Scholar]
- 23.Misof K, Landis WJ, Klaushofer K, Fratzl P. J Clin Invest. 1997;100:40–45. doi: 10.1172/JCI119519. [DOI] [PMC free article] [PubMed] [Google Scholar]
- 24.Currey JD. J Exp Biol. 1999;202:2495–2503. doi: 10.1242/jeb.202.18.2495. [DOI] [PubMed] [Google Scholar]
- 25.An YH, Draughn RA. Mechanical Testing of Bone and the Bone-Implant Interface. Boca Raton, FL: CRC Press; 2000. [Google Scholar]
- 26.Currey JD. Bones—Structure and Mechanics. Princeton: Princeton Univ Press; 2002. [Google Scholar]
- 27.Burgert I, Fruhmann K, Keckes J, Fratzl P, Stanzl-Tschegg SE. Holzforschung. 2003;57:661–664. [Google Scholar]
- 28.Narayanan T, Diat O, Bosecke P. Nuclear Inst Methods Phys Res A. 2001;467:1005–1009. [Google Scholar]
- 29.Landis WJ, Hodgens KJ, Arena J, Song MJ, McEwen BF. Microsc Res Tech. 1996;33:192–202. doi: 10.1002/(SICI)1097-0029(19960201)33:2<192::AID-JEMT9>3.0.CO;2-V. [DOI] [PubMed] [Google Scholar]
- 30.Urban V, Panine P, Ponchut C, Boesecke P, Narayanan T. J Appl Crystallogr. 2003;36:809–811. [Google Scholar]
- 31.Hammersley AP, Svensson SO, Thompson A. Nuclear Inst Methods Phys Res A. 1994;346:312–321. [Google Scholar]
- 32.Megens M, vanKats CM, Bosecke P, Vos WL. Langmuir. 1997;13:6120–6129. [Google Scholar]
Associated Data
This section collects any data citations, data availability statements, or supplementary materials included in this article.


