

Abstract
Many biological processes exhibit complex kinetic behavior that involves a nontrivial distribution of rate constants. Characterization of the rate constant distribution is often critical for mechanistic understandings of these processes. However, it is difficult to extract a rate constant distribution from data measured in the time domain. This is due to the numerical instability of the inverse Laplace transform, a long-standing mathematical challenge that has hampered data analysis in many disciplines. Here, we present a method that allows us to reconstruct the probability distribution of rate constants from decay data in the time domain, without fitting to specific trial functions or requiring any prior knowledge of the rate distribution. The robustness (numerical stability) of this reconstruction method is numerically illustrated by analyzing data with realistic noise and theoretically proved by the continuity of the transformations connecting the relevant function spaces. This development enhances our ability to characterize kinetics and dynamics of biological processes. We expect this method to be useful in a broad range of disciplines considering the prevalence of complex exponential decays in many experimental systems.
INTRODUCTION
A wide variety of biological and physical processes, such as chemical and enzymatic reactions (1,2), conformational transitions of proteins and nucleic acids (3–5), drug metabolism (6), and relaxation in liquids (7), involve complex kinetics and dynamics that are best described by a distribution of first-order rate constants. To better understand these processes, one often needs to infer the probability distribution of rate constants from kinetic data obtained in the time domain. This task is known as the inverse Laplace problem, a well-known mathematical challenge in numerical analysis. The demand to solve this problem has recently been elevated by single-molecule experiments, which reveal unexpectedly complicated dynamics in many biological and physical processes (1,3–5,8–16).
Fitting procedures and numerical inversion of the Laplace transform have been previously proposed to tackle the inverse Laplace problem and to extract rate constants or distributions of rate constants from time domain data. It is well known that fitting methods suffer from arbitrariness associated with the number of fitting parameters. Sophisticated algorithms, such as hidden Markov modeling (17,18), maximum likelihood method (19), and Padé-approximant approach (20,21), were designed to remove such arbitrariness. These methods are often used to handle discrete distributions of rate constants. Direct inversion of Laplace transform can be used to derive arbitrary probability densities of rate constants, but suffers from numerical instability when applied to experimental data which are intrinsically noisy (22,24). Regularization methods such as Tikhonov regularization (25–27) and the maximum entropy method (28,29) have been used to stabilize the numerical inversion of the Laplace transform, but the results of these methods depend on the choice of a regularization parameter, the proper value of which is often difficult to determine without prior knowledge of the rate constant distribution.
In this work, we have developed a new method, the phase function approach, for directly reconstructing the probability distribution of rate constants from time domain data without requiring any prior knowledge of the distribution. This method can treat both discrete and continuous distributions in a unified framework without fitting to any trial functions. Unlike the direct inverse Laplace transform, this method is robust and stable against noise.
RESULTS
Kinetic data in the time domain
Kinetic experiments often give rise to a nonnegative signal p(t) that decays as time t increases. A well-known example for such a signal is the number of reactant molecules as a function of reaction time. In a general context, one can model p(t) as a superposition of exponential decays with different decay rate constants, to shed light on the underlying mechanism. Our goal is to reconstruct this distribution of decay rate constants from p(t).
Without losing generality, we describe here a concrete example of p(t) akin to single-molecule experiments. An important quantity obtained from these experiments is the dwell time of an individual molecule in a given microscopic state (such as the reactant state) before transition to another state (such as the product state).
A dwell-time histogram p(t), p(t) ≡ Prob {t ≤ dwell time < t + Δt}/Δt, can be constructed, where Prob {} stands for the probability to find the condition specified in {} satisfied. As the time interval Δt approaches zero, p(t) becomes the probability density of the dwell time t and the normalization condition  is naturally satisfied. The function p(t) determined in this way from single-molecule experiments is equivalent to a normalized reaction/transition time-course obtained in ensemble experiments. For convenience, we will refer to p(t) as the kinetic data in the time domain. When the transition from the first state to the second is a Markov process with a single rate constant k, p(t) follows a single exponential decay p(t) = ke−kt. For complex biological systems, there are often multiple transition pathways that connect different microscopic states, so the transition kinetics are described by a distribution of rate constants instead of a single rate constant. A common way to describe the distribution of rate constants is by the probability density function ρ(k), which is related to the time domain data by the Laplace transform p(t) = ∫ρ(k)ke−ktdk. However, the probability density function is in general nonmonotonic, unbounded, and may contain singularities. In some cases, the probability density function may not even be well defined—a well-known example is the devil's staircase probability distribution observed in physical systems of fractional dimensionality. These function properties of ρ(k) make the inverse Laplace transform that converts p(t) into ρ(k) intrinsically unstable, such that a small perturbation in p(t) can often lead to wild, unphysical changes in the reconstructed ρ(k).
In this work, we overcome the stability problem by describing the rate constant distribution with a cumulative distribution function defined as F(k) ≡ Prob {the rate constant < k}. The time-domain data function p(t) is related to F(k) by
 |
(1) |
Here,  stands for the transformation between F(k) and p(t). We will describe a method to invert F(k) from p(t). Unlike the probability density ρ(k), a nonnegative function (30) that is not necessarily bounded, the function F(k) is a bounded and nondecreasing function of k. These functional properties of F(k) ensure that the inversion from p(t) to F(k) will be stable. A rigorous proof of stability will be provided in Theoretical Foundation of the Robustness. In the following, we will present the mathematical formalism to reconstruct F(k) from p(t).
Mathematical formalism for the reconstruction of rate constant distributions
It is well known that one can obtain the amplitudes of different oscillatory modes contained in a signal by performing a Fourier transform. Exponential decay can be described as oscillation with a purely imaginary frequency ω = ik. We can thus use Fourier analysis followed by a conversion between real and imaginary frequencies to decompose p(t) into a superposition of exponential decays with different rate constants.
Definition of the phase function
Following the above rationale, we first perform the Fourier transform of p(t) with a complex-valued frequency ω = Reω + i Imω as
 |
The condition Imω ≤ 0 ensures the convergence of the integral. Naturally, we can write  as
as  , where
  is the modulus of
  and
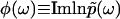
and  is the phase of
  . Importantly, the phase function
 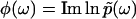 contains complete information about
  , because
  is an analytic function. This is reminiscent of the Kramers-Kronig theory of chromatic dispersion, which states that the frequency-dependent optical response of a dielectric material can be fully characterized through the absorptive part Imχ(ω) of the complex susceptibility function χ(ω). As the phase function φ(ω) is bounded and thus numerically much easier to handle than the unbounded
  , we first compute φ(ω) and then use it as the basis for our reconstruction formalism.
The Fourier transform of p(t) in Eq. 1 and the analytic continuation of the Fourier transform allow us to obtain  for Reω ≠ 0. Thus, the phase function of
  is given by
 |
(2a) |
To obtain a well-defined phase function φ(ω) for all complex values of ω, we further define
 |
(2b) |
It is worth noting that the function φ(ω), as the imaginary part of the analytic function  , must satisfy the Laplace equation ∂2φ(ω)/∂(Reω)2 + ∂2φ(ω)/∂(Imω)2 = 0 for all Reω ≠ 0. In practice, we use this property to obtain the boundary values φ(ik) from φ(ω) by numerically solving this Laplace equation.
The phase function fully determines the rate constant distribution
It is interesting to note that the phase function φ(ik) contains all the necessary information for us to reconstruct the rate constant distribution F(k) (Fig. 1). This correspondence can be understood intuitively through the following three rationales:
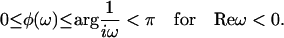
The boundary value φ(ik) along with the asymptotic behavior φ(ω) ∼ arg(1/iω), |ω| → ∞ uniquely determines the harmonic function
 as in the case of a two-dimensional electrostatic field, where the boundary electric potential fully determines the potential values in the interior of a region.
The phase function φ(ω), which is the imaginary part of
 (
( ), uniquely determines the real part
  , and thus the function
  in full, in the same way that the absorptive (imaginary) part of susceptibility function determines the dispersive (real) part according to the Kramers-Kronig relations.
The function
 has a one-to-one correspondence to p(t) through the Fourier transform, which in turn has a one-to-one correspondence to F(k), owing to the uniqueness of the inverse Laplace transform.
FIGURE 1.

The transformations that link the kinetic data p(t) in the time domain, the rate constant distribution F(k), the phase function φ(ω), and its value at the imaginary axis φ(ik). FT stands for the Fourier transform.
To illustrate this correspondence between φ(ik) and F(k) geometrically, we use a simple example of multiple exponential decay. Consider a distribution function F(k) with two stepwise jumps (Fig. 2 a), which corresponds to a double exponential decay in the time domain  . The corresponding analytic continuation of the Fourier transform
  diverges at k1 and k2, and vanishes at a node
  , which satisfies
  . The two singularities and one node in
  geometrically translates into two 0-to-π jumps in the phase function φ(ik) at k1 and k2, as well as one π-to-0 jump at
  , from which the branching ratio a1: a2 can be determined (Fig. 2 a). Thus the discontinuity points in the phase function φ(ik) fully determine the discretely distributed rate constants and the branching ratio. This algebraic approach can be generalized to any m-component multiple-exponential decay
  (Fig. 2 b). In this case, the Fourier transform takes the form of
  , and thus has m singularities at k1,k2,…,km, where
  diverges and (m − 1) nodes at
  where
where  . Accordingly, the phase function
  flip-flops (2m – 1) times between 0 and π: The k-values at which φ(ik) exhibits a discontinuous jump from 0 to π correspond to the discretely distributed rate constants k1,k2,…,km, while the k-values at which φ(ik) jumps from π to 0 correspond to the nodes
  (Fig. 2 b). The
  values contain information necessary to determine the branching ratios a1 : a2 : …: am. This illustration provides a geometrical method to infer a discrete distribution F(k) from the phase function φ(ik), which is in turn deduced from the time domain data p(t).
FIGURE 2.

The algebraic relation between the phase function φ(ik) and the rate constant distribution F(k) for discrete distributions. (a) A specific example of double exponential decay. Here, F(k) contains two discontinuous jumps at k1 and k2, corresponding to two discretely distributed rate constants with amplitudes of a1 and a2, respectively. The phase function φ(ω) is presented by the orientation of the unit vectors in the phase portrait. The corresponding φ(ik) contains two 0-to-π jumps at k1 and k2 and a π-to-0 jump at  , which satisfies
  . (b) A general multiple exponential decay with m rate constants. The phase function φ(ik) flip-flops between 0 and π according to the sign changes in
  . The k-values at which φ(ik) undergoes a 0-to-π jump correspond to locations of rate constants k1,k2,…,km; the nodes
  ,
, at which φ(ik) undergoes a π-to-0 jump determine the branching ratios a1 : a2 : …: am, where
 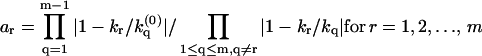 .
.
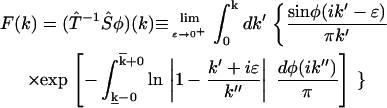
In a more general context that covers both continuous and discrete distributions of rate constants, we have proved rigorously that the phase function φ(ik) has one-to-one correspondence with the time domain data p(t) = ∫ke−ktdF(k) and thus can uniquely determine F(k) through the following equation:
 |
(3) |
Here,  stands for the mapping from φ(ik) to F(k), while the upper bound
  and lower bound
  of kinetic rate constants in the limits of integration are set by the experimental time resolution and maximum observation time, respectively. The derivation of Eq. 3 was accomplished in three major steps following the three aforementioned physical relations between φ(ik) and φ(ω), between φ(ω) and
  , and between
  and F(k) (see section S1, Supplementary Material, for the detailed derivation).
In summary, the above formalism allows us to reconstruct, using Eq. 3, the cumulative rate constant distribution F(k) from the phase function φ(ik), which is in turn derived from time domain data p(t) using Eq. 2 (Fig. 1). We thus refer to this reconstruction method as the phase function method. Importantly, this reconstruction process does not rely on any fitting procedure.
A geometrical constraint of the phase function
The nondecreasing property of F(k) leads to an important geometric constraint on the phase function:
 |
(4) |
This geometrical constraint can be understood physically by noticing that the expression ∫(1 + iω/k)−1dF(k) in Eq. 2a can be regarded as the center-of-mass for a system of particles distributed in the circular section 0 ≤ arg z ≤ arg(1/iω) < π of the complex z-plane. Therefore the phase-angle of this center-of-mass position, φ(ω) = arg∫(1 + iω/k)−1dF(k), should also lie in the same circular section, giving 0 ≤ φ(ω) ≤ arg(1/iω) < π (see section S1.1, Supplementary Material, for details). Conversely, this geometric constraint also implies that the corresponding rate constant distribution F(k) is a bounded and nondecreasing function (as judged from Eq. 3), which ensures the numerical stability of the reconstruction, as we shall prove in Theoretical Foundation of the Robustness. We impose this geometric constraint on the phase function during the numerical implementation as an error-correcting device to ensure the stability and accuracy of the reconstruction. As the constraint applies to all physically meaningful rate constant distributions, enforcing this constraint does not bias the result toward any particular probability distribution and can be used to (partially) correct noise-induced errors for all types of kinetic data without requiring additional information about the rate distribution.
General applicability of the reconstruction formalism
When analyzing experimental data, one is often curious about whether the distribution F(k) is dispersed smoothly throughout the k-domain or if it involves rate constant distribution in isolated regions well separated by gaps. The phase function approach outlined above provides this information in a straightforward way. The identity sinφ(ik′) = 0 defines k′ values that belong to disallowed rate constant gaps, which constitute plateaus in F(k). It is important to note that although F(k) is presented as a limit of continuous functions in Eq. 3, F(k) itself can be either continuous or discontinuous. From the properties of uniform convergence, we rigorously establish the following criteria for the continuity of F(k) (see section S1.3.3, Supplementary Material, for a proof):
If φ(ik′ + i0) − φ(ik′ − i0) < π, then F(k) is continuous at the point k′.
A 0-to-π jump in φ(ik) (φ(ik′ + i0) − φ(ik′ − i0) = π) exactly implies a discrete jump of F(k).
In particular, when the phase function φ(ik) presented in the upper panel of Fig. 2 b is plugged into Eq. 3, we obtained an F(k) function exactly as described by the lower panel of Fig. 2 b, confirming the purely algebraic argument given for the discrete rate constant distributions.
Numerical implementation of the reconstruction
To numerically reconstruct the rate constant distribution F(k) from the time domain data p(t) using the phase function method, we wrote a computer program that carries out the three major tasks in the process. First, the program computes the Fourier transform of p(t) using a fast Fourier transform algorithm to determine the phase function φ(ω). This allows us to map discrete data points in the time domain to the phase function φ(ω) in the lower half ω-plane,  (see section S2.1.1, Supplementary Material, for details). Next, the program analytically continues φ(ω) to the imaginary axis to obtain φ(ik). This is done by solving the Laplace equation using a four-point finite-difference method (see section S2.1.2, Supplementary Material). In the third step, F(k) is calculated from φ(ik) using Eq. 3 through a numerical integration process (see section S2.1.3, Supplementary Material).
Although the direct output of this algorithm is the cumulative probability distribution F(k), we also evaluated the probability density of ln k, to provide a more intuitive picture of what the rate constant distribution looks like. Typically, the rate constant of a biological or chemical process is related to the activation free energy ΔG* by the Arrhenius equation k ∝ exp(−ΔG*/kT). Thus dF(k)/dlnk provides an intuitive description of the activation energy distribution. To evaluate dF(k)/dlnk from F(k), we estimated the finite-difference value ΔF(k)/Δlnk where the dynamic window size Δlnk is chosen point-by-point such that the increment F(k) in this window represents a statistically significant subpopulation (see section S2.2, Supplementary Material).
Importantly, the numerical implementation of the phase function method contains no free fitting parameters and need not be adjusted according to the different types of rate constant distributions. This numerical analysis gives a uniform error bound and noise amplification ratio for all types of input data (see section S2.3, Supplementary Material). The only a priori information required to provide the stability in the phase function approach is the geometric constraint on the phase function (Eq. 4), which ensures that rate constant distribution F(k) is a bounded and nondecreasing function, and therefore physically meaningful as a cumulative probability.
Numerical illustration of the robustness
To test the numerical performance of the phase function method, we analyzed simulated kinetic data with realistic noise. Due to the limited number of transition/reaction events detected in single-molecule measurements, these experiments often generate relatively noisy data. We thus used simulated single-molecule data as test cases to demonstrate the robustness of the reconstruction method when dealing with noisy data. Specifically, for each preset rate constant distribution F(k) (see for example Fig. 3 a), we used Monte Carlo simulation to generate random integers (R) that obey: Prob {t ≤ R < t + Δt} ≡ p(t)Δt with p(t) = ∫ke−ktdF(k). These integers model the dwell times of individual molecules in a given microscopic state before transition to another state with rate constants obeying the distribution F(k). In each of the following examples, 8000 dwell times were generated. This simulation naturally takes into account two major sources of noise encountered in single-molecule experiments: the Poisson noise associated with measuring a finite number of events and the digitization noise associated with finite time resolution. The statistical histogram of the simulated dwell times, p(t) (Fig. 3 b), represents the time domain data. We then analyzed the time domain data p(t) by the phase function method to obtain a rate constant distribution Frec(k) and compared Frec(k) with the preset F(k) (Fig. 3 c).
FIGURE 3.

Reconstruction of continuous F(k) from simulated kinetic data p(t). (a) A preset F(k) that describes a Gaussian distribution of ln k. (b) The time domain data p(t) generated from F(k) using Monte Carlo simulations. (c) Comparison between the Frec(k) reconstructed from p(t) using the phase function method (red line) and the preset F(k) (black line). (d) Comparison between the Frec(k) reconstructed from p(t) using the phase function approach (red line) and the preset F(k) (black line), which describes uniform distributions of ln k in two separate regions of the k-domain. The inset depicts the time domain data p(t) generated from F(k) using Monte Carlo simulations. (e) Comparison between the probability density, dF(k)/dlnk, reconstructed using the phase function approach (red line) and the preset probability density (black line). (f) The probability density of rate constant dF(k)/dlnk reconstructed using the inverse Laplace transform with Tikhonov regularization. We use S. Provencher's software CONTIN (27) to realize the regularization, which minimizes the estimator 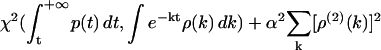 , where χ2 measures the chi-squared deviation between the time domain data p(t) and the time domain fit using the probability density ρ(k) = dF(k)/dk, and the second-order derivative ρ(2)(k) measures the smoothness of ρ(k) in the k-domain. The results for different values of the penalization parameter α are shown in colored lines in comparison with the preset probability density (black line). Error bars for the reconstruction are estimated in section S2.3 in the Supplementary Material.
First, we tested the performance on continuous rate constant distributions. To model a commonly encountered scenario, i.e., the Gaussian distribution of the activation energy ΔG*, we preset F(k) to reflect a Gaussian distribution of ln k. It is evident from Fig. 3 c that the reconstructed Frec(k) faithfully reproduces the preset F(k). More complex biological processes often exhibit kinetics that involves distinct regions of rate constants. For example, enzymes with different conformations can have different reaction rates. To model this behavior, we preset F(k) to include uniform distributions of ΔG* (or ln k) in two separate regions (Fig. 3, d and e). The Frec(k) reconstructed using the phase function method again agrees quantitatively well with the preset F(k) (Fig. 3 d). The probability density of lnk, dF(k)/dlnk, shows two well-separated regions of rate constants with sharp boundaries, as expected from the preset distributions (Fig. 3 e). The reconstruction result obtained from the phase function method is clearly more satisfactory than that obtained from inverse Laplace transform with regularization to remove numerical instability (compare Fig. 3 e with Fig. 3 f). As a widely used regularization method, a specific form of Tikhonov regularization stabilizes inverse Laplace transform by arbitrarily enforcing smoothness of the rate constant distribution and penalizing curvature associated with the distribution function (27). The reconstructed rate constant distribution using this regularization method depends sensitively on the penalization parameter α (Fig. 3 f). Even at the optimal α-value, which is difficult to choose without prior knowledge of the k distribution, the reconstruction fails to reproduce the sharp features in the probability density of k (Fig. 3 f).
Next, we tested discrete distributions of the rate constant k. For this purpose, we chose three preset F(k) functions that reflect double, triple, and quadruple exponential decays. In all three cases, the Frec(k) reconstructed from simulated p(t) using the phase function approach agrees well with the preset F(k) (Fig. 4, a–c). We note that the broadening of the discontinuous steps in F(k) is not a reconstruction error but reflects an intrinsic finite sampling effect. As only a finite number of the dwell times (8000) were used to build the time domain histogram p(t), the Poisson counting noise ( ) leads to a dispersion in the k-domain with a natural finite sampling width of δ ln k ∼ ±0.2, i.e., a single rate constant k and a dispersed distribution of rate constants between 0.67 k and 1.33 k generate p(t) functions that are indistinguishable to within 1% (see section S2.3, Supplementary Material). Remarkably, the reconstruction even works well for high-order exponential decays, which typically cannot be fit with confidence. Indeed, in the case of the quadruple exponential decay, whereas both triple and quadruple exponential fits appear to describe the time-domain data well (Fig. 4 d), the phase function reconstruction clearly indicates four separate regions of rate constants, the center locations and widths of which agree quantitatively with the preset rate constants and the natural finite sampling width, respectively (Fig. 4 e). Deviation at the fastest rate constant is due to errors associated with finite time resolution of the data. In contrast, the rate distributions obtained from the inverse Laplace transform using Tikhonov regularization depend strongly on the choice of the penalization parameter (Fig. 4 f).
FIGURE 4.

Reconstruction of discrete F(k) from simulated kinetic data p(t). (a–c) Comparison between the Frec(k) reconstructed from p(t) using the phase function approach (red line) and the preset F(k) (black line). Gray bars indicate the natural finite sampling width set by the Poisson noise arising from sampling only a finite number (8000) of dwell times. (d) Triple (blue dotted line) and quadruple (red solid line) exponential fittings of the time domain data  (gray symbols), simulated using the preset F(k) depicted in panel c. (e) Comparison between the probability density dF(k)/d ln k reconstructed using the phase function approach (red line) and the preset probability density (black arrows and gray columns). The probability density functions (dF(k)/d ln k) were derived from rate constant distributions (F(k)) shown in panel c. The black arrows indicate the locations of the discretely distributed rate constants and the gray columns describe the natural finite sampling width. (f) The rate constant probability density reconstructed from the time domain data using the inverse Laplace transform with Tikhonov regularization. The time domain data was generated from F(k) shown in panel c. Different colored lines correspond to different values of the Tikhonov penalization parameter α. The preset probability density (black arrows and gray columns) is shown for comparison.
Moreover, the optimal value of the penalization parameter α for the continuous distribution given in Fig. 3 f and that for the discrete distribution given in Fig. 4 f are dramatically different, making the choice of α extremely difficult in the cases where the smoothness of the distribution is not known a priori. This problem is exacerbated when considering a mixed distribution comprising both narrow and broad distributions in different regions of k-domain (Fig. 5). In this case, the Tikhonov regularization failed to produce a satisfactory rate distribution with any α-value. In contrast, the phase function method is a direct inference method that contains no fitting parameters and thus works well for arbitrary distributions of k (Figs. 3–5), including the mixed distribution comprising both discrete and continuous distributions in different regions of k (Fig. 5).
FIGURE 5.

Reconstruction of F(k) that contains both discrete and continuous distributions of k in different regions of the k-domain. (a) Comparison between the Frec(k) reconstructed using the phase function approach (red line) and the preset F(k) (black line) with the natural finite sampling width (gray bars). (b) Comparison between the probability density dF(k)/d ln k reconstructed using the phase function approach (red line) and the preset probability density (black arrow and line). (c) The rate constant probability density reconstructed using the inverse Laplace transform with Tikhonov regularization, with different values of the penalization parameter α (colored lines).
Theoretical foundation of the robustness
The robustness (numerical stability) of the phase function method illustrated by the above examples is not accidental, but supported by a rigorous theoretical basis, which lies in the continuity of transformations linking the relevant function spaces. We have shown that the 10 transformations connecting the four function spaces comprising admissible time domain data p(t), phase function φ(ω) for Imω ≤ 0, its value at the imaginary axis φ(ik), and rate constant distribution F(k) are all well-defined, one-to-one, and continuous. The continuity of these transformations implies that the convergence of a sequence of functions in any one of the four function spaces entails convergence of the corresponding sequences in the other function spaces, namely that
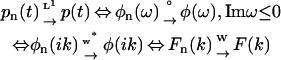 |
(see Fig. 5 for the definitions of the convergence rules w*, °, L1, and W). The proof of continuity is founded on the fact that the four admissible pools of functions all form compact metric spaces, so that the compactness technique in topology applies. We refer readers to section S3 in the Supplementary Material for the definition of these four admissible function spaces and the rigorous proof of the one-to-one correspondence and continuity of the 10 transformations shown in Fig. 6.
FIGURE 6.

The function spaces involved in the reconstruction equipped with different convergence rules. The four function spaces, respectively, comprise admissible time domain data p(t), phase function φ(ω) for Imω ≤ 0, its value at the imaginary axis φ(ik), and rate constant distribution F(k). Definitions of the admissible functions are given in section S3.1 in the Supplementary Material. The robustness of the reconstruction is ensured by the continuity of the 10 transformations  , connecting the four admissible function spaces, as proved in section S3.2 in the Supplementary Material.
Here, we shall focus on the practical implications of the continuity in the reconstruction method. The continuity of mappings, i.e., the ability to send a convergent sequence in one function space to a convergent sequence in another function space, implies numerical stability of the transformations we have used in the realization of the phase function approach. Especially, the continuity of  implies that small errors in p(t) should only affect the inference of F(k) to a small extent, which is critical for a robust analysis of experimental data that are intrinsically noisy. Furthermore, the continuity of
  and
and  imply that both the Fourier transform from p(t) to φ(ω) (Imω ≤ 0) and the extrapolation of φ(ik) from φ(ω) (Imω ≤ 0) are numerically stable, as long as the geometric constraint of the phase function (Eq. 4) is enforced. Last, the continuity of
  indicates that approximations in φ(ik) will only impact the reconstruction of F(k) to small extent. Therefore, not only is the algorithm robust in theory, it is also reliable when implemented numerically.
The robustness of the reconstruction is a direct consequence of analyzing the cumulative distribution function of the rate constant, F(k), rather than the probability density, ρ(k). The totality of bounded and nondecreasing F(k) can form a compact function space, which is crucial for the continuity of inverse mappings. This forms a stark contrast with the numerical instability encountered in the direct inverse Laplace transform, which attempts to derive a probability density function ρ(k) directly from the time domain data p(t) = ∫ke−ktρ(k)dk (23). Here, the nonnegative probability density ρ(k) is unbounded and thus the function space of ρ(k) is noncompact, undermining the numerical stability of inverting ρ(k) from p(t). It is important to note that F(k) contains all the statistical information present in ρ(k). Once F(k) is reconstructed, one can estimate ρ(k) by finite difference across dynamic windows, as we have shown in the numerical examples (Figs. 3–5). The reverse is, on the other hand, not true—if we start with an unstable estimate of ρ(k), we cannot then use integration to obtain a reliable estimate of F(k). A rigorous discussion concerning the F(k)-ρ(k) contrast appears in section S3.3.3, in the Supplementary Material.
DISCUSSION
A broad range of experiments in biology, chemistry, and physics generate data in the form of exponential decays. An important goal of these experiments is to extract the distribution of decay rate constants. For example, kinetic characterization of biochemical reactions in vitro or in vivo provides important information about the reaction pathways. However, it is difficult to robustly and accurately extract rate constants from the decay data, especially when the rate constants follow a nontrivial distribution. Such difficulty arises from the numerical instability in the inverse Laplace transform and the noise associated with experimental data.
In this work, we have developed a numerically stable method that is capable of reconstructing the cumulative rate constant distribution F(k) from data in the general form of f(t) = ∫e−ktdF(k). The method establishes an analytical relation between F(k) and a phase function φ(ik) that is derived from the time domain data by Fourier transform and analytical continuation. This phase function method allows one to directly infer the rate constant distribution without fitting the time domain data to any trial functions and without requiring any prior knowledge of F(k). We have rigorously proved the robustness of the reconstruction method by showing that it consists of continuous transformations between the relevant function spaces (Fig. 6) and illustrated its numerical stability by analysis of simulated data with noise (Figs. 3–5).
Two remarkable properties of the phase function method are its model-independence and numerical stability. This allows the phase function method to be applicable to arbitrary forms of probability distribution functions. This is different from fitting algorithms specifically tailored to discrete distributions of decay rate constants or to distributions with a finite degree of freedom (31), which can result in divergence when applied to data involving arbitrary continuous F(k). Although decay functions such as stretched-exponential decays or the Mittag-Leffler functions can be used to fit kinetic data with special preselected forms for continuous F(k), an unbiased reconstruction of the rate constant distribution that does not require making these a priori decisions is often more desirable.
Continuous distributions of rate constants in arbitrary functional forms have been previously handled with inverse Laplace transform, which has a well-known numerical instability and fails to treat data contaminated with even a moderate level of noise. Various regularization methods, such as Tikhonov regularization (25,27) and the maximum entropy method (28,29), have been used to suppress the numerical instability by enforcing a certain level of smoothness of the probability density ρ(k); or effectively, by penalizing against the curvature or information entropy of ρ(k). These regularization methods result in an estimate for ρ(k) that depends on the value of the penalization parameter (see, for example, Figs. 3–5). Although one may use certain criteria such as the Fisher distribution (27) or a hierarchical optimization procedure (29) to optimize the penalization parameter, a significant level of arbitrariness persists in these approaches without prior knowledge of the rate constants distribution. For complicated distributions with different smoothness scales in different regions of k, an optimal penalization parameter that provides a satisfactory description of the data may not even exist (Fig. 5). In contrast, the phase function method developed here is a direct inference method that contains no fitting parameters and thus can faithfully reconstruct the rate distribution without relying on additional information input (Figs. 3–5).
In summary, we have presented a new mathematical method, the phase function approach, to determine the probability distribution of kinetic rate constants from noisy data in the time domain. This method is generally applicable to kinetic data taking the form 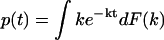 and other experimental data with similar functional forms. The method can be further generalized to characterize the kinetics of sequential, multistep reactions described by functional forms of
  , etc. (Y. Zhou and X. Zhuang, unpublished). We expect that this new method will enhance our ability to analyze kinetic data and extract kinetic information essential to our understandings of reaction pathways and networks involved in both biological and physical processes. This method can also be applied to data analysis in many other areas considering the prevalence of complex exponential decays in a wide range of disciplines.
SUPPLEMENTARY MATERIAL
An online supplement to this article can be found by visiting BJ Online at http://www.biophysj.org. A computer program for the numerical implementation of the phase function reconstruction method is available in the “Protocols and Methods” section at http://zhuang.harvard.edu.
Supplementary Material
Acknowledgments
We appreciate discussions with Profs. Sunney X. Xie and David R. Nelson on the subject.
This work is supported in part by the National Science Foundation and the David and Lucile Packard Foundation. X.Z. is a Howard Hughes Medical Institute investigator.
References
- 1.Lu, H. P., L. Xun, and X. S. Xie. 1998. Single-molecule enzymatic dynamics. Science. 282:1877–1882. [DOI] [PubMed] [Google Scholar]
- 2.Astumian, R. D. 2002. Protein conformational fluctuations and free-energy transduction. Appl. Phys. A. 75:193–206. [Google Scholar]
- 3.Zhuang, X., H. Kim, M. J. B. Pereira, H. P. Babcock, N. G. Walter, and S. Chu. 2002. Correlating structural dynamics and function in single ribozyme molecules. Science. 296:1473–1476. [DOI] [PubMed] [Google Scholar]
- 4.Tan, E., T. J. Wilson, M. K. Nahas, R. M. Clegg, D. M. J. Lilley, and T. Ha. 2003. A four-way junction accelerates hairpin ribozyme folding via a discrete intermediate. Proc. Natl. Acad. Sci. USA. 100:9308–9313. [DOI] [PMC free article] [PubMed] [Google Scholar]
- 5.Yang, H., G. Luo, P. Karnchanaphanurach, T.-M. Louie, I. Rech, S. Cova, L. Xun, and X. S. Xie. 2003. Protein conformational dynamics probed by single-molecule electron transfer. Science. 302:262–266. [DOI] [PubMed] [Google Scholar]
- 6.Lunn, D. J. 2005. Bayesian analysis of population pharmacokinetic/pharmacodynamic models. In Probabilistic Modeling in Bioinformatics and Medical Informatics. Dirk Husmeier, Richard Dybowski, and Stephen Roberts, editors. Springer-Verlag, London. 351–370.
- 7.Lindsey, C. P., and G. D. Patterson. 1980. Detailed comparison of the Williams-Watts and Cole-Davidson functions. J. Chem. Phys. 73:3348–3357. [Google Scholar]
- 8.Dickson, R. M., A. B. Cubitt, R. Y. Tsien, and W. E. Moerner. 1997. On/off blinking and switching behaviour of single molecules of green fluorescent protein. Nature. 388:355–358. [DOI] [PubMed] [Google Scholar]
- 9.Davenport, R. J., G. J. L. Wuite, R. Landick, and C. Bustamante. 2000. Single-molecule study of transcriptional pausing at arrest by E. coli RNA polymerase. Science. 287:2497–2500. [DOI] [PubMed] [Google Scholar]
- 10.Cao, J. 2000. Event-averaged measurements of single-molecule kinetics. Chem. Phys. Lett. 327:38–44. [Google Scholar]
- 11.Shaevitz, J. W., E. A. Abbondanzieri, R. Landick, and S. M. Block. 2003. Backtracking by single RNA polymerase molecules observed at near-basepair resolution. Nature. 426:684–687. [DOI] [PMC free article] [PubMed] [Google Scholar]
- 12.Neuman, K. C., E. A. Abbondanzieri, R. Landick, J. Gelles, and S. M. Block. 2003. Ubiquitous transcription pausing is independent of RNA polymerase backtracking. Cell. 115:437–447. [DOI] [PubMed] [Google Scholar]
- 13.Flomenbom, O., J. Klafter, and A. Szabo. 2005. What can one learn from two-state single-molecule trajectories? Biophys. J. 88:3780–3783. [DOI] [PMC free article] [PubMed] [Google Scholar]
- 14.Basché, T., W. E. Moerner, M. Orrit, and H. Talon. 1992. Photon antibunching in the fluorescence of a single dye molecule trapped in a solid. Phys. Rev. Lett. 69:1516–1519. [DOI] [PubMed] [Google Scholar]
- 15.Yip, W.-T., D. Hu, J. Yu, D. A. V. Bout, and P. F. Barbara. 1998. Classifying the photophysical dynamics of single- and multiple-chromophoric molecules by single molecule spectroscopy. J. Phys. Chem. A. 102:7564–7575. [Google Scholar]
- 16.Banin, U., M. Bruchez, A. P. Alivisatos, T. Ha, S. Weiss, and D. S. Chemla. 1998. Evidence for a thermal contribution to emission intermittency in single CdSe/CdS core/shell nanocrystals. J. Chem. Phys. 110:1195–1201. [Google Scholar]
- 17.Qin, F., A. Auerbach, and F. Sachs. 2000. A direct optimization approach to hidden Markov modeling for single-channel kinetics. Biophys. J. 79:1915–1927. [DOI] [PMC free article] [PubMed] [Google Scholar]
- 18.McKinney, S. A., C. Joo, and T. Ha. 2006. Analysis of single-molecule FRET trajectories using hidden Markov modeling. Biophys. J. 91:1941–1951. [DOI] [PMC free article] [PubMed] [Google Scholar]
- 19.Horn, R., and K. Lange. 1983. Estimating kinetic constants from single channel data. Biophys. J. 43:207–223. [DOI] [PMC free article] [PubMed] [Google Scholar]
- 20.Yeramian, E., and P. Claverie. 1987. Analysis of multiexponential functions without a hypothesis as to the number of components. Nature. 326:169–174. [Google Scholar]
- 21.Bajzer, Z., A. Myers, S. Sedarous, and F. Prendergast. 1989. Pade-Laplace method for analysis of fluorescence intensity decay. Biophys. J. 56:79–93. [DOI] [PMC free article] [PubMed] [Google Scholar]
- 22.Gardner, D. G., J. C. Gardner, and G. Laush. 1959. Method for the analysis of multicomponent exponential decay curves. J. Chem. Phys. 31:978–986. [Google Scholar]
- 23.McWhirter, J. G., and E. R. Pike. 1978. On the numerical inversion of the Laplace transform and similar Fredholm integral equations of the first kind. J. Phys. A Math. Gen. 11:1729–1745. [Google Scholar]
- 24.Davies, B., and B. Martin. 1979. Numerical inversion of the Laplace transform: a survey and comparison of methods. J. Comput. Phys. 33:1–32. [Google Scholar]
- 25.Dong, C. W. 1993. A regularization method for the numerical inversion of the Laplace transform. SIAM J. Num. Anal. 30:759–773. [Google Scholar]
- 26.Tikhonov, A. N., and V. Y. Arsenin. 1977. Solutions of Ill-Posed Problems. John Wiley and Sons, New York.
- 27.Provencher, S. W. 1982. A constrained regularization method for inverting data represented by linear algebraic or integral equations. Comput. Phys. Comm. 27:213–227. [Google Scholar]
- 28.Livesey, A. K., and J. C. Brochon. 1987. Recovering the distribution of decay constants in pulse-fluorimetry using maximum entropy. Biophys. J. 52:693–706. [DOI] [PMC free article] [PubMed] [Google Scholar]
- 29.Steinbach, P. J., R. Ionescu, and C. R. Matthews. 2002. Analysis of kinetics using a hybrid maximum-entropy/nonlinear-least-squares method: application to protein folding. Biophys. J. 82:2244–2255. [DOI] [PMC free article] [PubMed] [Google Scholar]
- 30.Tagliani, A. 2001. Numerical inversion of Laplace transform on the real line of probability density functions. Appl. Math. Comput. 123:285–299. [Google Scholar]
- 31.Istratov, A. A., and O. F. Vyvenko. 1999. Exponential analysis in physical phenomena. Rev. Sci. Instr. 70:1233–1257. [Google Scholar]
Associated Data
This section collects any data citations, data availability statements, or supplementary materials included in this article.