

Abstract
The systemic autoimmune disease lupus erythematosus (SLE) is frequently accompanied by neuropsychiatric manifestations and brain lesions of unknown etiology. The MRL-lpr mice show behavioral dysfunction concurrent with progression of a lupus-like disease, thus providing a valuable model in understanding the pathogenesis of autoimmunity-induced CNS damage. Profound neurodegeneration in the limbic system of MRL-lpr mice is associated with cytotoxicity of their cerebrospinal fluid (CSF) to mature and immature neurons. We have recently shown that IgG-rich CSF fraction largely accounts for this effect. The present study examines IgG levels in serum and CSF, as well as the permeability of the blood–brain barrier in mice that differ in immune status, age, and brain morphology. In comparison to young MRL-lpr mice and age-matched congenic controls, a significant elevation of IgG and albumin levels were detected in the CSF of aged autoimmune MRL-lpr mice. Two-dimensional gel electrophoresis and MALDI-TOF MS confirmed elevation in IgG heavy and Ig light chain isoforms in the CSF. Increased permeability of the blood–brain barrier correlated with neurodegeneration (as revealed by Fluoro Jade B staining) in periventricular areas. Although the source and specificity of neuropathogenic antibodies remain to be determined, these results support the hypothesis that a breached blood–brain barrier and IgG molecules are involved in the etiology of CNS damage during SLE-like disease.
Keywords: Autoimmunity, Autoantibodies, Lupus, Blood—brain barrier, Cerebrospinal fluid, Immunoglobulin, Albumin, Fluoro Jade B, Western blotting, Mass spectrometry, MRL mice
1. Introduction
Systemic lupus erythematosus (SLE) is an autoimmune disorder primarily characterized by B-cell hyperactivity and production of autoantibodies to multiple cellular antigens. Neuropsychiatric (NP) manifestations are a common and serious complication of SLE (Huizinga et al., 2001; Bosma et al., 2002). Contemporary imaging techniques reveal various abnormalities, including lesions in the periventricular and subcortical white matter (Baum et al., 1993; Jennings et al., 2004; Sabbadini et al., 1999; Brooks et al., 1997), hypoperfusion (Colamussi et al., 1995; Handa et al., 2003; Huang et al., 2002; Lopez-Longo et al., 2003), and regional metabolic abnormalities (Komatsu et al., 1999; Sibbitt and Sibbitt, 1993; Brooks et al., 1997; Volkow et al., 1988). However, brain atrophy is the most frequent observation on CT scans (Gonzalez-Scarano et al., 1979; Kaell et al., 1986; Miguel et al., 1994; Omdal et al., 1989; Waterloo et al., 1999) and is proposed to reflect widespread neuronal loss (Sibbitt et al., 1994). Particular autoantibodies in the serum and cerebrospinal fluid (CSF) have been proposed as an important factor in the etiology of CNS damage (Jennekens and Kater, 2002). Increased intrathecal synthesis (as revealed by an elevated IgG index and oligoclonal banding) in patients with CNS dysfunction (McLean et al., 1995; Hirohata et al., 1985; Winfield et al., 1983) and antigen-specific autoantibodies in the CSF (Yoshio et al., 2005) seem to be associated with NP manifestations (Greenwood et al., 2002).
We use an animal model that develops a lupus-like disease to study the mechanisms by which chronic auto-immunity induces CNS dysfunction (Sakic et al., 1997). Inbred MRL/MpJ-Faslpr (MRL-lpr) mice spontaneously develop an autoimmune disease with clinical and serological manifestations similar to SLE (Theofilopoulos, 1992). In comparison to congenic MRL/MpJ (MRL+/+) controls, an accelerated progression of autoimmunity in the MRL-lpr substrain is accompanied by an anxious/depressive-like behavioral state (Sakic et al., 1994a), ventricular enlargement (Denenberg et al., 1992), cerebral atrophy, retarded brain growth (Sakic et al., 1998), and infiltration of immunocompetent cells into the choroid plexus (Alexander et al., 1983; Vogelweid et al., 1991; Hess et al., 1993) and brain parenchyma (Farrell et al., 1997; Zameer and Hoffman, 2004). Furthermore, CSF from symptomatic MRL-lpr mice reduce the viability of cultured hippocampal neurons (Maric et al., 2001) and proliferating brain cells (Sakic et al., submitted for publication). IgG-rich CSF fractions seem to largely account for the cytotoxic properties of CSF in the MRL-lpr substrain. Elevated levels of brain-reactive antibodies were also detected in their sera (Zameer and Hoffman, 2001; Moore et al., 1994) and those reactive to antigens from a neuronal cell line were associated with impaired exploratory behavior and emotional reactivity in this strain (Sakic et al., 1993a). Compared to other Ig classes, immunoglobulin levels of the IgG class seem to correlate well with disease activity in both human and murine forms of lupus (Isenberg et al., 1997; Okamura et al., 1993). Taken together, these studies suggest that immunoglobulins play an important role in brain damage and behavioral dysfunction. However, despite the evidence of extravascular IgG accumulation in the CNS and the notion of a disrupted blood–brain barrier (Vogelweid et al., 1991), CSF levels of IgG antibodies have not been estimated, and their relationship to neurodegeneration was unknown.
In the present study we examine whether IgG levels in the CSF increase along the development of lupus-like disease. When quantitative differences between the groups were established, the IgG index and albumin quotient were calculated to examine whether IgG antibodies are synthesized intrathecally and whether blood–brain barrier permeability is increased. The results were compared before and after the onset of autoimmunity in the MRL-lpr strain, as well as between diseased mice and age-matched control groups. The congenic MRL +/+ substrain develops a less severe form of lupus-like disease (Theofilopoulos, 1992), and was used as a congenic control across the studies. The older cohorts were chosen at an age at which most MRL-lpr mice develop behavioral dysfunction (Sakic et al., 1994a), serological manifestations of lupus-like disease (Sakic et al., 1993b), and show signs of neurodegeneration (Ballok et al., 2003). Younger cohorts of MRL-lpr and MRL+/+mice, which are relatively comparable in behavioral profiles (Sakic et al., 1994b), were used to test whether differences detected exist before the onset of severe autoimmunity. Two-dimensional electrophoresis and MALDI-TOF MS were used to further characterize the CSF content in symptomatic MRL-lpr mice. The Fluoro Jade B dye (FJB), which stains dying neurons (Schmued and Hopkins, 2000), was used to examine the correlation between neurodegeneration and CSF protein levels.
2. Materials and methods
2.1. Animals
Separate batches of 3–4 aged mice/substrain were used to assess sample volumes sufficient to produce replicable protein spots on mini-gels and optimize running conditions. The cohorts of 15–26 weeks old (n =24/substrain) and 6–7 weeks old (n =6/substrain) MRL-lpr and MRL +/+ mice from our breeding colony were used to assess relative group differences in CSF protein content. Finally, the cohorts of 19–30 weeks old (n =6/substrain) and 4–5 weeks old (n =6/substrain) mice were used to determine the albumin quotient and IgG index. Mice were maintained under standard laboratory conditions and housed in groups of five. The experimental protocols were carried out in accordance with the rules and regulations of the Canadian Council of Animal Care.
2.2. Tissue sampling
Mice were anesthetized with Somnotol and intracardially perfused with PBS. Given that splenomegaly is a typical diagnostic feature of florid autoimmunity in MRL-lpr mice (Theofilopoulos, 1992), spleen weight was used to discriminate immune status among the groups. The CSF was collected as described previously (Maric et al., 2001), transferred to sterile plastic vials, and centrifuged at 7000 rpm for ~30 s to remove cells. The lack of red blood cell precipitate was used as indicator of clean samples, subsequently stored at −20 °C.
2.3. SDS-PAGE and Western blotting
The CSF samples were denatured at 100 °C for 4 min and briefly spun before loading (5 μl/lane) onto a pre-cast 10% SDS-PAGE gel (BioRad, Mississauga, ON). To check transfer efficacy and visualize proteins, samples were run at 60 V for 30 min and transferred to nitrocellulose membranes (100 V for 2 h) before visualization with Ponceau S stain (Klein et al., 1995; Gotzmann and Gerner, 2000).
Resolved proteins were transferred to nitrocellulose membranes and blocked for 1 h with 5% skim milk prior to incubation overnight at 4 °C with mouse anti-human IgG antibody (1:10,000; Chemicon, Temecula, CA), readily available at that time in our laboratory. Membranes were washed 3 times in PBS and incubated for 1 h at room temperature (RT) with an HRP-conjugated anti-mouse secondary antibody (1:5,000; Amersham Phamacia Biotech, UK). Antigens were visualized using enhanced chemiluminescence and the signals detected by autoradiography film exposed for 60 s.
To assess blood–brain barrier permeability and intrathecal synthesis of IgG, fluid samples from the separate cohort of mice and anti-mouse IgG antibodies were used. Paired serum and CSF were run in parallel and analyzed together in one analytical run. A 2 μl sample of undiluted CSF and 4 μl sample of 1:100 diluted sera (diluted with dH2O) was combined separately with LDS sample buffer, reducing agent, and deionized water to a final volume of 10 μl mix and incubated at 70 °C for 10 min. A total of 10 μl mix as well as 3 μl of molecular weight protein markers were loaded onto pre-cast 4–12% Bis–Tris–gels (NuPAGE Novex) and run at 200 V until the dye reached the bottom of the gel. The proteins resolved were transferred to PVDF membranes using the XCell II Blot module, which was filled with 1X NuPAGE transfer buffer. The transfer occurred at 30 V for 2 h and was deemed complete by visual detection of the pre-stained molecular weight markers on the blot and none remaining on the gel. The blots were incubated for 1 h in blocking solution [PBS containing 0.1% (v/v) Tween 20 (PBST) with 5% (w/v) dry milk powder]. Following washing in PBST, the membranes were incubated with a mixture of HRP-conjugated sheep anti-mouse IgG (1:25,000; Amersham Biosciences, Piscataway, NJ) and goat anti-mouse albumin peroxidase-linked antibody (1:100,000; Bethyl laboratories, Montgomery, TX) for 1 h. Specificity of the antibodies and optimal dilutions were determined in separate pilot tests with purified mouse IgG (Jackson Immunoresearch Laboratories, Westgrove, PA) and purified mouse albumin (Sigma, St. Louis, MO). Since the antibodies used could not distinguish light chains from different classes of Ig molecules, we refer to Ig light chain (Ig L) throughout the manuscript. The membranes were subsequently washed and incubated with ECL fluorescent detection reagent for 5 min. Chemifluorescent detection of IgG and albumin was achieved using the Typhoon 9400 imager (Excitation 457 nm and Emission filter 520 BP 40). Pre-cast gels, buffers, reducing agent, PVDF membranes, SeeBlue Plus2 pre-stained molecular weight protein standards were from Invitrogen Technologies (Burlington, ON).
For quantization purposes, standard curves were generated from six concentrations of purified mouse albumin (50–500 ng, Sigma, St. Louis, MO) and IgG (10–100 ng, Jackson ImmunoResearch Laboratories, Westgrove, PA). IgG (50 ng) and albumin standards (250 ng) were loaded on each gel and concentrations calculated were based on the normalized data to the linear standard curve generated. All blots were analyzed using NIH Image 1.63 software.
2.4. Quotients and IgG index
Blood–brain barrier function was assessed by calculating the albumin quotient as follows: Q Albumin =(CSF Albumin × 103/Serum Albumin). Similarly, IgG heavy and Ig light chain quotients (CSF/serum) and specific indices were calculated separately, based on a general index formula used to assess intrathecal synthesis; CSF IgG index=(CSF IgG/Serum IgG)/Q Albumin (Christenson et al., 1983).
2.5. Two-dimensional gel electrophoresis
CSF samples were centrifuged at 2000 ×g for 1 min to remove cell and/or cellular debris. They were de-salted using mini dialysis kits (Amersham Biosciences, Piscataway, NJ) and then reconstituted in 125 μl of solubilization/rehydration buffer (7 M urea, 2 M thiourea, 0.8% (v/v) pharmalyte, pH 3–10, 4% (w/v) CHAPS and 60 mM DTT, and trace amounts of Bromophenol Blue). The resulting preparations were loaded into the IPG strip holder and subsequent rehydration of the IPG strips proceeded for 12 h at 20 °C at 30 V. The protocol for IEF was as follows: 150 V for 1 h, 300 V for 1 h, 1000 V for 1 h, 2500 V for 1 h, from 2500 V to 8000 V for 1 h, 8000 V for 3 h for a total 34000 Vh. IEF was conducted using 7 cm immobilized pH gradient (IPG) strips with a non-linear pH gradient of 3–10. Following IEF, strips were incubated for 15 min at RT with continuous shaking in equilibration buffer [6 M urea, 30% (w/v) glycerol and 2% (w/v) SDS in 0.05 M Tris–HCl pH 8.8 and a trace of bromophenol], containing 0.1% (w/v) DTT. The strips were briefly washed in deionized water and incubated in equilibration buffer containing 0.25% (w/v) iodoacetamide for 15 min. After this, the strips were applied to 4–12% Bis-Tris–Zoom gels along with 2 μl of pre stained molecular weight markers. The strips were sealed to the top of the gels using a 0.1% (w/v) agarose solution and run at 100 V until the dye reached the bottom of the gel. Following electrophoresis, the gels were stained in Deep Purple Fluorescent stain according to product protocol (Amersham Biosciences). The 2D protein images were obtained using the Typhoon 9400 imager (Excitation 457 nm and Emission filter 610 nm).
IPG mini-strips (pH 3–10), Pharmalytes 3–10, mini dialysis kits as well as IPGphor, Deep Fluorescent Dye and SDS-PAGE apparata were from Amersham Biosciences. All chemicals were of analytical grade.
2.6. MALDI-TOF MS
Protein mass spectra were acquired on an Ettan MALDI-TOF/Pro mass spectrometer (Amersham Biosciences) using 0.4 μl out of 5 μl of the digest mixture of alpha-cyano 4 hyroxy-cinnamic acid (4-HCCA) as the matrix (Macri et al., 2000). Radiation from a nitrogen laser (337 nm, 3 ns pulse width) was employed to desorb ions from the target plate. Data were obtained in reflectron mode using conditions described previously (Macri et al., 2000). The resulting peptide map was searched against Profound protein database.
2.7. Fluoro-Jade B staining
Ten-micrometer horizontal sections were obtained using a Jung Frigocut 2800 E cryostat at the level of the paraventricular thalamic nucleus and processed as described before (Ballok et al., 2003). FJB-positive neurons from two 0.5 mm2 areas around the third ventricle were counted manually from TIFF files by an unbiased observer using standard imaging software.
2.8. Statistical analysis
Data were analyzed by the t-test, and Pearson and Spearman correlations. One CSF sample from the cohort of 19–30 week old MRL +/+ mice was lost during lab-to-lab transfer, so the sample size for this group was reduced to n =5. All computations were performed using the SPSS 13 statistical package. Graphs show means ± SEM, with sample sizes shown as n.
3. Results
3.1. CSF protein and IgG levels
Initial protein visualization with Ponceau S revealed a multitude of polypeptide bands with more intense staining in CSF samples from symptomatic MRL-lpr mice compared with the CSF from sex- and age-matched congenic controls (Fig. 1). Polypeptides corresponding in molecular weight to heavy (H)- and light (L)- chain immunoglobulins were more abundant in symptomatic MRL-lpr mice.
Fig. 1.
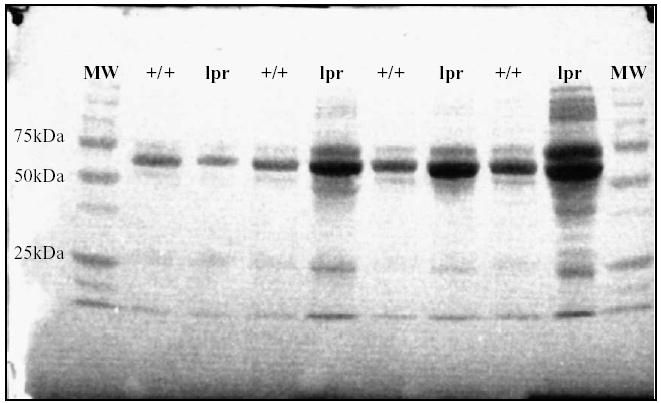
Proteins in an initial batch of fresh CSF samples (10 μl/well) analyzed by 1D SDS-PAGE and visualized with Ponceau S. In comparison with age- and sex-matched controls, the protein levels in 20–23 weeks old MRL-lpr males were increased, as revealed by a greater intensity and amount of polypeptide staining. A stronger signal in the region of IgG heavy chain (~55 kDa) was detected in three out four MRL-lpr mice and in all four samples at the molecular weight region of Ig light chain (~25 kDa).
Subsequent immunblotting of CSF samples collected from a larger cohort confirmed a significant elevation in relative optical density for both H- and L-chains in diseased MRL-lpr mice (H-chain: t46 =5.007, p <0.001; L-chain: t46 =6.45, p <0.001). Consistent with an earlier onset and more severe disease manifestations (Theofilopoulos, 1992), the MRL-lpr females showed a higher abundance of both CSF H- and L-chains in comparison to males (H-chain: t28 =2.728, p =0.011; L-chain: t28 =3.211 p =0.003). Although protein levels were profoundly lower in the young than in the old MRL-lpr cohort (H-chain: t28 = 3.924 p =0.001; L-chain: t28 =2.518, p =0.018), when compared to young MRL +/+ controls an increase in optical density of IgG H-chain fragments was evident as early as 7 weeks of age (H-chain: t10 =2.48, p =0.033). This suggested that CSF IgG levels are elevated as early as the second month of life and increase along with disease activity in the MRL-lpr substrain. As expected, spleen weights were significantly elevated in aged MRL-lpr animals (467.8 ± 41 mg) in comparison to MRL +/+ controls (128.4 ± 7 mg) and splenomegaly, a diagnostic feature of systemic disease activity, correlated with the presence of CSF L-chains in aged mice (MRL-lpr group: r22 =0.431, p =0.036; both MRL substrains: r46 =0.667, p <0.001; Fig. 2).
Fig. 2.
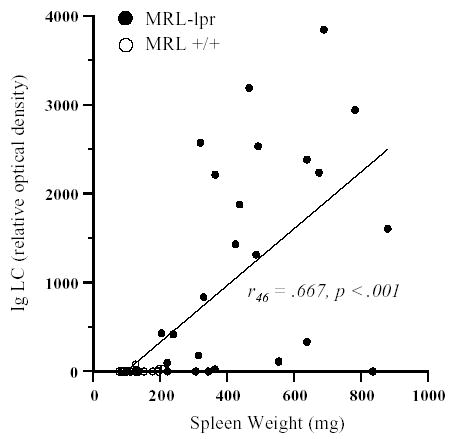
Relative optical densities from Western blot analysis revealed significant increase in both IgG heavy chain (data not shown) and Ig light chain abundance in CSF samples (5 μl/well) from 15–26 weeks old MRL-lpr mice. Moreover, mice with severe splenomegaly showed higher content of Ig light chain in their CSF.
3.2. Blood–brain barrier permeability and intrathecal IgG synthesis
Consistent with the above findings, quantification of serum and CSF proteins on the same blot (Fig. 3A) in respect to concentration standards (Fig. 3B) revealed elevation in the IgG H- and L-chain in 5 out of 6 aged MRL-lpr mice in comparison to MRL +/+ controls (H-chain: t9 =3.772, p <.004; L-chain: t9 =4.406, p <.002; Fig. 3C). In addition, the CSF/serum quotients were significantly different between these two groups (H-chain: t9 =3.313, p <0.01; L-chain: t9 =2.964, p <0.02). Although this further confirmed a disease-related elevation in the CSF IgG content, the possibility that intrathecally synthesized immunoglobulins account for this elevation could not be confirmed mathematically due to an increased albumin quotient (t9 =3.783, p <0.01). Namely, the IgG index in old MRL-lpr mice was not different from other groups, likely due to a “masking effect” of an impaired blood–brain barrier (as evidenced by an increased albumin quotient). Along the same line, the albumin quotient highly correlated with both the H- and L-chain quotients (H-chain: r10 =0.859, p =0.001; L-chain: r10 =0.752, p =0.008), suggesting that CSF IgG elevation in aged MRL-lpr mice is associated with a leaky blood–brain barrier. More importantly, all quotients were negatively correlated with brain weight (H-chain: r10 = −0.810, p = .005; L-chain: r10 = −0.804, p =.005; albumin r10 = −0.830, p =.003), suggesting brain atrophy in mice with a higher CSF protein content.
Fig. 3.
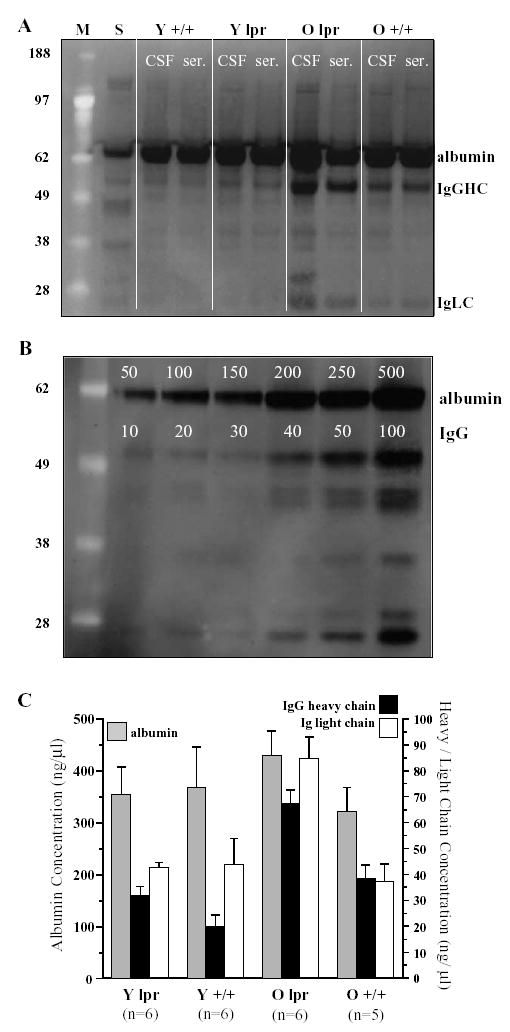
Representative Western blot with CSF samples (left lane) and matched serum samples (right lane) from young (Y, 4–5 weeks old) and old (O, 19–30 weeks old) MRL-lpr and age-matched MRL-+/+mice; S=standards of albumin and IgG; M=molecular weight markers (A). The gel with concentration standards (B) was used in the assessment of absolute protein concentration levels (C), which revealed an age-dependent increase in immunoglobulin content in the CSF from old, diseased MRL-lpr mice.
The quotients did not differ between younger cohorts, supporting the notion that blood–brain barrier permeability is still relatively normal at 4 weeks of age, but increases with disease severity in aging MRL-lpr mice (Vogelweid et al., 1991).
3.3. Proteomic analysis of CSF by 2DE and MALDI-TOF MS
Fig. 4 shows the proteomic profile of CSF from a control MRL +/+ mouse (A) compared to an age matched MRL-lpr CSF sample (B). Due to the small CSF volumes (~5 μl) that remained from a single mouse, only the most abundant proteins were detected on 2D gels. In addition to an increase in albumin, transferrin, and alpha-anti-trypsin, MALDI-TOF MS detected an increased abundance and number of isoforms of IgG H- and L-chains in CSF samples from diseased MRL-lpr mice. IgG H-chains, with an apparent molecular weight of approximately 55 kDa, span a pH range of 6–10 units while the Ig L-chains (~25 kDa) were found between pH 4–7. The H-chains appeared to be clustered between pH 5–10 while the majority of Ig L-chains from MRL-lpr were located at pH~4.
Fig. 4.
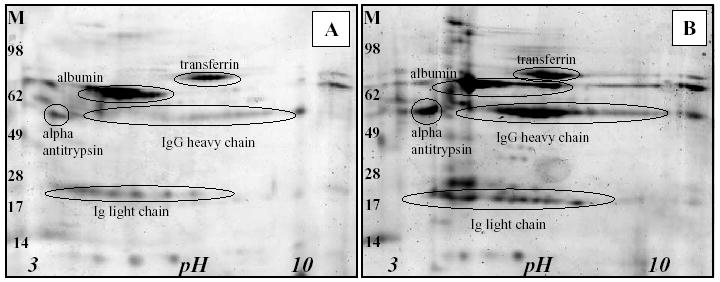
2-D protein profiles of CSF from one MRL +/+ mouse (A) compared to an age-matched MRL-lpr CSF sample (B). Distinct protein patterns in the CSF from MRL-lpr mouse were confirmed in the IgG heavy chain and Ig light chain regions (M-molecular weight markers).
3.4. The relationship between CSF IgG and neurodegeneration
Fig. 5 depicts mild, modest, and severe neurodegeneration (as revealed by FJB staining) in the periventricular region of three (out of seven) MRL-lpr brains examined. Consistent with the correlation between a reduced brain weight and increased CSF protein content, the extent of FJB staining positively correlated with the levels of both CSF IgG H- and Ig L-chains in aged MRL-lpr animals (for both H- and L-chain: rho =0.786, p =0.036; Fig. 5D). Taken together, these results suggested that more IgG was measured in the CSF of mice with severe neurodegeneration and brain atrophy.
Fig. 5.

FJB-positive neurons (arrows on low and high magnifications) around the third ventricle (3 V) of MRL-lpr mice that differed in severity of neurodegeneration: A—mild, B—moderate, C—severe. High levels of CSF Ig chains were associated with more severe neurodegenration in the periventricular region (D).
4. Discussion
The present study reveals blood–brain barrier impairment and elevated IgG levels in the CSF of diseased, lupus-prone MRL-lpr mice. Two-dimensional electrophoresis followed by MS confirmed that this increase reflects a constellation of IgG heavy and Ig light chains that differ in their pH value. These isoforms, which have a similar molecular weight but a different overall net charge, account for the horizontal “protein ladder” pattern on the 2D images. Disease progression and brain atrophy appear associated with changes in blood–brain barrier function and CSF protein content. Present findings are consistent with clinical evidence, such as impaired blood–brain barrier function in SLE patients with CNS manifestations (Abbott et al., 2003; Cabanas et al., 1996; Kelly and Denburg, 1987; Perry and Miller, 1992; Nakanishi, 2003; Vogelweid et al., 1991; Winfield et al., 1983) and increased CSF antibody levels (Bluestein et al., 1981; Hirohata et al., 1985; Nakanishi, 2003; Kelly and Denburg, 1987; Winfield et al., 1983; Yan et al., 2003). Along the same line, the relationship between increased CSF IgG levels and neurodegeneration in diseased mice is in accordance with CNS involvement and the presence of particular CSF antibodies in SLE patients (Greenwood et al., 2002). Taken together, the present results further lend support to the hypothesis that a breached blood–brain barrier and CSF immunoglobulins play a role in the pathogenesis of brain damage during lupus-like disease in MRL-lpr mice (Vogelweid et al., 1991; Maric et al., 2001). More importantly, they further prove a unique validity of the MRL model in studying CNS histopathology associated with underlying lupus-like disease (Alexander et al., 1983).
With the present set of data set we could not confirm intrathecal production of IgG antibodies since a permeable blood–brain barrier is known to influence the IgG index calculation (Gallo et al., 1988). Despite this, several lines of evidence suggest that this can be the case. B-cells have been observed within the choroid plexus of autoimmune MRL-lpr mice (Zameer and Hoffman, 2001) at an age that corresponds to elevated CSF IgG levels in the current study. This accumulation and blood–brain barrier impairment may promote the entry of activated B-cells into the brain parenchyma and clonal expansion in response to CNS-specific antigens. Second, since free light chains are produced in excess during antibody production by mature B-cells (Levinson and Keren, 1994), the correlation between splenomegaly and light chains in the CSF of diseased MRL-lpr mice may reflect overall hyperactivity of B-cells, including clones that infiltrate the brain. Finally, the CSF but not serum from autoimmune MRL-lpr mice was found to be neurotoxic in vitro (Maric et al., 2001). It was proposed that this reflected the presence of unique, intrathecally synthesized neuroactive CSF antibodies. However, the possibility that these neurotoxic IgGs are a result of passive diffusion of circulating antibodies across a breached blood–brain barrier could not be excluded at the time. Another viable possibility is that elevated levels of CSF IgG reflect a reduced CSF flow rate. In particular, this mechanism may account for ~80% of the variation in CSF IgG and albumin concentrations during pathological conditions (Seyfert and Faulstich, 2003). If this is the case, serum antibodies, which have the potential to transiently alter cellular function (Crimando et al., 1997; Moore, 1990), could accumulate in the CNS to the point of pathogenicity. Therefore, it would be of importance to compare the effects of CSF with serum IgG fractions in future studies.
Based on the 2D analysis, we can merely speculate as to the specific protein modifications that occur on the IgG subunits and if these modifications are linked to IgG-mediated cytotoxicity. The difference in IgG charge may be the result of specific post-translational modifications, such as phosphorylation and/or non-enzymatic glycosylation, that may have occurred either in the serum or CSF. Alternatively, this difference may be the result of specific amino-acid sequences in the variable region of the IgG molecule. This is of particular importance because antigen-driven somatic hypermutation occurs more readily in IgG molecules both in murine and human forms of lupus, which appears to render the Ig molecule more pathogenic by enhancing its binding capabilities (Rahman, 2004).
We presently did not examine whether CSF IgG antibodies are reactive to brain antigens. This is of particular importance because brain-reactive antibodies (BRA) have been proposed for many years to cause neurological dysfunction by binding to CNS antigens and altering cellular function (Lang et al., 2003; Hampton et al., 2004). A series of studies have demonstrated that BRA are more frequent in the serum and CSF of NP-SLE patients (Bell et al., 1991; Williams et al., 1981; Bluestein et al., 1981; Bluestein and Woods, 1982; Bluestein and Zvaifler, 1983; Danon and Garty, 1986; Denburg et al., 1987). Similar to humans, BRA were detected in the serum of diseased MRL-lpr mice (Moore, 1990; Zameer and Hoffman, 2001; Hoffman and Madsen, 1990) and have been proposed to play an important role in the pathogenesis of functional deficits (Crimando et al., 1997). Another model of NP-SLE has recently demonstrated that increased permeability of the blood–brain barrier is instrumental in allowing circulating BRA access to the CNS, causing subsequent neuronal damage and behavioral impairment (Kowal et al., 2004). Although our recent work points to the importance of intrathecally synthesized CSF antibodies (Sakic et al., submitted for publication), it is possible that circulating antibodies also contribute to the CNS pathogenesis in MRL-lpr mice. With respect to brain antigen specificity, a subtype of anti-DNA antibodies was found in the CSF of an NP-SLE patient that cross-react with NMDA receptors inducing exocytotoxic neuronal death in the mouse hippocampus (DeGiorgio et al., 2001). As an alternative to direct binding to neuronal receptors, antibodies may disrupt cerebral vasculature and blood flow, leading to focal NP symptoms such as ischemia, or bind to regulatory centers and alter endocrine function (Perry and Miller, 1992). It is possible that the issue of binding specificity could be better understood by elucidating factors that mediate IgG charge differential and how this change relates to IgG-mediated neurotoxicity in the MRL model. A more selective proteomic analysis with narrow pH ranges (to resolve the IgG entities) and analysis of post-translational modifications will be required to answer these questions.
Acknowledgments
This work was supported by funds from the National Institute of Health (1R21 AR49163-01) to B. Sakic, who is a recipient of the Father Sean O’Sullivan Research Centre career development award. D. Ballok is a student fellow of the Canadian Institutes of Health Research. There are no financial or other conflicts of interest related to this work.
References
- Abbott NJ, Mendonca LL, Dolman DE. The blood–brain barrier in systemic lupus erythematosus. Lupus. 2003;12:908–915. doi: 10.1191/0961203303lu501oa. [DOI] [PubMed] [Google Scholar]
- Alexander EL, Murphy ED, Roths JB, Alexander GE. Congenic autoimmune murine models of central nervous system disease in connective tissue disorders. Ann Neurol. 1983;14:242–248. doi: 10.1002/ana.410140211. [DOI] [PubMed] [Google Scholar]
- Ballok DA, Millward JM, Sakic B. Neurodegeneration in autoimmune MRL-lpr mice as revealed by Fluoro Jade B staining. Brain Res. 2003;964:200–210. doi: 10.1016/s0006-8993(02)03980-x. [DOI] [PubMed] [Google Scholar]
- Baum KA, Hopf U, Nehrig C, Stover M, Schorner W. Systemic lupus erythematosus: neuropsychiatric signs and symptoms related to cerebral MRI findings. Clin Neurol Neurosurg. 1993;95:29–34. doi: 10.1016/0303-8467(93)90088-x. [DOI] [PubMed] [Google Scholar]
- Bell CL, Partington C, Robbins M, Graziano F, Turski P, Kornguth S. Magnetic resonance imaging of central nervous system lesions in patients with lupus erythematosus. Correlation with clinical remission and antineurofilament and anticardiolipin antibody titers. Arthritis Rheum. 1991;34:432–441. doi: 10.1002/art.1780340408. [DOI] [PubMed] [Google Scholar]
- Bluestein HG, Woods VL. Antineuronal antibodies in systemic lupus erythematosus. Arthritis Rheum. 1982;25:773–778. doi: 10.1002/art.1780250711. [DOI] [PubMed] [Google Scholar]
- Bluestein HG, Zvaifler NJ. Antibodies reactive with central nervous system antigens. Human Pathol. 1983;14:424–428. doi: 10.1016/s0046-8177(83)80287-1. [DOI] [PubMed] [Google Scholar]
- Bluestein HG, Williams GW, Steinberg AD. Cerebrospinal fluid antibodies to neuronal cells: association with neuropsychiatric manifestations of systemic lupus erythematosus. Am J Med. 1981;70:240–246. doi: 10.1016/0002-9343(81)90756-7. [DOI] [PubMed] [Google Scholar]
- Bosma GP, Middelkoop HA, Rood MJ, Bollen EL, Huizinga TW, van Buchem MA. Association of global brain damage and clinical functioning in neuropsychiatric systemic lupus erythematosus. Arthritis Rheum. 2002;46:2665–2672. doi: 10.1002/art.10574. [DOI] [PubMed] [Google Scholar]
- Brooks WM, Sabet A, Sibbitt WL, Barker PB, van Zijl PC, Duyn JH, Moonen CT. Neurochemistry of brain lesions determined by spectroscopic imaging in systemic lupus erythematosus. J Rheumatol. 1997;24:2323–2329. [PubMed] [Google Scholar]
- Cabanas F, Pellicer A, Valverde E, Morales C, Quero J. Central nervous system vasculopathy in neonatal lupus erythematosus. Pediatr Neurol. 1996;15:124–126. doi: 10.1016/0887-8994(96)00159-2. [DOI] [PubMed] [Google Scholar]
- Christenson RH, Behlmer P, Howard JF, Jr, Winfield JB, Silverman LM. Interpretation of cerebrospinal fluid protein assays in various neurologic diseases. Clin Chem. 1983;29:1028–1030. [PubMed] [Google Scholar]
- Colamussi P, Giganti M, Cittanti C, Dovigo L, Trotta F, Tola MR, Tamarozzi R, Lucignani G, Piffanelli A. Brain single-photon emission tomography with Tc-99m-HMPAO in neuropsychiatric systemic lupus erythematosus: relations with EEG and MRI findings and clinical manifestations. Eur J Nucl Med. 1995;22:17–24. doi: 10.1007/BF00997243. [DOI] [PubMed] [Google Scholar]
- Crimando J, Cooper K, Hoffman SA. Inhibition of sodium channel currents by antineuronal autoantibody from autoimmune mice. Ann N Y Acad Sci. 1997;823:303–307. doi: 10.1111/j.1749-6632.1997.tb48404.x. [DOI] [PubMed] [Google Scholar]
- Danon YL, Garty BZ. Autoantibodies to neuroblastoma cell surface antigens in neuropsychiatric lupus. Neuropediatrics. 1986;17:23–27. doi: 10.1055/s-2008-1052494. [DOI] [PubMed] [Google Scholar]
- DeGiorgio LA, Konstantinov KN, Lee SC, Hardin JA, Volpe BT, Diamond B. A subset of lupus anti-DNA antibodies cross-reacts with the NR2 glutamate receptor in systemic lupus erythematosus. Nat Med. 2001;7:1189–1193. doi: 10.1038/nm1101-1189. [DOI] [PubMed] [Google Scholar]
- Denburg JA, Carbotte RM, Denburg SD. Neuronal antibodies and cognitive function in systemic lupus erythematosus. Neurology. 1987;37:464–467. doi: 10.1212/wnl.37.3.464. [DOI] [PubMed] [Google Scholar]
- Denenberg VH, Sherman GF, Rosen GD, Morrison L, Behan PO, Galaburda AM. A behavior profile of the MRL/Mp lpr/lpr mouse and its association with hydrocephalus. Brain Behav Immun. 1992;6:40–49. doi: 10.1016/0889-1591(92)90058-v. [DOI] [PubMed] [Google Scholar]
- Farrell M, Sakic B, Szechtman H, Denburg JA. Effect of cyclophosphamide on leucocytic infiltration in the brain of MRL/lpr mice. Lupus. 1997;6:268–274. doi: 10.1177/096120339700600310. [DOI] [PubMed] [Google Scholar]
- Gallo P, Bracco F, Tavolato B. Blood–brain barrier damage restricts the reliability of quantitative formulae and isoelectric focusing in detecting intrathecally synthesized IgG. J Neurol Sci. 1988;84:87–93. doi: 10.1016/0022-510x(88)90177-3. [DOI] [PubMed] [Google Scholar]
- Gonzalez-Scarano F, Lisak RP, Bilaniuk LT, Zimmerman RA, Atkins PC, Zweiman B. Cranial computed tomography in the diagnosis of systemic lupus erythematosus. Ann Neurol. 1979;5:158–165. doi: 10.1002/ana.410050209. [DOI] [PubMed] [Google Scholar]
- Gotzmann J, Gerner C. A method to produce Ponceau replicas from blots: application for Western analysis. Electrophoresis. 2000;21:523–525. doi: 10.1002/(SICI)1522-2683(20000201)21:3<523::AID-ELPS523>3.0.CO;2-L. [DOI] [PubMed] [Google Scholar]
- Greenwood DL, Gitlits VM, Alderuccio F, Sentry JW, Toh BH. Autoantibodies in neuropsychiatric lupus. Autoimmunity. 2002;35:79–86. doi: 10.1080/08916930290016547. [DOI] [PubMed] [Google Scholar]
- Hampton DW, Seitz A, Chen P, Heber-Katz E, Fawcett JW. Altered CNS response to injury in the MRL/MpJ mouse. Neuroscience. 2004;127:821–832. doi: 10.1016/j.neuroscience.2004.05.057. [DOI] [PubMed] [Google Scholar]
- Handa R, Sahota P, Kumar M, Jagannathan NR, Bal CS, Gulati M, Tripathi BM, Wali JP. In vivo proton magnetic resonance spectroscopy (MRS) and single photon emission computerized tomography (SPECT) in systemic lupus erythematosus (SLE) Magn Reson Imaging. 2003;21:1033–1037. doi: 10.1016/s0730-725x(03)00200-5. [DOI] [PubMed] [Google Scholar]
- Hess DC, Taormina M, Thompson J, Sethi KD, Diamond B, Rao R, Feldman DS. Cognitive and neurologic deficits in the MRL/lpr mouse: a clinicopathologic study. J Rheumatol. 1993;20:610–617. [PubMed] [Google Scholar]
- Hirohata S, Hirose S, Miyamoto T. Cerebrospinal fluid IgM, IgA, and IgG indexes in systemic lupus erythematosus. Their use as estimates of central nervous system disease activity. Arch Intern Med. 1985;145:1843–1846. [PubMed] [Google Scholar]
- Hoffman SA, Madsen CS. Brain specific autoantibodies in murine models of systemic lupus erythematosus. J Neuroimmunol. 1990;30:229–237. doi: 10.1016/0165-5728(90)90107-x. [DOI] [PubMed] [Google Scholar]
- Huang WS, Chiu PY, Tsai CH, Kao A, Lee CC. Objective evidence of abnormal regional cerebral blood flow in patients with systemic lupus erythematosus on Tc-99m ECD brain SPECT. Rheumatol Int. 2002;22:178–181. doi: 10.1007/s00296-002-0224-9. [DOI] [PubMed] [Google Scholar]
- Huizinga TW, Steens SC, van Buchem MA. Imaging modalities in central nervous system systemic lupus erythematosus. Curr Opin Rheumatol. 2001;13:383–388. doi: 10.1097/00002281-200109000-00007. [DOI] [PubMed] [Google Scholar]
- Isenberg DA, Ravirajan CT, Rahman A, Kalsi J. The role of antibodies to DNA in systemic lupus erythematosus—a review and introduction to an international workshop on DNA antibodies held in London, May 1996. Lupus. 1997;6:290–304. doi: 10.1177/096120339700600316. [DOI] [PubMed] [Google Scholar]
- Jennekens FG, Kater L. The central nervous system in systemic lupus erythematosus: Part 2. Pathogenetic mechanisms of clinical syndromes: a literature investigation. Rheumatology (Oxford) 2002;41:619–630. doi: 10.1093/rheumatology/41.6.619. [DOI] [PubMed] [Google Scholar]
- Jennings JE, Sundgren PC, Attwood J, McCune J, Maly P. Value of MRI of the brain in patients with systemic lupus erythematosus and neurologic disturbance. Neuroradiology. 2004;46:15–21. doi: 10.1007/s00234-003-1049-2. [DOI] [PubMed] [Google Scholar]
- Kaell AT, Shetty M, Lee BC, Lockshin MD. The diversity of neurologic events in systemic lupus erythematosus. Prospective clinical and computed tomographic classification of 82 events in 71 patients. Arch Neurol. 1986;43:273–276. doi: 10.1001/archneur.1986.00520030063016. [DOI] [PubMed] [Google Scholar]
- Kelly MC, Denburg JA. Cerebrospinal fluid immunoglobulins and neuronal antibodies in neuropsychiatric systemic lupus erythematosus and related conditions. J Rheumatol. 1987;14:740–744. [PubMed] [Google Scholar]
- Klein D, Kern RM, Sokol RZ. A method for quantification and correction of proteins after transfer to immobilization membranes. Biochem Mol Biol Int. 1995;36:59–66. [PubMed] [Google Scholar]
- Komatsu N, Kodama K, Yamanouchi N, Okada S, Noda S, Nawata Y, Takabayashi K, Iwamoto I, Saito Y, Uchida Y, Ito H, Yoshikawa K, Sato T. Decreased regional cerebral metabolic rate for glucose in systemic lupus erythematosus patients with psychiatric symptoms. Eur Neurol. 1999;42:41–48. doi: 10.1159/000008067. [DOI] [PubMed] [Google Scholar]
- Kowal C, DeGiorgio LA, Nakaoka T, Hetherington H, Huerta PT, Diamond B, Volpe BT. Cognition and immunity; antibody impairs memory. Immunity. 2004;21:179–188. doi: 10.1016/j.immuni.2004.07.011. [DOI] [PubMed] [Google Scholar]
- Lang B, Dale RC, Vincent A. New autoantibody mediated disorders of the central nervous system. Curr Opin Neurol. 2003;16:351–357. doi: 10.1097/01.wco.0000073937.19076.d5. [DOI] [PubMed] [Google Scholar]
- Levinson SS, Keren DF. Free light chains of immunoglobulins: clinical laboratory analysis. Clin Chem. 1994;40:1869–1878. [PubMed] [Google Scholar]
- Lopez-Longo FJ, Carol N, Almoguera MI, Olazaran J, onso-Farto JC, Ortega A, Monteagudo I, Gonzalez CM, Carreno L. Cerebral hypoperfusion detected by SPECT in patients with systemic lupus erythematosus is related to clinical activity and cumulative tissue damage. Lupus. 2003;12:813–819. doi: 10.1191/0961203303lu470oa. [DOI] [PubMed] [Google Scholar]
- Macri J, McGee B, Thomas JN, Du P, Stevenson TI, Kilby GW, Rapundalo ST. Cardiac sarcoplasmic reticulum and sarcolemmal proteins separated by two-dimensional electrophoresis: surfactant effects on membrane solubilization. Electrophoresis. 2000;21:1685–1693. doi: 10.1002/(SICI)1522-2683(20000501)21:9<1685::AID-ELPS1685>3.0.CO;2-S. [DOI] [PubMed] [Google Scholar]
- Maric D, Millward JM, Ballok DA, Szechtman H, Barker JL, Denburg JA, Sakic B. Neurotoxic properties of cerebrospinal fluid from behaviorally impaired autoimmune mice. Brain Res. 2001;920:183–193. doi: 10.1016/s0006-8993(01)03060-8. [DOI] [PubMed] [Google Scholar]
- McLean BN, Miller D, Thompson EJ. Oligoclonal banding of IgG in CSF, blood–brain barrier function, and MRI findings in patients with sarcoidosis, systemic lupus erythematosus, and Behcet’s disease involving the nervous system. J Neurol Neurosurg Psychiatry. 1995;58:548–554. doi: 10.1136/jnnp.58.5.548. [DOI] [PMC free article] [PubMed] [Google Scholar]
- Miguel EC, Pereira RM, Pereira CA, Baer L, Gomes RE, de Sa LC, Hirsch R, de Barros NG, de Navarro JM, Gentil V. Psychiatric manifestations of systemic lupus erythematosus: clinical features, symptoms, and signs of central nervous system activity in 43 patients. Medicine. 1994;73:224–232. doi: 10.1097/00005792-199407000-00005. [DOI] [PubMed] [Google Scholar]
- Moore PM. Immunoglobulin binding to neuronal cell surface epitopes in murine systemic lupus erythematosus. J Neuroimmunol. 1990;30:101–109. doi: 10.1016/0165-5728(90)90093-3. [DOI] [PubMed] [Google Scholar]
- Moore PM, Joshi I, Ghanekar SA. Affinity isolation of neuron-reactive antibodies in MRL/lpr mice. J Neurosci Res. 1994;39:140–147. doi: 10.1002/jnr.490390204. [DOI] [PubMed] [Google Scholar]
- Nakanishi H. Microglial functions and proteases. Mol Neurobiol. 2003;27:163–176. doi: 10.1385/MN:27:2:163. [DOI] [PubMed] [Google Scholar]
- Okamura M, Kanayama Y, Amastu K, Negoro N, Kohda S, Takeda T, Inoue T. Significance of enzyme linked immunosorbent assay (ELISA) for antibodies to double stranded and single stranded DNA in patients with lupus nephritis: correlation with severity of renal histology. Ann Rheum Dis. 1993;52:14–20. doi: 10.1136/ard.52.1.14. [DOI] [PMC free article] [PubMed] [Google Scholar]
- Omdal R, Selseth B, Klow NE, Husby G, Mellgren SI. Clinical neurological, electrophysiological, and cerebral CT scan findings in systemic lupus erythematosus. Scand J Rheumatol. 1989;18:283–289. doi: 10.3109/03009748909095031. [DOI] [PubMed] [Google Scholar]
- Perry S, Miller F. Psychiatric aspects of systemic lupus erythematosus. In: Lahita RG, editor. Systemic Lupus Erythematosus. Churchill Livingstone; New York: 1992. pp. 845–863. [Google Scholar]
- Rahman A. Autoantibodies, lupus and the science of sabotage. Rheumatology (Oxford) 2004;43:1326–1336. doi: 10.1093/rheumatology/keh354. [DOI] [PubMed] [Google Scholar]
- Sabbadini MG, Manfredi AA, Bozzolo E, Ferrario L, Rugarli C, Scorza R, Origgi L, Vanoli M, Gambini O, Vanzulli L, Croce D, Campana A, Messa C, Fazio F, Tincani A, Anzola G, Cattaneo R, Padovani A, Gasparotti R, Gerli R, Quartesan R, Piccirilli M, Farsi A, Emmi E, Passaleva A. Central nervous system involvement in systemic lupus erythematosus patients without overt neuropsychiatric manifestations. Lupus. 1999;8:11–19. doi: 10.1191/096120399678847344. [DOI] [PubMed] [Google Scholar]
- Sakic B, Szechtman H, Denburg SD, Carbotte RM, Denburg JA. Brain-reactive antibodies and behavior of autoimmune MRL-lpr mice. Physiol Behav. 1993a;54:1025–1029. doi: 10.1016/0031-9384(93)90319-b. [DOI] [PubMed] [Google Scholar]
- Sakic B, Szechtman H, Denburg SD, Carbotte RM, Denburg JA. Spatial learning during the course of autoimmune disease in MRL mice. Behav Brain Res. 1993b;54:57–66. doi: 10.1016/0166-4328(93)90048-u. [DOI] [PubMed] [Google Scholar]
- Sakic B, Szechtman H, Talangbayan H, Denburg SD, Carbotte RM, Denburg JA. Disturbed emotionality in autoimmune MRL-lpr mice. Physiol Behav. 1994a;56:609–617. doi: 10.1016/0031-9384(94)90309-3. [DOI] [PubMed] [Google Scholar]
- Sakic B, Szechtman H, Talangbayan H, Denburg SD, Carbotte RM, Denburg JA. Behaviour and immune status of MRL mice in the postweaning period. Brain Behav Immun. 1994b;8:1–13. doi: 10.1006/brbi.1994.1001. [DOI] [PubMed] [Google Scholar]
- Sakic B, Szechtman H, Denburg JA. Neurobehavioral alteration in autoimmune mice. Neurosci Biobehav Rev. 1997;21:327–340. doi: 10.1016/s0149-7634(96)00018-8. [DOI] [PubMed] [Google Scholar]
- Sakic B, Szechtman H, Denburg JA, Gorny G, Kolb B, Whishaw IQ. Progressive atrophy of pyramidal neuron dendrites in autoimmune MRL-lpr mice. J Neuroimmunol. 1998;87:162–170. doi: 10.1016/s0165-5728(98)00085-x. [DOI] [PubMed] [Google Scholar]
- Sakic B, Kirkham DL, Ballok DA, Mwanjewe J, Fearon IM, Macri J, et al. Proliferating brain cells are a target of neurotoxic CSF in systemic autoimmune disease. submitted for publication. [DOI] [PMC free article] [PubMed] [Google Scholar]
- Schmued LC, Hopkins KJ. Fluoro-Jade B: a high affinity fluorescent marker for the localization of neuronal degeneration. Brain Res. 2000;874:123–130. doi: 10.1016/s0006-8993(00)02513-0. [DOI] [PubMed] [Google Scholar]
- Seyfert S, Faulstich A. Is the blood–CSF barrier altered in disease? Acta Neurol Scand. 2003;108:252–256. doi: 10.1034/j.1600-0404.2003.00119.x. [DOI] [PubMed] [Google Scholar]
- Sibbitt WL, Sibbitt RR. Magnetic resonance spectroscopy and positron emission tomography scanning in neuropsychiatric systemic lupus erythematosus. Rheum Dis Clin North Am. 1993;19:851–868. [PubMed] [Google Scholar]
- Sibbitt WL, Haseler LJ, Griffey RH, Hart BL, Sibbitt RR, Matwiyoff NA. Analysis of cerebral structural changes in systemic lupus erythematosus by proton MR spectroscopy. Am J Neuroradiol. 1994;15:923–928. (AJNR) [PMC free article] [PubMed] [Google Scholar]
- Theofilopoulos AN. Murine models of lupus. In: Lahita RG, editor. Systemic Lupus Erythematosus. Churchill Livingstone; New York: 1992. pp. 121–194. [Google Scholar]
- Vogelweid CM, Johnson GC, Besch-Williford CL, Basler J, Walker SE. Inflammatory central nervous system disease in lupus-prone MRL/lpr mice: comparative histologic and immunohistochemical findings. J Neuroimmunol. 1991;35:89–99. doi: 10.1016/0165-5728(91)90164-3. [DOI] [PubMed] [Google Scholar]
- Volkow ND, Warner N, McIntyre R, Valentine A, Kulkarni M, Mullani N, Gould L. Cerebral involvement in systemic lupus erythematosus. Am J Physiol Imaging. 1988;3:91–98. [PubMed] [Google Scholar]
- Waterloo K, Omdal R, Jacobsen EA, Klow NE, Husby G, Torbergsen T, Mellgren SI. Cerebral computed tomography and electroencephalography compared with neuropsychological findings in systemic lupus erythematosus. J Neurol. 1999;246:706–711. doi: 10.1007/s004150050436. [DOI] [PubMed] [Google Scholar]
- Williams GW, Bluestein HG, Steinberg AD. Brain-reactive lymphocytotoxic antibody in the cerebrospinal fluid of patients with systemic lupus erythematosus: correlation with central nervous system involvement. Clin Immunol Immunopathol. 1981;18:126–132. doi: 10.1016/0090-1229(81)90016-7. [DOI] [PubMed] [Google Scholar]
- Winfield JB, Shaw M, Silverman LM, Eisenberg RA, Wilson HA, III, Koffler D. Intrathecal IgG synthesis and blood–brain barrier impairment in patients with systemic lupus erythematosus and central nervous system dysfunction. Am J Med. 1983;74:837–844. doi: 10.1016/0002-9343(83)91075-6. [DOI] [PubMed] [Google Scholar]
- Yan Q, Zhang J, Liu H, Babu-Khan S, Vassar R, Biere AL, Citron M, Landreth G. Anti-inflammatory drug therapy alters beta-amyloid processing and deposition in an animal model of Alzheimer’s disease. J Neurosci. 2003;23:7504–7509. doi: 10.1523/JNEUROSCI.23-20-07504.2003. [DOI] [PMC free article] [PubMed] [Google Scholar]
- Yoshio T, Hirata D, Onda K, Nara H, Minota S. Antiribosomal P protein antibodies in cerebrospinal fluid are associated with neuro-psychiatric systemic lupus erythematosus. J Rheumatol. 2005;32:34–39. [PubMed] [Google Scholar]
- Zameer A, Hoffman SA. Immunoglobulin binding to brain in autoimmune mice. J Neuroimmunol. 2001;120:10–18. doi: 10.1016/s0165-5728(01)00412-x. [DOI] [PubMed] [Google Scholar]
- Zameer A, Hoffman SA. B and T cells in the brains of autoimmune mice. J Neuroimmunol. 2004;146:133–139. doi: 10.1016/j.jneuroim.2003.10.052. [DOI] [PubMed] [Google Scholar]