

Abstract
Objective
High-field strength proton magnetic resonance spectroscopy (1H-MRS) and peripheral blood analyses reported in the literature reveal glutamate (Glu) and glutamine (Gln) abnormalities in schizophrenia. Given the relative ease and feasibility of using peripheral measures, the present study investigates the relation between peripheral and brain Glu and Gln levels.
Methods
We recruited healthy volunteers (n = 17, mean age 21.9 [standard deviation 2.9, range 18–29] yr) between May and December 2005. All participants underwent 3 Tesla 1H-MRS analysis with segmentation (grey matter, white matter, cerebrospinal fluid) at the Nuclear Magnetic Resonance Centre at the University of Alberta Hospital to quantify medial prefrontal cortical (mPFC) Glu and Glx (i.e., combination of Glu and Gln). Within 1 week of 1H-MRS analysis, we collected plasma from the same participants for Glu and Gln quantification, using high-performance liquid chromatography at the Neurochemical Research Unit at the University of Alberta.
Results
There was no correlation between plasma Glu and either medial prefrontal cortical Glu or Glx (R1,15 = 0.019, p = 0.944 and R1,15 = 0.081, p = 0.757, respectively). Similarly, there was no correlation between plasma Gln and either mPFC Glu or Glx (R1,15 = 0.029, p = 0.911 and R1,15 = 0.025, p = 0.925, respectively).
Conclusion
Our findings support the use of 1H-MRS, instead of peripheral blood analysis, for investigating glutamatergic dysfunction in the brain.
Medical subject headings: glutamate, glutamine, magnetic resonance spectroscopy, prefrontal cortex, plasma, schizophrenia
Abstract
Objectif
La spectroscopie par résonance magnétique des protons à champ de force puissant (1H-MRS) et les analyses de sang périphérique décrites dans les publications révèlent des anomalies du glutamate (Glu) et de la glutamine (Gln) dans les cas de schizophrénie. Comme il est relativement facile et faisable d'utiliser des mesures du sang périphérique, la présente étude porte sur le lien entre la concentration de Glu et de Gln dans le sang périphérique et dans le cerveau.
Méthodes
Nous avons recruté des volontaires en bonne santé (n = 17, âge médian de 21,9 [écart type de 2,9; plage de 18 à 29] ans) entre mai et décembre 2005. Tous les patients ont subi à une analyze 1H-MRS à 3 Tesla avec segmentation (matière grise, matière blanche, liquide céphalorachidien) au Centre de résonance magnétique nucléaire de l'Hôpital de l'Université de l'Alberta afin de quantifier les concentrations de Glu et de Glx (c.-à-d. combinaison de Glu et de Gln) dans le cortex préfrontal interne (CPFi). Dans la semaine qui a suivi l'analyse 1H-MRS, nous avons prélevé du plasma chez les mêmes participants pour quantifier les concentrations de Glu et de Gln par chromatographie liquide haute performance à l'Unité de recherche neurochimique de l'Université de l'Alberta.
Résultats
Il n'y avait aucune corrélation entre la Glu plasmatique et la concentration de Glu ou de Glx dans le cortex préfrontal interne (R1,15 = 0,019, p = 0,944 et R1,15 = 0,081, p = 0,757 respectivement). De même, il n'y avait aucune corrélation entre la Gln plasmatique et la Glu ou la Glx dans le CPFi (R1,15 = 0,029, p = 0,911 et R1,15 = 0,025, p = 0,925 respectivement).
Conclusion
Nos constatations appuient l'utilisation de la technique 1H-MRS au lieu de l'analyse de sang périphérique pour investiguer une dysfonction glutamatergique dans le cerveau.
Introduction
Glutamate (Glu) dysfunction is an emerging hypothesis of schizophrenia, with N-methyl-D-aspartate (NMDA) Glu receptor hypofunction potentially being a major contributor to the pathophysiology of the illness.1 Studies of in vivo brain Glu and glutamine (Gln) levels with high-field strength proton magnetic resonance spectroscopy (1H-MRS) support the glutamatergic dysfunction hypothesis, with reports of increased Gln (hypothesized to indicate less glutamatergic activity) in the left dorsolateral prefrontal cortex2 and left anterior cingulate cortex3 in first-episode patients, compared with healthy volunteers. Glu and Gln were found to decrease in the thalamus of first-episode patients following 30 months, but not 9 months, of treatment, which is consistent with the finding of low Glu and Gln levels in the left anterior cingulate cortex in medicated patients with a chronic illness.3 However, findings of high Gln in the left anterior cingulate cortex, thalamus3,4 and left medial prefrontal cortex5,6 in chronically ill patients have also been reported. At a lower field strength (< 1.5 Tesla), Glu and Gln are difficult to separate, owing to the overlap of resonances. (This is generally not an issue at higher field strengths of ≥ 3 Tesla.) As a result, most reliable lower-field strength MRS studies the sum of Glu and Gln (expressed as either Glx or Glu + Gln). A reduction in Glx in the prefrontal cortex of patients with chronic illness, compared with both drug-naïve first-episode patients and healthy volunteers,7 as well as findings of lateralized abnormalities with left-sided deficits of Glx in the hippocampus, compared with healthy volunteers, have been reported.8 Other studies, however, showed no differences in Glx in the mesial temporal lobe,9 the dorsolateral prefrontal cortex10 and the left frontal lobe11 in schizophrenia. In a study linking NMDA receptor hypofunction and abnormalities in the Glu–Gln cycle, an acute increase in Gln in the anterior cingulate cortex was found after ketamine administration in healthy volunteers.12
In the few schizophrenia studies examining peripherally circulating (serum/plasma) Glu and Gln levels, abnormalities such as high Glu levels in drug-free, chronically ill patients have been reported,13 whereas other studies have shown no differences in Glu or Gln levels in acutely ill patients, compared with healthy volunteers.14 What is unknown is whether a relation exists between the peripheral Glu/Gln and the central Glu/Gln levels measured by high-field strength 1H-MRS. This potential relation remains unknown, despite the ability of Glu and Gln to cross the blood–brain barrier via active transport at the abluminal and facilitative transport at the luminal endothelial membranes (see for review15). To the best of our knowledge, only 4 studies have investigated central and peripheral Glu and/or Gln levels simultaneously. Three of these studies analyzed serum and cerebrospinal fluid (CSF) levels and found significant positive correlations between serum and CSF Glu16–18 and Gln concentrations.17,18 In-vivo 1H-MRS-derived brain measures and serum levels have only been investigated simultaneously in one study, with reports of a significant increase in serum Glu concentrations, but no change in anterior cingulate Glx after a switch from conventional antipsychotic drugs to olanzapine in patients with schizophrenia.19 Although the authors did not directly examine the correlation between peripheral Glu and central Glx, the discordance between peripheral and central changes suggested a lack of relation between the 2 compartments.
Investigations of neurochemical abnormalities in schizophrenia are crucial for understanding the pathophysiology of the illness and directing future pharmacotherapy development. Currently, high-field strength 1H-MRS is one of the best methods for investigating in vivo Glu and Gln abnormalities. However, the availability of high-field strength 1H-MRS is limited, and the methodologies between different laboratories with access can vary greatly. Given the relative ease and greater feasibility of using peripheral circulating measures clinically, it is important to determine whether peripheral measures reflect levels found centrally with MRS. To this end, the present study investigates the relation between plasma and medial prefrontal cortical (mPFC) measures of Glu and Gln in healthy volunteers.
Methods
Following approval of the study by the University of Alberta Health Research Ethics Board, healthy male volunteers (n = 17, mean age 21.9 [standard deviation {SD 2.9}, range 18–29] yr, 13/17 right-handed) were recruited from the community via poster advertisement. We obtained written informed consent from all participants after the nature of the procedures had been fully explained. All subjects were administered the Structured Clinical Interview for the Diagnostic and statistical manual of mental disorders, fourth edition (DSM-IV),20 to rule out psychopathology. Other exclusion criteria were major neurological or medical illness, history of substance or alcohol abuse, history of significant head injury (loss of consciousness > 20 min) and a positive family history of Axis-I disorders in first-or second-degree relatives.
1H-MRS was performed with a 3-Tesla magnet (Magnex Scientific, Concord, Calif.) equipped with an actively shielded gradient and spectrometer (Surrey Medical Imaging System, Surrey, UK) with a quadrature birdcage resonator. A 2 × 3 × 3-cm voxel (for segmentation and spectroscopy) was positioned so that the 2-cm dimension was centred on and parallel to the midline, using both transverse and coronal gradient echo image series (TE = 20 ms, TR = 500 ms, 5-mm slice thickness, 256 × 256 point resolution). The centre sagittal slice was then used to register the voxel, so that the posterior edge touched the corpus callosum and the inferior edge lay along the anterior commissure–posterior commissure (AC–PC) line. The voxel was then rotated until the corners of the anterior edge were equidistant from the brain surface, while maintaining one corner contacting the AC–PC line and an edge contacting the corpus callosum.
Shimming to less than 0.05 parts per million (ppm) was accomplished with both FASTMAP21 and an “in-house” auto shim routine for fine-tuning of the linear shims. The optimal in vivo Glu contrast to background was achieved with TE = 240 ms, TM = 27 ms and TR = 3 s.22 The long TE time gave minimal macromolecule contamination because of its short T2 relaxation time. Each spectrum was the sum of 512 averages, acquired in 16 blocks of 32 averages. This allowed each of the 16 subspectra to be examined for spectral artifacts owing to subject movement or hardware fluctuations before their final summing. It also allowed reregistering each of the 16 subspectra to the same frequency reference before summing, where necessary. Analysis of the in vivo data with the LCModel (version 6.0–1) analysis program gave reliable measures of Glu, Glx, N-acetylaspartate (NAA) and creatine plus phosphocreatine (Cr), with a typical SD of the fit for both Glu and Glx < 15%, for NAA < 5% and for Cr < 10%. Gln measures were not reliable, with SD of the fit typically > 30%, and therefore were not used for statistical analysis. A representative spectrum used for analysis is shown in Figure 1. All measures derived by MRS are expressed as a ratio to Cr.
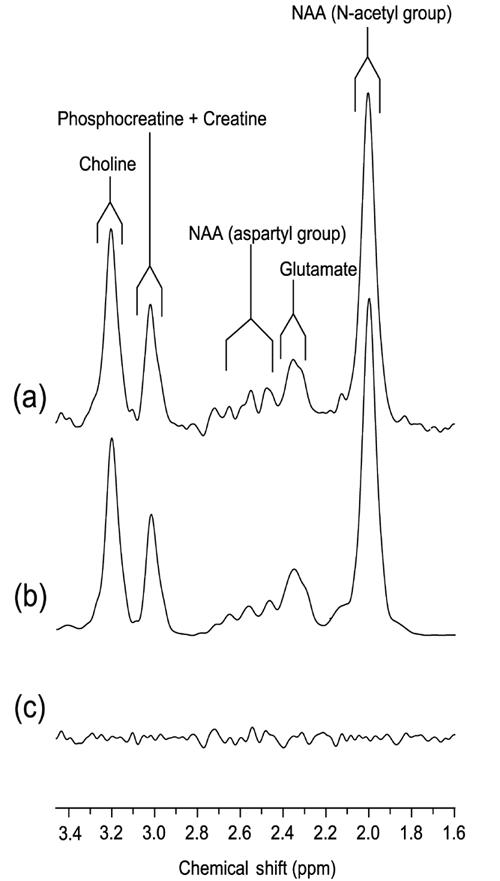
Fig. 1: ypical 1H-MR spectrum acquired from a 2 × 3 × 3-cm voxel located in the medial frontal cortex, with STEAM timings optimized for glutamate (TE, TM = 240, 27 ms). (a) 2Hz exponential filtered spectrum; (b) LCModel fit spectrum; (c) residual noise following subtraction of spectra in (a) and (b).
Segmentation of the frontal brain region was performed with the method previously described.23 In brief, multislice gradient echo imaging in the transverse, sagittal and coronal planes was used to register the PRESS selected volume precisely to the same selected region of brain as that used for the STEAM acquisition. Two hyperbolic secant inversion pulses (110 ms length, bandwidth = 150 Hz) were added to the PRESS pulse sequence; the pulses were 90° with a sinc-Gauss pulse-shaped envelope and 180° optimized-sinc shapes. Prior to the 90° pulses, a 15-ms spoiler gradient was applied to dephase any transverse magnetization resulting from the inversion pulses. The PRESS parameters used for acquiring 1D projections were: TR = 9 s, TE = 120 ms, 2 averages with 5 kHz sample frequency were digitized over 128 data points. Shimming over the PRESS volume was performed by turning the frequency encode gradient off and increasing the digitization to 2048 data points. In the frontal region of the brain, typical line width of the water peak at full width, half-maximum, after shimming to optimize the magnetic field homogeneity was < 0.05 ppm.
We used previous studies to estimate the T1 values for the 3 brain compartments of 1070; SD 60 ms, 720; SD 30 ms and 4440; SD 50 ms for grey matter (GM), white matter (WM) and CSF, respectively. Using the expression derived from Redpath and colleagues,24 2 pairs of Tinv1 and Tinv2 timings were computed, which gave simultaneous nulls of the CSF compartment with either that from GM or WM. Ten 1D projections were acquired for each set of inversion timings and in each case were the sum of 2 averages. An additional 10 1D projections were acquired with no inversion pulses and with a TE of 500 ms, which minimized the signal contamination from GM and WM (< 0.2% residual signal after accounting for T2 losses) while maintaining a significant signal from CSF (approximately 50% residual signal).
After we corrected the phase of each projection, 3D surface and contour maps were generated to confirm that the selected Tinv1 and Tinv2 timings were resulting in simultaneous nulls of CSF with either GM or WM. Subsequently, GM and WM projections were selected from the double inversion recovery 1D projection series. The Tinv1 and Tinv2 timings that were used to acquire these 2 series of projections for either GM or WM were then used to estimate a normalization factor that reflected how much each projection had been attenuated due to T1 and T2 losses; therefore, the timings could fully account for all the acquisition timings. Similarly, a normalization factor was estimated for the CSF projection. Segmentation resulted from first normalizing and then summing the signal across each of the 3 projections, so that the relative proportions of GM, WM and CSF could be estimated.
All computations necessary for calculating experimental timings before acquisition and for data analysis were performed with MATLAB.
Blood was collected from all participants between 8 and 10 am following an overnight fast and within 1 week of 1H-MRS analysis. Plasma was immediately separated with centrifugation and stored at –80°C until analysis with high-performance liquid chromatography (HPLC) with fluorescence detection. Plasma samples (100 μL) were prepared by precipitating the protein with 300 μL methanol. Following centrifugation, the supernatants were used to quantify Glu and Gln with a modified procedure by Hashimoto and others.25 Briefly, HPLC was performed on a Waters Alliance 2690XE instrument coupled with a Waters 474 programmable fluorescence detector (Waters Corporation, Milford, Mass.). Amino acids were subjected to precolumn derivatization with o-phthaldialdehyde (OPA) and N-isobutyryl-L-cysteine (IBLC). A 5-μL aliquot of standard or sample solution was mixed with 5 μL of reagent solution and held in the injection loop 5 minutes before injection. Separation was carried out on a Symmetry C18 column (4.6 × 150 mm, 3.5 μm) from Waters with a methanolic phosphate buffer mobile phase (pH 6.2). The fluorescent amino acid derivatives were monitored at an excitation wavelength of 260 nm and an emission wavelength of 455 nm. Identification and quantification of amino acids in the samples were achieved by comparing retention times and response of authentic standards in a calibration curve.
Correlation analyses between MRS and HPLC measurements of Glu and Gln (or Glx), with α = 0.05 set as the nominal level of significance, were conducted with SPSS 12.0 for Windows.
Results
Mean (and SD) plasma Glu and Gln concentrations were 4.21 (SD 2.49) μg/mL and 68.42 (SD 11.30) μg/mL, respectively. Mean (and SD) mPFC Glu/Cr and Glx/Cr were 2.27 (SD 0.68) and 3.91 (SD 1.74), respectively. There was no correlation between plasma Glu and either mPFC Glu or Glx (R1,15 = 0.019, p = 0.944 and R1,15 = 0.081, p = 0.757, respectively). Similarly, there was no correlation between plasma Gln and either mPFC Glu or Glx (R1,15 = 0.029, p = 0.911 and R1,15 = 0.025, p = 0.925, respectively).
In our study, plasma collection and MRS analysis were conducted on different days and under different conditions (fasting and nonfasting, respectively). We therefore determined whether fasting has an effect on mPFC Glu and Gln levels and whether plasma Glu and Gln levels are stable over time. To examine whether fasting affects mPFC Glu and Glx measures, 6 participants were rescanned after an overnight fast, and the results were compared with those from their nonfasting scans with paired samples t tests. There were no significant differences in either Glu or Glx measures between fasting and nonfasting conditions (t5 = 1.463, p = 0.203 and t5 = 1.118, p = 0.314, respectively). To determine whether plasma Glu and Gln levels are stable over time, we collected and analyzed plasma samples from 16 participants for Glu and Gln levels 9 weeks after the initial analysis. Using paired samples t tests, we found no significant differences in Glu or Gln levels between samples (t15 = –0.865, p = 0.400 and t15 = 0.147, p = 0.885, respectively).
Discussion
We report, to our knowledge, the first study examining the relation between high-field strength 1H-MRS–derived central Glu and Glx and circulating Glu and Gln. We found no relation between mPFC and plasma levels in young healthy male volunteers. Our results are in agreement with a previous study reporting a discordant change in serum Glu and anterior cingulate Glx levels after pharmacological intervention,19 although this study did not investigate correlations between the 2 compartments. In their study, Goff and colleagues also found that, after a switch from typical antipsychotic drugs to olanzepine, brain Glx levels increased in patients with negative symptom improvement19; this provides preliminary evidence that MRS may be a clinically useful tool for assessing neurochemical abnormalities and medication effects in psychiatric disorders. A potential limitation of our study is that phlebotomy and MRS were conducted on different days and under different conditions (fasting and nonfasting, respectively), which may account for the nonsignificant correlations between peripheral and central measures. To examine whether fasting affects mPFC Glu and Glx measures, 6 participants were rescanned after an overnight fast, and the results were compared with those from their nonfasting scans. There were no significant differences in either Glu or Glx measures between fasting and nonfasting conditions, which indicates that fasting does not affect glutamatergic neurotransmission in the brain. Further, Glaeser and colleagues26 showed that, in rats fasted overnight, Glu serum levels were higher, whereas brain levels were the same in rats fed a meal with protein, compared with unfed rats; this indicates that fasting affects peripheral circulating Glu levels without significantly altering brain levels. We also collected and analyzed plasma samples from 16 participants for Glu and Gln levels 9 weeks after the initial analysis and found no significant differences in Glu or Gln levels between these samples and the ones collected originally, suggesting that plasma Glu and Gln measures remain stable over time under fasting conditions.
In combination with our results, findings of significant correlations between serum and CSF Glu and Gln16,17 suggest that CSF levels may not correlate with those found in GM and/or WM, indicating that segmentation is essential for achieving accurate results with MRS.
This study demonstrates that, in healthy volunteers, a simple blood test is not appropriate for investigating glutamatergic neurotransmission in the brain and provides strong support for using a more direct approach, such as high-field strength MRS, for such investigations. Our group is currently investigating both peripheral and central markers of glutamatergic neurotransmission in first-episode psychosis patients and is examining the effects of medication on these systems. This will help determine whether peripheral and/or central measures are clinically useful for investigating glutamatergic dysfunction in schizophrenia and for examining the neurochemical effects of medical intervention.
Acknowledgments
This research was supported by the Bebensee Schizophrenia Research Foundation, University of Alberta Hospital Foundation, Canadian Institutes of Health Research, Alberta Heritage Foundation for Medical Research, Canada Research Chairs and Canada Foundation for Innovation programs, and the Natural Sciences and Engineering Research Council of Canada.
Footnotes
Contributors: Drs. Shulman, Baker and Tibbo designed the study. Drs. Shulman, Grant, Seres, Hanstock and Tibbo acquired the data; Drs. Shulman, Grant, Hanstock, Baker and Tibbo analyzed it. Drs. Shulman and Grant wrote the article; Drs. Seres, Hanstock, Baker and Tibbo critically reviewed it. All authors gave final approval for the article to be published.
Competing interests: None declared.
Correspondence to: Dr. Philip G. Tibbo, Department of Psychiatry, University of Alberta, 1E7.11 WMC, Edmonton AB T6G 2B7; fax 780 407-6672; ptibbo@ualberta.ca
References
- 1.Krystal JH, Karper LP, Seibyl JP, et al. Subanesthetic effects of the noncompetitive NMDA antagonist, ketamine, in humans. Psychotomimetic, perceptual, cognitive, and neuroendocrine responses. Arch Gen Psychiatry 1994;51:199-214. [DOI] [PubMed]
- 2.Stanley JA, Williamson PC, Drost DJ, et al. An in vivo proton magnetic resonance spectroscopy study of schizophrenia patients. Schizophr Bull 1996;22:597-609. [DOI] [PubMed]
- 3.Williamson PC, Theberge J, Malla AK, et al. 4.0 Tesla 1H MRS correlates of neuronal degeneration in the left anterior cingulate and thalamus in first episode and chronic schizophrenic patients. Schizophr Res 2003;60:247.
- 4.Theberge J, Bartha R, Drost DJ, et al. Glutamate and glutamine measured with 4.0 T proton MRS in never-treated patients with schizophrenia and healthy volunteers. Am J Psychiatry 2002;159:1944-6. [DOI] [PubMed]
- 5.Bartha R, Williamson PC, Drost DJ, et al. Measurement of glutamate and glutamine in the medial prefrontal cortex of never-treated schizophrenic patients and healthy controls by proton magnetic resonance spectroscopy. Arch Gen Psychiatry 1997;54:959-65. [DOI] [PubMed]
- 6.Williamson PC, Bartha R, Drost DJ. Glutamate and glutamine on 1H MRS in never treated schizophrenic patients. Schizophr Res 1999;36:249.
- 7.Ohrmann P, Siegmund A, Suslow T, et al. Evidence for glutamatergic neuronal dysfunction in the prefrontal cortex in chronic but not in first-episode patients with schizophrenia: a proton magnetic resonance spectroscopy study. Schizophr Res 2005;73:153-7. [DOI] [PubMed]
- 8.Kegeles LS, Shungu DC, Anjilvel S, et al. Hippocampal pathology in schizophrenia: magnetic resonance imaging and spectroscopy studies. Psychiatry Res 2000;98:163-75. [DOI] [PubMed]
- 9.Bartha R, al-Semaan YM, Williamson PC, et al. A short echo proton magnetic resonance spectroscopy study of the left mesial-temporal lobe in first-onset schizophrenic patients. Biol Psychiatry 1999;45:1403-11. [DOI] [PubMed]
- 10.Stanley JA, Williamson PC, Drost DJ, et al. An in vivo study of the prefrontal cortex of schizophrenic patients at different stages of illness via phosphorus magnetic resonance spectroscopy. Arch Gen Psychiatry 1995;52:399-406. [DOI] [PubMed]
- 11.Block W, Bayer TA, Tepest R, et al. Decreased frontal lobe ratio of N-acetyl aspartate to choline in familial schizophrenia: a proton magnetic resonance spectroscopy study. Neurosci Lett 2000;289:147-51. [DOI] [PubMed]
- 12.Rowland LM, Bustillo JR, Mullins PG, et al. Effects of ketamine on anterior cingulate glutamate metabolism in healthy humans: a 4-T proton MRS study. Am J Psychiatry 2005;162:394-6. [DOI] [PubMed]
- 13.Tortorella A, Monteleone P, Fabrazzo M, et al. Plasma concentrations of amino acids in chronic schizophrenics treated with clozapine. Neuropsychobiology 2001;44:167-71. [DOI] [PubMed]
- 14.Alfredsson G, Wiesel FA. Monoamine metabolites and amino acids in serum from schizophrenic patients before and during sulpiride treatment. Psychopharmacology (Berl) 1989;99:322-7. [DOI] [PubMed]
- 15.Hawkins RA, Peterson DR, Vina JR. The complementary membranes forming the blood-brain barrier. IUBMB Life 2002;54:101-7. [DOI] [PubMed]
- 16.Alfredsson G, Wiesel FA, Tylec A. Relationships between glutamate and monoamine metabolites in cerebrospinal fluid and serum in healthy volunteers. Biol Psychiatry 1988;23:689-97. [DOI] [PubMed]
- 17.Alfredsson G, Wiesel FA, Lindberg M. Glutamate and glutamine in cerebrospinal fluid and serum from healthy volunteers–analytical aspects. J Chromatogr 1988;424:378-84. [DOI] [PubMed]
- 18.McGale EH, Pye IF, Stonier C, et al. Studies of the inter-relationship between cerebrospinal fluid and plasma amino acid concentrations in normal individuals. J Neurochem 1977;29:291-7. [DOI] [PubMed]
- 19.Goff DC, Hennen J, Lyoo IK, et al. Modulation of brain and serum glutamatergic concentrations following a switch from conventional neuroleptics to olanzapine. Biol Psychiatry 2002;51:493-7. [DOI] [PubMed]
- 20.American Psychiatric Association. Diagnostic and statistical manual of mental disorders. 4th ed. Washington: the Association; 1994.
- 21.Gruetter R. Automatic, localized in vivi adjustment of all first-and second-order shim coils. Magn Reson Med 1993;29:804-11. [DOI] [PubMed]
- 22.Thompson RB, Allen PS. Response of metabolites with coupled spins to the STEAM sequence. Magn Reson Med 2001;45:955-65. [DOI] [PubMed]
- 23.Hanstock CC, Allen PS. Segmentation of brain from a PRESS localised single volume using double inversion recovery for simultaneous T1 nulling [poster]. International Society for Magnetic Resonance in Medicine; 2000 Apr 1-7; Denver.
- 24.Redpath TW, Smith FW. Technical note: use of a double inversion recovery pulse sequence to image selectively grey or white brain matter. Br J Radiol 1994;67:1258-63. [DOI] [PubMed]
- 25.Hashimoto A, Nishikawa T, Oka T, et al. Determination of free amino acid enantiomers in rat brain and serum by high-performance liquid chromatography after derivatization with N-tert.-butyloxycarbonyl-L-cysteine and o-phthaldialdehyde. J Chromatogr 1992;582:41-8. [DOI] [PubMed]
- 26.Glaeser BS, Maher TJ, Wurtman RJ. Changes in brain levels of acidic, basic, and neutral amino acids after consumption of single meals containing various proportions of protein. J Neurochem 1983;41:1016-21. [DOI] [PubMed]