Abstract
Glycogenin initiates glycogen synthesis in an autocatalytic reaction in which individual glucose residues are covalently linked to Tyrosine 194 in order to form a short priming chain of glucose residues that is a substrate for glycogen synthase which, combined with the branching enzyme, catalyzes the bulk synthesis of glycogen. We sought to develop a new enzymatic assay to better characterize both the chemical and enzymatic characteristics of this unusual reaction. By directly detecting the reaction products using electrospray mass spectrometry this procedure permits both the visualization of the intact individual reaction species produced as a function of time and quantitation of the levels of each of species. The quantitation of the reaction agrees well with previous measurements of both catalytic rate and the change in rate as a function of average glucosylation. The results from this assay provide new insight into the mechanism by which glycogenin catalyzes the initiation reaction.
INTRODUCTION
Glycogen is a reserve of glucose which is synthesized during periods of glucose availability and broken down when metabolic demand for glucose exceeds that available from extracellular sources [1]. Glycogen is a branched polymer of glucose connected by α-1,4-glycosidic linkages with branch points occurring, on average, every ten to thirteen glucose residues through α-1,6-glycosidic linkages [1]. The bulk synthesis of glycogen is catalyzed by glycogen synthase, in concert with the branching enzyme, while its initiation is mediated an autocatalytic process catalyzed by a specialized enzyme, glycogenin [2,3]. Glycogenin-like molecules have been found across much of the animal kingdom [4].
The reaction catalyzed by glycogenin is autocatalytic, in that a solution of glycogenin, when provided with UDP-glucose catalyzes the formation of short linear glucose chains covalently attached to a specific residue on the protein surface. Tyr194 has been identified as the site of attachment in mammalian muscle forms of glycogenin [5]. Glycogenin continues to transfer glucose residues to this growing nascent chain of glucose residues until the chain length approaches ~10 residues, past which the efficiency of transfer decreases [6,7]. Glycogenin is a member of the glycosyltransferase superfamily of enzymes and is classified as a member of glycosyltransferase family 8, a family comprised of enzymes with widely diverse cellular functions. We have previously characterized both the structural and chemical aspects of the reaction catalyzed by glycogenin [8,9]. However, much of the work has been hampered by the inability to directly monitor the reaction products as a function of chain length. Prior characterization of the reaction products has either utilized a 14C-incorporation assay that determines only the average amount of glucose incorporated into the protein as a function of time or has characterized the nature of the glucosylated products following a number of post-catalytic treatments, such as trypsinization and separation of the peptides by HPLC [10].
We sought to develop an assay system that could both determine the nature of the glucosylated species produced during catalysis and also provide absolute quantitation of the level of each species produced as a function of time. Here we describe a method that provides a direct measurement of the individual species of glucosylated glycogenin that are produced during a time course and show that the amounts of each species obtained in the mass spectrum is directly proportional to its concentration in solution. A surprising outcome of this work is that the early stages of the self-glucosylation reaction appear not to follow a distributive mechanism where each protein molecule randomly serves as substrate for the next step in the reaction. Glycogenin would appear to catalyze a reaction that appears biphasic in mechanistic behavior where the early stages of the reaction exhibits some aspects of a processive enzymatic mechanism that becomes more distributive in nature as the chain length increases.
METHODS
Purification of glucose naïve glycogenin
Glycogenin devoid of added glucose residues was produced by expression of recombinant protein in the CGSC Escherichia coli cell line 4997, which lacks UDP-glucose pyrophosphorylase activity, driven by the pTacTac vector into which the wild-type rabbit muscle glycogenin gene had been subcloned [9]. Briefly, cell line 4997 was transformed with the pTacTac vector containing the glycogenin gene using ampicillin resistance as the selectable marker. Following the inoculation of four liters of LB bacterial growth media containing 100 μg/ml of ampicillin, the cells were allowed to grow at 37ºC in shaking flasks until the optical density of the culture reached 0.6 at 595 nm. The expression of glycogenin was induced through the addition of 0.1 mM isopropyl-β-thiogalactopyranoside (IPTG) to the culture medium. Following the addition of IPTG, the cell culture was placed on a shaking incubator at 18ºC for an additional 16 hours. The cells were harvested by centrifugation at 4,000 x g and resuspended in lysis buffer containing 50 mM Na-HEPES, pH 7.5, 1mM Na-EDTA, 1 mM benzamidine and 1 mM DTT. Cell lysis was accomplished using a French Press operated at 1000 psi and a clarified lysate supernatant was prepared by centrifugation at 100,000 x g in a Beckman Ti45 ultracentrifuge rotor. The supernatant was passed over a 10 ml column of nickel-NTA resin (Ni-NTA, Qiagen) equilibrated in lysis buffer, lacking DTT and the bound protein was eluted after an initial wash with column buffer containing 10 mM imidazole, with column buffer containing 50 mM imidazole. Those fractions containing glycogenin eluted from the Ni-NTA column as judged by SDS-PAGE analysis were pooled and diluted 10-fold with Q-sepharose equilibration buffer (50 mM Na-HEPES, pH 7.5, 5 mM DTT, 2 mM benzamidine and 1 mM Na-EDTA) and concentrated to the original volume using an Amicon stirred-cell concentrator with a 30 kD molecular weight cut-off membrane. This buffer-exchanged Ni-NTA pool was passed over a 15 ml Q-sepharose column and the unbound proteins were removed with 3 column volumes of equilibration buffer. The bound glycogenin was eluted using a linear gradient (0.0-0.5 M NaCl) in equilibration buffer in a total volume equivalent to 20 column volumes. Those fractions containing pure glycogenin protein, as assessed by SDS-PAGE analysis, were pooled and dialyzed against 15 mM HEPES, pH 7.5 and 1 mM DTT. Following concentration of the dialyzed protein pool, it was concentrated to 8 mg/ml, and 100 μl aliquots were flash frozen in liquid nitrogen and stored at −80ºC until use. Glycogenin stored in this manner is stable for at least 2 years.
Enzyme Assays
The ability of wild-type glucosylated and non-glucosylated glycogenins to catalyze self-glucosylation was assessed using two different assays. The original assay is based on the incorporation of 14C-glucose into glycogenin [11] in a reaction containing between 0.6 to 1.8 μM enzyme in 50 mM Na-HEPES, pH 7.5, 5 mM MnCl2, 2 mM dithiothreitol, and 30 μM UDP-[U-14C]glucose in a total volume of 10 μL which was incubated for either 1 or 2.5 minutes at 30°C. An aliquot (5 μl) removed from the reaction was spotted onto P81 chromatography paper which was then washed three times (30 minutes each wash) in 0.5% phosphoric acid and once in ethanol. The dried paper was counted in a liquid scintillation counter. The second assay was designed for analysis by mass spectrometry and contained 25 mM HEPES, pH 7.5, 1 mM MnCl2, 1mM UDP-glucose and 5 μM non-glucosylated glycogenin. These assays were terminated after 0, 2, 4, 10, 20 and 60 minutes by the addition of Na-EDTA to a final concentration of 20 mM and flash-frozen in liquid nitrogen for storage prior to mass spectrometry analysis.
Mass spectrometry
The mass spectrometric analysis was performed using a Micromass Q-TOF instrument fitted with a Z-spray ion source (Waters, Milford, MA, USA). The instrument was calibrated using both multipoint and single point calibration procedures prior to the analysis of a set of time points and between each complete set of time points. Intact horse heart myoglobin was used for the multipoint calibration procedure and the [Glu1]-fibrinopeptide was used for single point calibration. Samples were introduced to the mass analyzer using a self-packed pre-“trapping” reversed phase capillary column (200 μm i.d. and 1 cm in length with a reversed-phase C4 resin; 5 μm average particle size, 300 Å pore size) (Macherey-Nagel, Easton, PA, USA) before an “analytical” capillary column (100 μm i.d. and 5 cm packed length of the same C4 resin). A manual flow splitting set-up allowed for the mobile phase running velocity to fluctuate in the 500–700 nL/min range depending upon gradient characteristics. The gradient profile consisted of a linear gradient from 100% A (0.1% formic acid/3% acetonitrile/96.9%H2O, v/v) to 70% B (0.1% formic acid/2.9% H2O/97% acetonitrile, v/v) in 30 min followed by a linear gradient to 100% B in 10 min. Mass spectra were acquired in positive ion mode through an m/z range from 800–2000 Th. Deconvolution of the whole protein multicharge envelopes was performed using MassLynx version 3.5 (MaxEnt1 function).
Calculation of rates based on Mass Spectra
Each mass spectrum was internally normalized such that only the relative peak heights from within a single run were quantitated. In this way, variability in total ionization rates and sample injection differences could be controlled. Total ion counts, after conversion to area under the curve values, were determined for each of the glycogenin species by analyzing the spectra for species related to the mass of the non-glucosylated species, G0, by (G0 + n[162.2]) +/− 3.5 daltons; where n equals the number of glucose residues. The value of each total ion count was then multiplied by the number of glucoses associated with each glucosylated species in order to indicate the number of individual turnovers associated with the production of that species (eg [AUC4]x4, for the species with four glucoses attached). These normalized counts were summed as an indicator of the total number of turnovers that occurred during that time frame; TT = {∑n[(AUCn) x n]}. Then the normalized totals were divided by the sum of the actual total ion counts for all species {TC = [∑n(AUCn)]} to give the average number of glucoses added to all glycogenin species present in the mass spectra per unit of time (average turnover = kcat = TT/TC). By performing this type of normalization within each spectrum we could minimize the effects of run to run variation in column efficiency and ionization rates and we could express the relative concentration of each species as a fraction of the total within each time point (ie [AUC4]/TC) and compare the relative concentration of each individual species as a function of time between time points. Interval kcat values were calculated by dividing the difference in average glucosylation level between time points by the time interval between the assay points {[kcat(y) − kcat(x)]/[time(y) – time(x)]}. All the reported values represent the average of four measurements of each time point; two independent analyses each from duplicate assays at each time point.
RESULTS AND DISCUSSION
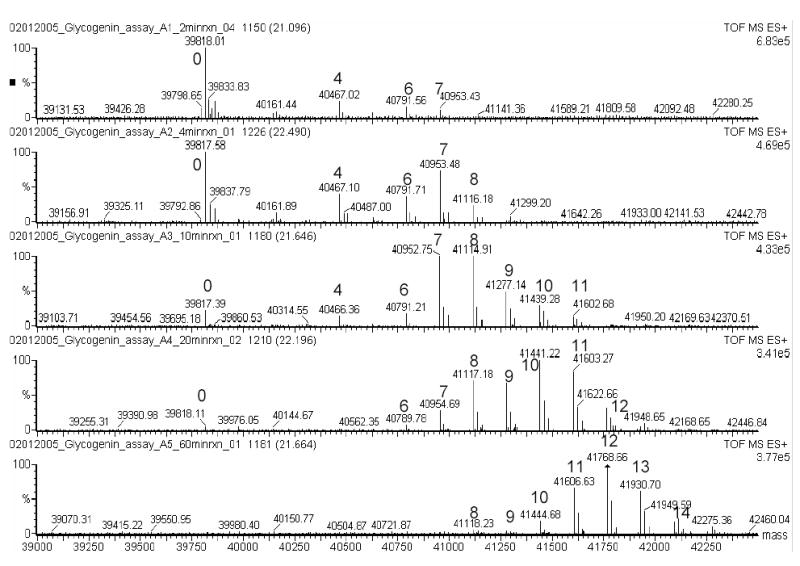
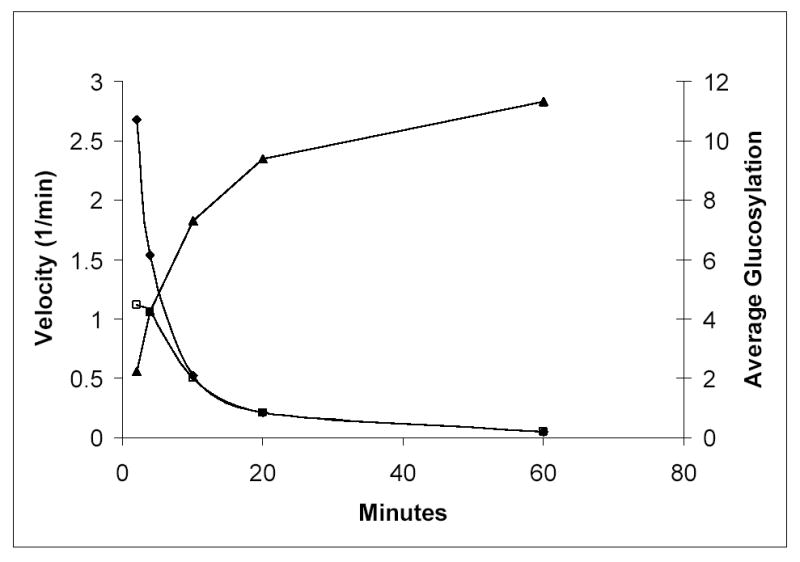
We investigated whether it was feasible to develop a mass spectrometry based assay system for the characterization and quantitation of the reaction catalyzed by the enzyme glycogenin. Initially, we sought to separate and quantitate the individual species chromatographically prior to injection into the mass spectrometer for mass identification of each peak. However, complete chromatographic separation of the individual species was not required for effective resolution of the individual species by the mass spectrometer as the time dependent changes in the reaction products can be clearly resolved (Figure 1). Figure 1 represents a single measurement from one assay set, however the results were highly reproducible within each time point from one analysis to the next. After 60 minutes of incubation the glycogenin molecules possessed an average glucosyl chain length of 11.3 residues, though species with as many as 16 glucose residues were detected. In addition, quantitation of the absolute amounts of each product species present at each time point permitted calculations of catalytic turnover rates. The average turnover number (TT/TC, see methods) calculated from this analysis agrees well with previous assay measurements that monitored the incorporation of 14C-glucose into the glycogenin protein following fixation to filter paper ([9] and Table 1). We could also calculate the net and interval turnover rates for longer time points. In agreement with prior reports [6,7] the catalytic effectiveness of glycogenin falls off dramatically as the average glucosyl chain length increases (Table 1 and Figure 2). Interestingly, if one accounts for the fraction of the sample that has undergone catalysis ([interval kcat]/[fraction glucosylated]), the falloff in turnover rate is nearly hyperbolic (Figure 2). This falloff is not due to substrate depletion since the total amount of glucose attached to glycogenin at the final time point equates to 57 μM (based on an average of 11.3 glucoses per glycogenin molecule at 5 μM glycogenin concentration) which represents less than 6% of the starting UDP-glucose concentration. We also compared the present interval turnover rates obtained with kcat values obtained from glycogenin samples that are already glucosylated by virtue of expression in E. coli strains that produce UDP-glucose. Here we find that the recombinantly expressed glucosylated glycogenin has a turnover rate similar to glycogenin that has an approximate level of glucosylation equal to 7.5, which agrees quite well with an average level of glucosylation equal to 8.2 based on mass spectrometry of the glucosylated material (data not shown). These data combined directly support the observation that the catalytic efficiency of glycogenin does fall off in a dramatic fashion as the chain length increases and our new assay permits direct measurement of this effect.
Figure 1.

Representative deconvoluted mass spectra for the molecular species with masses between 39,000 and 42,500 daltons as a function of time (2, 4, 10, 20 and 60 minute time points, top to bottom, respectively). Species corresponding to different glucosylated forms of glycogenin are label according to the number of glucoses attached (eg, ‘0’ refers to the non-glucosylated form and ‘4’ refers to the species with four glucose residues attached).
Table 1.
A Comparison of Turnover Rates for Glycogenin
| Mass Spectrometry Assay (min−1) | 14C-glucose Incorporation Assay (min−1) | |
|---|---|---|
| Non-glucosylated Protein | 1.1 ± 0.1 | 0.84 ± 0.30 |
| Glucosylated Protein | 0.5 ± 0.05 (4′–10′ interval)
0.21 ± 0.03 (10′–20′ interval) 0.05 ± 0.01 (20′–60′ interval) |
0.32 ± 0.09 |
Figure 2.

Average glucosylation levels and interval reaction velocities as a function of time. (▴) Average level of glucose incorporation into all forms of glycogenin, including the non-glucosylated form. (□) Interval reaction velocity, calculated by dividing the difference in average glucosylation level between time points by the time interval between the two time points. (♦) Interval reaction velocity divided by the fraction of the glycogenin species that are glucosylated (eg. at 2 minutes the interval reaction velocity is 1.1 and the fraction glucosylated is 0.42).
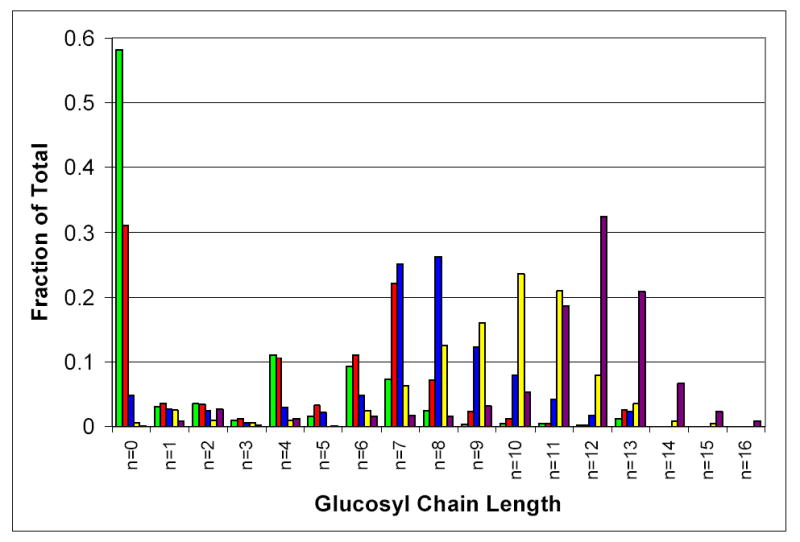
A striking feature of the data obtained using this assay system is the time dependent change in the distribution of the species over the course of the reaction. The distribution of species at the early time points is not consistent with a distributive mechanism in which all protein molecules are equally reactive (Figure 3). The data are more consistent with elements of a processive transferase mechanism, such as the polymerization reaction during DNA or RNA synthesis though the extent of processivity is considerably less. For instance, the catalytic turnover for the initial two minutes of the assay is consistent with an average incorporation of 2.2 molecules of glucose into each glycogenin molecule present. However, since 58% of the glycogenin molecules have not yet been glucosylated, the average number of glucoses actually added to those glycogenin molecules that have undergone catalytic events is 5.2 (Figures 2 & 3). In addition, several species never appear to accumulate high levels during the reaction, namely the mono-, di-, tri-, and pentaglucosylated species, while the tetra- and hexa-glucosylated species clearly accumulate during the initial stages of the reaction (Figure 3). The fact that, at the 2, 4 and 10 minute time points, there are still easily detectable levels of the non-glucosylated protein remaining in the assay sample suggests that the shorter chain species are not being missed due to not sampling early enough in the reaction. In addition, since the turnover rates calculated from this data agree within experimental error with that obtained from the 14C-incorporation assay (Table 1), any systematic loss of specific reaction products is apparently not significant.
Figure 3.

Histogram showing the average time dependent quantitative distribution of glucosylated species produced during the reaction catalyzed by glycogenin. Distribution of species at (
 ) 2 minutes, (
 ) 4 minutes, (
 ) 10 minutes (
 ) 20 minutes and (
 ) 60 minutes after the initiation of the reaction.
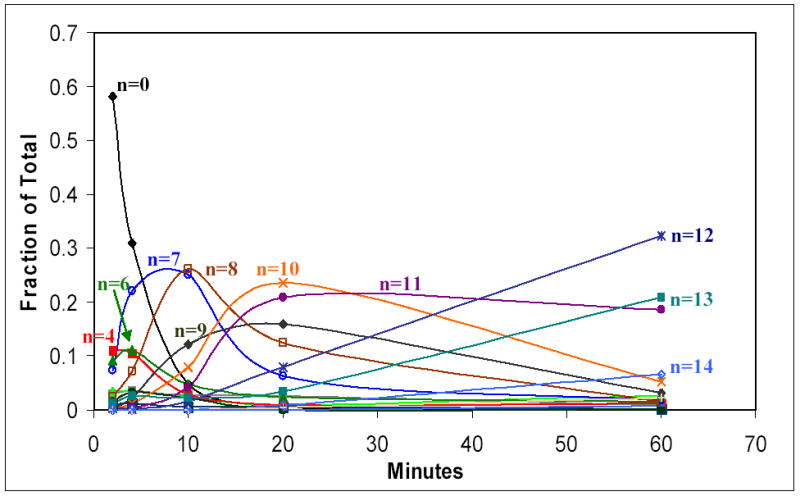
Based on this data, it would appear that during the early stages of the reaction there is a slow step associated with the tetra- and hexa-glucosylated species that cause these species to accumulate during the reaction. In contrast to the uneven distribution of species at the shorter time points, the distribution of glucosylated species becomes more guassian as time progresses and all the protein clearly becomes glucosylated (Figures 1 and 3). These observations suggest that a significant sub-population of completely inactive or unfolded protein does not exist in the sample. One interpretation of the present data is that the reaction might proceed in two distinct phases. The first phase would appear to include the initial O-glucosylation of Tyr194 and subsequent extension up to 4 to 6 glucose residues (Figure 4). This phase of the reaction is not initially available to all molecules in solution and accumulates distinct reaction products. The second phase of the reaction progresses uniformly from one reaction product to the next and seems to involve all reacting species in solution (Figure 4).
Figure 4.

Graph showing the changes in the relative concentration of each glucosylated species as a function of time. Individual species with significant levels of accumulation are indicated directly on the graph.
From a chemical point of view, only the initial O-glucosylation event differs from all subsequent glucosyl transfer steps as the hydroxyl of Tyr194 would be expected to be more easily activated as the acceptor than the 4’-hydroxyl group of glucose. However, when one considers the structure of glycogenin [8], the possibility of two distinct phases for the reaction can be more easily understood. Tyr194 is located approximately 12 Å from the closest active site in this dimeric molecule [8]. Consequently, once the glucosyl chain is 4–6 residues long it is structurally plausible that the chain could be elongated directly in an intramolecular (intrasubunit or intradimer) reaction. However, given the distance between the active site and Tyr194 it is much less clear how the initial glucosylation events occur. One possibility is that the initial glucosylation events occur between dimers in solution and that the initial distribution of reaction products is dictated by the equilibrium of the association between dimers and the influence that growing glucosyl chains have on that equilibrium. From a structural point of view, it is not clear why the reaction products during the early stages of the reaction would accumulate tetra-glucosylated species, but the accumulation of hexa-glucosylated species might be related to the fact that maltodextrins have a strong propensity to form helices with a repeat of six glucose residues [12,13]. Consequently, once six residues are accumulated, the chain is spatially close to where it began during the extension reaction. Further studies in which the distribution of reaction products is correlated with the concentration of enzyme are underway to test this model for glycogenin function.
In conclusion, we have developed a new assay for glycogenin that permits for the first time direct measurements of the intact individual reaction products produced during the enzymatic process of glycogen initiation. Glycogenin molecules with up to 16 glucoses attached were detected using this methodology, although at the longest time point measured the most common form of the enzyme possessed chains of 12 glucose molecules. Quantitation of the rate of reaction produced results similar to those obtained from 14C-glucose incorporation and confirming previous observations with regard to enzymatic efficiency as a function of chain length, thereby validating the quantitative nature of the assay. Surprisingly, the reaction was found to proceed in a non-distributive manner during the initial stages of the reaction, while in the latter stages there were more predictable and uniform product distributions.
References
- 1.Roach PJ, Skurat AV, Harris RA. Regulation of glycogen metabolism. In: Cherrington LSJ, a AD, editors. Handbook of Physiology. 2001. pp. 609–647. [Google Scholar]
- 2.Pitcher J, Smythe C, Cohen P. Glycogenin is the priming glucosyltransferase required for the initiation of glycogen biogenesis in rabbit skeletal muscle. Eur J Biochem. 1988;176:391–395. doi: 10.1111/j.1432-1033.1988.tb14294.x. [DOI] [PubMed] [Google Scholar]
- 3.Lomako J, Lomako WM, Whelan WJ. A self-glucosylating protein is the primer for rabbit muscle glycogen biosynthesis. FASEB J. 1988;2:3097–3103. doi: 10.1096/fasebj.2.15.2973423. [DOI] [PubMed] [Google Scholar]
- 4.Roach PJ, Skurat AV. Self-glucosylating initiator proteins and their role in glycogen biosynthesis. Prog Nucl Acid Res & Mol Biol. 1997;57:289–316. doi: 10.1016/s0079-6603(08)60284-6. [DOI] [PubMed] [Google Scholar]
- 5.Smythe C, Caudwell FB, Ferguson M, Cohen P. Isolation and structural analysis of a peptide containing the novel tyrosyl-glucose linkage in glycogenin. EMBO J. 1988;7:2681–6. doi: 10.1002/j.1460-2075.1988.tb03121.x. [DOI] [PMC free article] [PubMed] [Google Scholar]
- 6.Alonso MD, Lomako J, Lomako WM, Whelan WJ, Preiss J. Tyrosine 194 of glycogenin undergoes autocatalytic glucosylation but is not essential for catalytic function and activity. FEBS Lett. 1994;352:222–6. doi: 10.1016/0014-5793(94)80580-6. [DOI] [PubMed] [Google Scholar]
- 7.Smythe C, Cohen P. The discovery of glycogenin and the priming mechanism for glycogen biogenesis. Eur J Biochem. 1991;200:625–631. doi: 10.1111/j.1432-1033.1991.tb16225.x. [DOI] [PubMed] [Google Scholar]
- 8.Gibbons BJ, Roach PJ, Hurley TD. Crystal structure of the autocatalytic initiator of glycogen biosynthesis, glycogenin. J Mol Biol. 2002;319:463–477. doi: 10.1016/S0022-2836(02)00305-4. [DOI] [PubMed] [Google Scholar]
- 9.Hurley TD, Stout S, Miner E, Zhou J, Roach PJ. Requirements for catalysis in mammalian glycogenin. J Biol Chem. 2005;280:23892–23899. doi: 10.1074/jbc.M502344200. [DOI] [PMC free article] [PubMed] [Google Scholar]
- 10.Cao Y, Mahrenholz AM, DePaoli-Roach AA, Roach PJ. Charaterization of rabbit skeletal muscle glycogenin: Tyrosine 194 is essential for function. J Biol Chem. 1993;268:14687–93. [PubMed] [Google Scholar]
- 11.Lin A, Mu J, Yang J, Roach PJ. Self-glucosylation of glycogenin, initiator of glycogen biosynthesis, involved an inter-subunit reaction. Arch Biochem Biophys. 1999;363:163–70. doi: 10.1006/abbi.1998.1073. [DOI] [PubMed] [Google Scholar]
- 12.Imberty A, Chanzy H, Perez S, Buleon A, Tran V. The double helical nature of the crystalline part of A-starch. J Mol Biol. 1988;201:365–378. doi: 10.1016/0022-2836(88)90144-1. [DOI] [PubMed] [Google Scholar]
- 13.Gessler K, Uson I, Takaha T, Krauss N, Smith SM, Okada S, Sheldrick GM, Saenger W. V-amylose at atomic resolution: X-ray structure of a cycloamylose with 26 glucose residues (cyclomaltohexaicosaose) Proc Natl Acad Sci (USA) 1999;96:4246–4251. doi: 10.1073/pnas.96.8.4246. [DOI] [PMC free article] [PubMed] [Google Scholar]


