Abstract
A PCR strategy is described for global amplification of DNA from a single eukaryotic cell that enables the comprehensive analysis of the whole genome. By comparative genomic hybridization, not only gross DNA copy number variations, such as monosomic X and trisomic 21 in single male cells and cells from Down’s syndrome patients, respectively, but multiple deletions and amplifications characteristic for human tumor cells are reliably retrieved. As a model of heterogeneous cell populations exposed to selective pressure, we have studied single micrometastatic cells isolated from bone marrow of cancer patients. The observed congruent pattern of comparative genomic hybridization data, loss of heterozygosity, and mutations as detected by sequencing attests to the technique’s fidelity and demonstrates its usefulness for assessing clonal evolution of genetic variants in complex populations.
The true extent of genetic variation in cell populations could thus far be only assessed after laborious cloning and propagation of single cells. The common practice to study bulk DNA as a substitute for genomic DNA directly isolated from individual cells fails to detect rare genotypes. Because evolution, however, depends on the preexistence of such genetic variants, it is obvious that single individual genomes—each representing an ensemble of individual selected genes—need to be studied to understand the underlying evolutionary dynamics better. The aim of the present study was to develop a technique by which the genomic DNA of a single cell can be faithfully amplified so that the whole cellular genome can be analyzed in detail. Although multiple protocols for the PCR amplification of DNA from few or even single cells have been published over the past years [including primer-extension preamplification (1), degenerate oligonucleotide-primed PCR (2–5), and Alu-PCR (6)], none of them has convincingly demonstrated the homogenous amplification of the genome of a single diploid cell, although some are quite useful for the analysis of a limited number of predefined genetic loci. As a consequence, one could not screen the genome of a single cell for variation of DNA copy number. The PCR strategy presented here enables a comprehensive analysis of the entire genome on a single cell level§. To demonstrate the complete and unbiased genomic amplification, we used comparative genomic hybridization (CGH) and, on a higher resolution level, detected loss of heterozygosity (LOH) and mutations that confirmed the fidelity of the strategy.
We applied the method to single cells derived from human epithelial tumors, notorious for their genomic instability as a model for the coexistence of numerous different genotypes within one cell population. As to the evolutionary aspect, the progression of an individual malignant tumor from bad to worse has been likened to the evolution of an asexual quasispecies in which, under various selection pressures, the fittest—i.e., most aggressive—clones are selected (7). Aside from the immediate importance for tumor biology and clinical oncology, the described approach should be applicable for population genetics as well as for various other fields.
MATERIALS AND METHODS
Indirect Immunofluorescence.
Aspiration of the bone marrow samples and isolation of mononucleated cells was performed as described (8). Then, cells were washed in PBS and were fixed for 5 min in 0.2% paraformaldehyde. Blocking of unspecific binding with 5% AB-serum as well as incubation with 10 μg/ml mAb A45 B/B3 (Micromet, Martinsried, Germany) in 2% Pepton/PBS, for 10 min each, was performed in the presence of 0.05% saponin (Sigma) to permeabilize the cells. After washing the cells in 2% Pepton/PBS, the antigen–antibody complexes were incubated with B-phycoerythrin-conjugated goat antibody to mouse IgG (The Jackson Laboratory) for detection (10 min).
Isolation of Single Cells.
All single cells were isolated from cell suspensions by micromanipulation. Bone marrow cells were plated at a density of 250,000 cells/0.8 cm2 in a volume of 200 μl on a microscope slide. Single fluorescent cells were aspirated into a glass pipette of ≈30-μm diameter and were transferred to a new slide. After confirming that only a single cell had been transferred, this cell was finally picked in 1 μl pick buffer (50 mM Tris⋅HCl, pH 8.3/75 mM KCl/3 mM MgCl2/137 mM NaCl) into the PCR reaction tube.
DNA Isolation and Restriction Enzyme Digest.
The single cell in 1 μl of pick buffer was added to 2 μl of proteinase K digestion buffer [10 mM Tris⋅acetate, pH 7.5/10 mM Mg⋅acetate/50 mM K⋅acetate (0.2 μl of 10× Pharmacia One-Phor-All-Buffer-Plus)/0.67% Tween 20 (Sigma)/0.67% Igepal (Sigma)/0.67 mg/ml Proteinase K] and was incubated for 10 h at 42°C in a PCR machine with heated lid. Proteinase K was inactivated at 80°C for 10 min. After inactivation of proteinase K, MseI restriction endonuclease digest was performed in 5 μl by adding 0.2 μl of 10× One-Phor-All-Buffer-Plus, 0.5 μl of MseI (10 units; New England Biolabs), and 1.3 μl of H2O for 3 h at 37°C.
Ligation-Mediated PCR.
Annealing of primers was achieved by adding MseLig 21 primer (5′-AGT GGG ATT CCG CAT GCT AGT-3′) and MseLig 12 primer (5′-TAA CTA GCA TGC-3′, 0.5 μl each of 100 μM stock solution, Metabion, Martinsried, Germany), 0.5 μl of One-Phor-All-Buffer, and 1.5 μl of H2O. Annealing was started at temperature of 65°C (also serving to inactivate the restriction enzyme before ligation) and was shifted down to 15°C with a ramp of 1°C/min. At 15°C, 1 μl of ATP (10 mM) and 1 μl T4-DNA-Ligase (5 units; Boehringer Mannheim) were added, and primers and DNA fragments were ligated over night.
For primary amplification, 40 μl consisting of 3 μl of 10× PCR buffer (Boehringer Mannheim, Expand Long Template, buffer 1), 2 μl of dNTPs (10 mM), and 35 μl of H2O were added to the 10 μl reaction volume. The PCR program started before the denaturation step with 68°C for 4 min to remove the MseLig-12 oligonucleotide, followed by the addition of 1 μl (3.5 units) of DNA polymerase mixture of Taq and Pwo polymerase (Boehringer Mannheim, Expand Long Template) and a 3-min incubation for the fill-in-reaction. The Stratagene Robocycler was programmed to 94°C (40 sec), 57°C (30 sec), and 68°C (1 min, 15 sec) for 14 cycles; 94°C (40 sec), 57°C (30 sec), and 68°C (1 min, 45 sec) for 34 cycles; and 94°C (40 sec), 57°C (30 sec), and 68°C (5 min) for the final cycle.
Labeling and CGH.
Labeling was most efficient using ThermoSequenase (United States Biochemical) in combination with a ratio of bio-dUTP/dTTP of 1/7. Reamplification was performed in a final volume of 30 μl by using 0.5 μl of LigMse-21 primer (100 μM), 1 μl of dNTP (10 mM each dATP, dCTP, and dGTP; 8.6 mM dTTP), 1.3 μl of biotin-16-dUTP (1 mM, Boehringer Mannheim), 13 units of ThermoSequenase in 1× ThermoSequenase buffer, and 0.5 μl of the primary PCR. In total, 25 cycles were programmed with the temperatures set to 94°C (1 min), 65°C (30 sec), and 72°C (2 min) for 1 cycle; 94°C (40 sec), 65°C (30 sec), and 72°C (1 min, 30 sec) for 14 cycles; 94°C (40 sec), 65°C (30 sec), and 72°C (2 min) for 9 cycles; and an additional final extension step at 72°C for 5 min. Before using the reamplified and labeled DNA (2 μg), primers were removed by MseI digestion. Nick translation of control DNA, as well as MCF-7 cell line DNA, metaphase preparation, and hybridization were done as published in ref. 3. Images were captured with the Leica DMXA-RF8 microscope (Leica acquisition program qfish) equipped with a Sensys CCD camera (Photometrix, Tucson, AZ). Quantitative evaluation of the ratio of test and control DNA was done according to ref. 9 by using the Leica software package q-cgh. Seven to twelve metaphase spreads fitting the requirements of the program were evaluated in each experiment. In the course of the experiments, we found that the profiles became smoother with no change in results when PCR-amplified and labeled control DNA was used instead of nick-translated DNA. We modified and amplified 0.5 μg of control DNA as described for single cells and labeled it in the reamplification reaction with digoxigenin-UTP (Boehringer Mannheim). The smoother profiles probably reflect that fragment size and blocking efficacy for repetitive sequences are identical under these conditions for the two DNA samples. The same amounts of test and control DNA are now used in our experiments.
Fluorescence in Situ Hybridization (FISH) Analysis.
Two-color interphase FISH with the CEPH-YACs 695h7 and 963d11 probes, mapped to 2p25 and 2q31, respectively, was performed as described in ref. 10.
LOH and Sequence Analysis.
The primary PCR products were diluted 1:5 in H2O. One microliter of this dilution was used for the specific PCR. The primer sequences and PCR conditions of the D16S3019 locus, the D5S346 locus, the APC PCR–restriction fragment length polymorphism, and the exons 2–9 of the TP53 gene can be obtained from the corresponding author on request. Gel conditions for microsatellite analysis were as described in ref. 11, and the gels were developed by incubation with SYBR-Green (Biozym, Oldendorf, Germany) followed by fluorimaging. Analysis of the APC PCR–restriction fragment length polymorphism was performed by digesting 5 μl of the PCR products in a volume of 30 μl with 15U Alw21I (Fermentas, St. Leon-Rot, Germany) for 3 h. The result was visualized in an ethidium bromide stained agarose gel. The amplified TP53 exons were given to a commercial laboratory for sequencing.
RESULTS
PCR Strategy for Single Cell DNA Amplification.
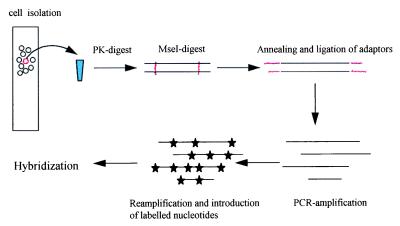
A general scheme of the approach is shown in Fig. 1. The strategy aimed at generating a representation of the genome as complete as possible with fragments of 0.2–2 kilobases suitable for both PCR and CGH. In a pilot study, several restriction enzymes recognizing a four-base motif were compared for their ability to produce fragments of an expected average length of 256 bp (44) based on the premise that the four bases were evenly distributed and that the digest was complete. Five enzymes recognizing different base combinations were tested on high molecular weight DNA: TaqI (TCGA), Csp6I (GTAC), MspI (CCGG), AciI (CCGC, GCGG), and MseI (TTAA). Only MseI, an enzyme without C and G in its recognition site, produced a smear in the range of 100–1,500 bp in length (data not shown) whereas the digest of the other enzymes contained a high proportion of much larger fragments. MseI was therefore used in the protocol.
Figure 1.
Isolation of single fluorescent cells from bone marrow by micromanipulation and preparation of DNA after proteinase K (PK) treatment. After PK inactivation, the double-stranded DNA was digested with MseI, leaving a TA overhang for adapter annealing and subsequent ligation. After primary amplification, 1/100 of the PCR products was reamplified in the presence of bio-UTP, and 2 μg were used for hybridization.
To avoid template loss, all preparatory steps were performed in one tube. For DNA isolation, restriction enzyme digest, primer ligation, and PCR amplification, all buffers and conditions were adjusted for optimal performance to guarantee highest reliability and reproducibility. Generally, high concentrations of proteinase K, MseI, T4 DNA ligase, and thermostabile DNA polymerase mixture gave the best results. As to the choice of primers, HPLC purification and a high concentration in the annealing/ligation reaction (5 μM) were prerequisites for successful performance. Under these conditions, amplification of the digested single cell DNA resulted in a smear of a size similar to a complete digest of 1 μg of high molecular weight DNA (data not shown). In addition, we were able to isolate and amplify DNA from single paraformaldehyde-fixed normal cells.
Retrieval of Defined Karyotype Characteristics.
To test whether the amplification product is a reliable representation of the DNA content of the respective cells, CGH was done according to published protocols (3, 4, 9). First, DNA amplified from a single normal cell was cohybridized with differently labeled normal placenta DNA. The CGH profile showed no chromosomal gains or losses and was comparable to a normal karyotype (data not shown). Six additional control experiments with single normal cells confirmed the reproducibility of the technique: In all cases, no deviations from the central line in the CGH profiles were observed on any autosome, and, in fact, the sex of donor was verified in each case. The paraformaldehyde fixation had no effect on the outcome of the experiment (data not shown).
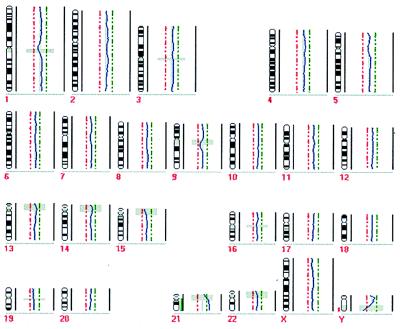
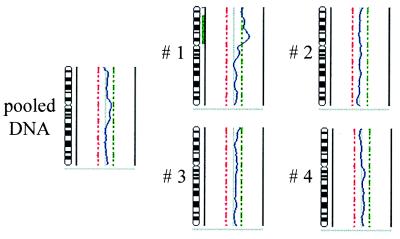
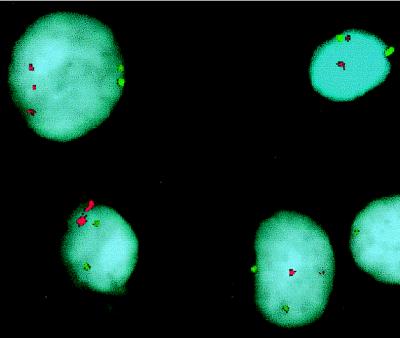
Several experiments then were performed to determine whether known chromosomal changes could be detected by the single cell analysis: First, the DNA of a single leukocyte from a blood sample of a patient with Down’s syndrome was isolated and amplified. The CGH profile showed a gain of chromosome 21 as the sole detectable abnormality (Fig. 2). Second, detection of more complex numerical alterations was verified by comparing the ratio profiles of single cells from the MCF-7 breast cancer cell line and of 1 μg of unamplified DNA isolated directly from MCF-7 cells (Table 1). All genomic aberrations of the pooled MCF-7 DNA also were seen in all single cells. However, all single cells had additional aberrations, and each single cell had a unique pattern of gains and losses. To verify the heterogeneity of the population, we performed interphase FISH for chromosome 2. In fact, the extra gain on chromosome 2p (Fig. 3) detected in single cell 1 by CGH (Table 1) was not caused by a PCR artifact but also was seen by two-color interphase FISH performed with the CEPH-YACs 695h7 and 963d11, mapped to 2p25 and 2q31, respectively. As summarized in Table 2, 16% of all MCF-7 cells evaluated showed three signals for 2p but only two for 2q (Fig. 4). A numerical abnormality present in only 16% of cells in a population does not change a CGH profile made of pooled DNA (9); however, it may become clearly visible if CGH is performed with a single cell from this minor subclone.
Figure 2.
CGH profile of a single peripheral blood leukocyte of a male patient with Down’s syndrome. To be considered significant, deviations from the central line had to cross the green (chromosomal gain) or red (chromosomal loss) punctate line. The gray shaded horizontal bars indicate regions excluded from analysis because of the prevalence of heterochromatic DNA. The chromosome 21 (except of the blocked heterochromatic region) was found to be amplified entirely whereas all other chromosomes showed normal profiles.
Table 1.
CGH of pooled DNA from MCF-7 breast cancer cell line and DNA from four single MCF-7 cells (cells 1–4)
| Chromosomal gains | Chromosomal losses | ||||||||||||||||||||||
|---|---|---|---|---|---|---|---|---|---|---|---|---|---|---|---|---|---|---|---|---|---|---|---|
| Pooled DNA | 3q, | 8q, | 11p, | 11q, | 15, | 19q, | 20q | 3p, | 8p, | 14, | 17p, | 18q, | 22q | ||||||||||
| 1 | 2p, | 3q, | 8q, | 11p, | 11q, | 15, | 19q, | 20q | 3p, | 8p, | 14, | 17p, | 18q, | 22q | |||||||||
| 2 | 3q, | 5p, | 8q, | 11p, | 11q, | 13, | 15, | 19q, | 20q | 3p, | 8p, | 14, | 17p, | 18, | 19p, | 22q | |||||||
| 3 | 3q, | 5p, | 8q, | 11p, | 11q, | 13, | 15, | 19q, | 20 | 3p, | 6, | 8p | 12q, | 14, | 17p, | 18q, | 19p, | 21q, | 22q | ||||
| 4 | 3q, | 4p, | 4q, | 8q, | 11p, | 11q, | 12p, | 13, | 15, | 19q, | 20 | 3p, | 6, | 8p, | 14, | 17p, | 18q, | 19p, | 21q, | 22q | |||
Figure 3.
Comparison of the CGH profiles of a “conventional” CGH experiment using 1 μg of nick-translated DNA prepared from the MCF-7 cell line and from four single cells of the same cell line after PCR amplification. Of all profiles, the results of chromosome 2 are shown. The green bar on the right side of the chromosome 2 symbol of single cell 1 indicates the partial chromosomal gain only detected in this cell but not in any other single cell or the pooled DNA of the cell line.
Table 2.
Interphase cytogenetics on cells from the breast cancer cell line MCF-7 and leukocytes (PBL)
| 1 × 2p | 1 × 2p | 2 × 2p | 2 × 2p | 2 × 2p | 3 × 2p | 3 × 2p | 4 × 2p | 4 × 2p | |
|---|---|---|---|---|---|---|---|---|---|
| 1 × 2q | 2 × 2q | 1 × 2q | 2 × 2q | 3 × 2q | 2 × 2q | 3 × 2q | 2 × 2q | 3 × 2q | |
| MCF-7 | 6 | 0 | 2 | 70 | 0 | 16 | 3 | 2 | 1 |
| PBL | 1 | 3 | 4 | 89 | 1 | 1 | 1 | 0 | 0 |
One hundred nuclei were evaluated in each case.
Figure 4.
Two-color interphase-FISH on MCF-7 cells with YAC clones specific for 2p25 (red) and 2q31 (green). In one cell (upper left corner), three signals can be identified for the 2p region, but only two can be identified for 2q. The other cells show two signals for both the 2p and the 2q probes.
Application to Rare Cells.
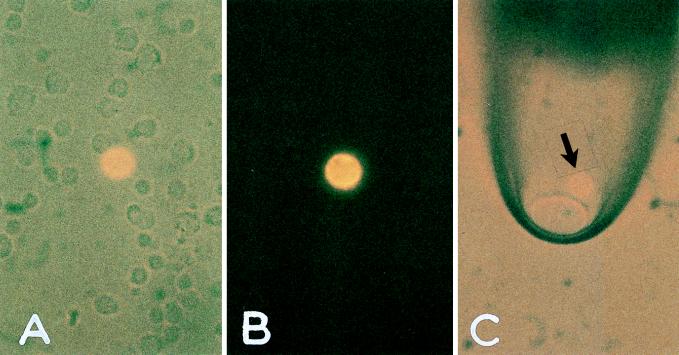
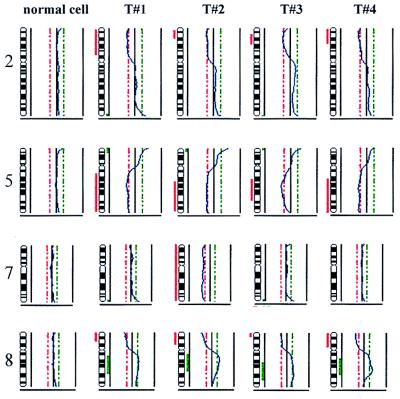
To demonstrate that our protocols are applicable to rare cells in clinical samples, individual tumor cells present in bone marrow of a cancer patient were analyzed. These extremely rare carcinoma cells in bone marrow were identified in marrow aspirates by indirect immunofluorescence with the monoclonal anti-cytokeratin antibody A45 B/B3. Epitopes recognized by this antibody have been mapped to cytokeratins 8 and 18 and heterodimers of 8/18 and 8/19 (12). Fig. 5 depicts the process of tumor cell detection and isolation: A single immunofluorescence-labeled cell detected among unstained bone marrow cells is picked by micromanipulation and is transferred to a new slide for visual control that no additional cell is inadvertently aspirated. This procedure was applied to four individual cytokeratin-positive tumor cells and four unstained control cells isolated from bone marrow of a patient with a cancer of unknown primary lesion (CUP syndrome), who initially presented with liver metastasis. The findings of the CGH analysis of the four tumor cells, summarized in Table 3 and in Fig. 6, showed a remarkably congruent pattern of genomic changes (Table 3). Particularly, the distinct loss of the so called consensus deletion regions—3p, 5q, 10q, 13q, and 17p—suggested that the cytokeratin-positive cells originated from a small cell lung cancer (13). Later, computed tomography of a characteristic pulmonary lesion and histopathological examination of a metastasis led to the diagnosis of a small to intermediate cell—most likely epithelial—tumor, thus corroborating our CGH-based suspicion. Because the primary tumor could never be biopsied successfully, we had only access to a metastatic lesion for comparison with the single cells. Most of the CGH results found in the biopsy lesion and the single cells were identical (Table 3). The failure to observe all aberrations in both samples might be attributable to the tumor cell heterogeneity and the contamination with stromal cells in the biopsy.
Figure 5.
Isolation of a single disseminated tumor cell from bone marrow of a breast cancer patient. (A) Nucleated cell suspension containing one immunofluorescent cytokeratin-positive cell. (B) Exclusion of visible light, demonstrating the bright cytoplasmic staining and the negative background of surrounding cells. The fluorescent cell then was aspirated by a glass capillary (C) and was transferred to a fresh slide. No cells other than the fluorescent cell were transferred because the whole visual field did not contain any other cell. From there, the cell was taken to the amplification tube.
Table 3.
CGH analysis of four individual disseminated tumor cells isolated from bone marrow and of pooled DNA from a solid metastasis of a patient with CUP syndrome
| Tumor cell | Gains | Losses | |||||||||||||
|---|---|---|---|---|---|---|---|---|---|---|---|---|---|---|---|
| 1 | 8q | 2p, | 3p, | 5q, | 8p, | 10, | 13q, | 15q, | 16q, | 17p, | 19p, | 22, | Y | ||
| 2 | 8q | 2p, | 3p, | 5q, | 7, | 8p, | 10, | 13q, | 15q, | 16q, | 17p, | 19p, | 22, | Y | |
| 3 | 8q | 2p, | 3p, | 5q, | 8p, | 10, | 13q, | 15q, | 16q, | 17p, | 19p, | 22, | Y | ||
| 4 | 8q | 2p, | 3p, | 5q, | 8p, | 10, | 13q, | 15q, | 16q, | 17p, | 19p, | 22, | Y | ||
| Metastasis | 8q | 10, | 15q, | 16q, | 17p, | 19p, | 22, | Y | |||||||
Figure 6.
CGH profile of four single tumor cells (T#1–T#4) and one normal cell of a patient with CUP syndrome. Chromosomes 2, 5, 7, and 8 were chosen for comparison of identical and divergent findings. The losses on chromosomes 2, 5, and 8p were common for all tumor cells as was the gain of 8q whereas the loss of chromosome 7 was only seen for T#2. As in the other profiles, chromosomal losses are marked by red vertical bars at the left side of the chromosome symbol, and gains are marked by a green bar on the right side.
LOH and Sequence Analysis.
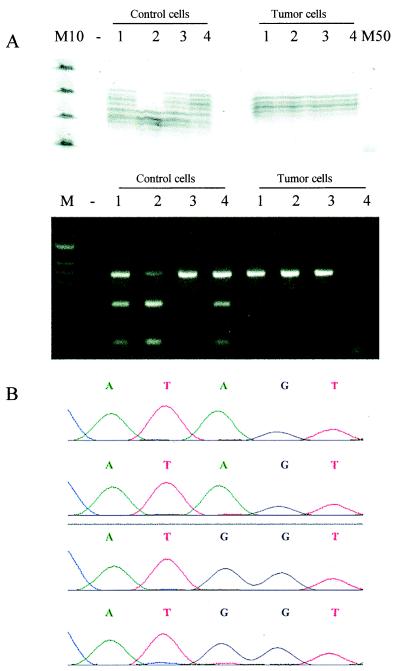
To determine whether the PCR amplification product allows the identification of LOH or mutations, we examined the amplified DNA of all four tumor cells and the four unstained bone marrow cells for the presence of such alterations. For LOH analysis of the APC tumor suppressor gene on 5q21, we used the dinucleotide repeat polymorphism D5S346 located 40 kilobases downstream of the gene and a polymorphic Alw21I site located within exon 15 (14). The D16S3095 marker tightly linked to the CDH1 gene (E-cadherin) (15) on 16q22 was applied to assess LOH of CDH1. Because the CGH results of the respective chromosomes already suggested a loss of chromosomal material from 5q and 16q, amplification of two alleles from each control cell and one from each tumor cell was calculated to result in 12 fragments (4 × 2 for the four normal cells and 4 × 1 for the four tumor cells) for each of the three markers, adding up to 36 independently amplified fragments. As it is depicted for APC in Fig. 7A, both alleles could be amplified from three of the four control cells for each of the two markers analyzed. Although the losses found in control cells 2 and 3 were not seen with the second marker, all tumor cells showed LOH in both experiments. Similar results were obtained for CDH1: All control cells were informative and showed two alleles whereas all four tumor cells had lost one allele (data not shown). Taken together, 33 of the 36 expected fragments were amplified and detected. Therefore, a presumed loss needs to be controlled by additional markers (Fig. 7A). Because the detection of LOH in a single cell requires that the two allelic DNA strands are cut, are ligated to the adapter, and are amplified in a nearly identical fashion, incompleteness in any of these reactions can easily explain the failure to amplify all expected fragments. However, considering the size of the human genome, we think that these data demonstrate a respectable reliability of the method.
Figure 7.
(A) LOH analysis using the dinucleotide repeat polymorphism at D5S346 locus linked to the APC gene (Upper) and PCR–restriction fragment length polymorphism of a Alw21I site within exon 15 of the APC gene (Lower). In the first experiment, all four tumor cells demonstrated loss of one allele whereas the single control cells contained two alleles, except for control cell 2. In the APC PCR–restriction fragment length polymorphism experiment, all but one control cell (3) had two alleles whereas the tumor cells only contained the uncut fragment. The fragment of tumor cell 4 was not amplified. −, negative control; M10, 10-bp ladder; M50, 50-bp ladder; M, marker for agarose gel electrophoresis. (B) Sequence of the mutation found in codon 215. The single control cells contained the wild-type sequence with an A at nucleotide 643 (upper two sequences) whereas the tumor cells were mutated at this position showing an A → G mutation (lower two sequences). The sequences of four of the eight cells are shown.
As to the problem of detecting mutations, we were aware that DNA polymerase errors could be particularly misleading when introduced during the early cycles of the PCR. We therefore used a mixture of Taq polymerase with a proofreading enzyme, Pwo polymerase. Because the CGH profiles of all four tumor cells showed a loss of 17p, the obvious question concerned whether the remaining allele of the TP53 tumor suppressor gene, located on 17p, had been inactivated by a mutation. Mutations in TP53, the most commonly mutated tumor suppressor gene in human cancer, occur in ≈50% of lung carcinomas (16). Because the vast majority of mutations are localized within the core domain, we amplified exon 4–9 for sequencing. The map of MseI cleavage sites in the TP53 gene region predicted four exon-containing fragments: one of 1,374 bp with exons 2, 3, and 4; another of 1,032 bp with exons 5 and 6; a third of a 722-bp fragment with exon 7; and a fourth of 558 bp with exons 8 and 9. Successful amplification of all exons proved that the primary PCR conditions are sufficiently robust to yield products at least as large as 1,374 bp, despite the presence of much smaller fragments. On sequencing, all four tumor cells showed an A → G mutation in codon 215 leading to a serine to glycine exchange, a mutation that already has been described in several human cancers (17). It is noteworthy that the four normal bone marrow cells contained the wild-type sequence at codon 215 (Fig. 7B), virtually excluding the possibility that a DNA polymerase error accounted for the A → G mutation. No other deviation from the wild-type sequence was found in the exons of tumor and control cell DNA, indicating that DNA polymerase induced mutations are rather rare under the applied conditions.
DISCUSSION
Single Cell DNA Amplification and CGH.
The method presented here enables the homogenous and highly reproducible amplification of the genome of a single cell. Because all single cell experiments were repeated at least once and most results were controlled independently, (e.g., cytogenetics and clinical presentation in the case of the Down’s syndrome experiment, conventional CGH with pooled DNA, and FISH analysis in the MCF-7 experiment), the robustness and reproducibility of the method is firmly established. Numerical alterations from diploidy in single cells either because of sex (e.g., male genome) or other causes (e.g., trisomy 21 in Down’s syndrome) were easily detected by using this approach but not with previously published methods for whole genome amplification (1–6).
An explanation as to why our method allowed the reproducible application of CGH to individual diploid cells might be seen in the efficient generation of a representation by completely digesting the entire genome with MseI and the avoidance of DNA loss because of precipitation steps. Basically, the genome is transferred to a high complexity representation (18) with a fragment size of <2 kilobases. By using a single primer, the sequence complexities of multiple primer binding sites that need to be met by the degenerate oligonucleotides techniques, as degenerate oligonucleotide-primed PCR and primer-extension preamplification, are avoided. For optimal efficiency, these numerous different binding sites would in essence require equally numerous different specific PCR conditions, a requirement that cannot be achieved in the same reaction. In contrast, our approach has the decisive advantage that amplification conditions nearly optimal for all adapter-ligated sequences can be selected.
Additional chromosomal gains and losses were found in single cells in comparison to DNA pooled of a cell line or solid metastasis. This higher sensitivity of CGH with DNA from a clonal, nonheterogeneous source is not surprising because it is known that the enormous tumor cell heterogeneity or contamination with DNA from normal stromal or infiltrating cells in the primary tumor or the metastasis obviates the detection of subpopulations using pooled DNA. Therefore, the MCF-7 experiment (Tables 1 and 2 and Figs. 3 and 4) with the extra gains detected in the single cells [e.g., chromosome 2p found in the single cell 1 (Table 1 and Figs. 3 and 4)] merely reflects the heterogeneity within the cell line.
Analysis of Single Micrometastatic Cancer Cells.
The detection of cancer cells in mesenchymal organs, such as bone marrow, opens new ways to analyze the genetics of systemic dissemination from small primary tumors long before clinical metastasis becomes manifest. The immunocytochemical assay used for detection of disseminated tumor cells rests on the expression of cytokeratins restricted to cells derived from epithelial tumors but absent from autochthonous mesenchymal bone marrow cells. Because these disseminated tumor cells are generally very rare, i.e., 10−5 to 10−6 tumor cells per nucleated bone marrow cell (19), a comprehensive analysis of their entire genome requires that they be isolated. The ectopic localization of epithelial cells in bone marrow by itself does not prove their malignant nature; however, the CGH and sequence findings of the four isolated cytokeratin-positive cells constitute the evidence that these cells are indeed tumor cells. Their clinical relevance is based on prospective studies showing that patients with localized primary tumors but occult dissemination to bone marrow have an increased risk of relapse (8, 20, 21). With more genomic profiles of single disseminated tumor cells now becoming available, one should be able to identify genotypes that may be characteristic for dissemination and ectopic survival. Therefore, an analysis of tumor cells at or close to the time when a selection pressure is exerted should answer the question of whether and which genomic changes are being selected during tumor evolution. This might be of considerable importance because the genetic instability of solid tumors (22, 23) or repeated rounds of clonal expansion, mutation, and selection (24, 25) might introduce other genomic aberrations occurring in a more advanced solid metastasis that may be unrelated to the previous selection pressure. Therefore, longitudinal studies of tumor cells in individual patients will delineate the clonal evolution (26, 27) toward metastasis. In the case presented, the cells isolated from bone marrow of the patient with CUP syndrome clearly showed clonal alterations because loss of chromosome 7 was observed only in one of the four cells. On the other hand, all remaining CGH aberrations were shared by the tumor cells, strongly suggesting a common progenitor cell of the isolated cells.
It is obvious that, with this method, rare individual genetic variants may be analyzed in other fields, such as population genetics, immunology, and prenatal medicine. Although the fidelity at a higher resolution level needs to be investigated further, the demonstrated analyses of three genetic loci, TP53, APC, and CDH1, are quite promising because mutations and polymorphisms were accurately identified. Taking together the quantitatively accurate CGH data on metaphase chromosomes and the fidelity on the specific sequence level, one immediately sees that this technique can attain a higher level of resolution by applying matrix/array CGH (28, 29). Because the single cell analyses were able to detect aberrations in subsets of tumor cells—which makes previous CGH studies suspect of missing important genetic changes—the combination of the two high resolution techniques might enable the detection of genes important for tumor progression. Experiments in this direction are under way.
Acknowledgments
We are indebted to Simone Baier for excellent technical assistance and J. Johnson for support. We gratefully acknowledge G. Schlimok and B. Weber for providing bone marrow aspirates of their cancer patients, H. v. Voss for a blood sample of the patient with Down’s syndrome, and G. B. Baretton for the histopathology and the microdissection of the tumor sample. We thank Micromet GmbH, Martinsried, Germany, for a gift of mAB A45-B/B3. This work was supported by the Mildred Scheel Stiftung and the Deutsche Forschungsgemeinschaft Klinische Fouschergruppe and a grant cofunded by Micromet GmbH and the German Federal Ministry for Education, Science, Research and Technology.
ABBREVIATIONS
- CGH
comparative genomic hybridization
- LOH
loss of heterozygosity
- FISH
fluorescence in situ hybridization
Footnotes
The procedure has been termed “SCOMP,” for single cell comparative genomic hybridization; the trademark and patent application are pending (Micromet, 82152 Martinsried, Germany).
References
- 1.Zhang L, Cui X, Schmitt K, Hubert R, Navidi W, Arnheim N. Proc Natl Acad Sci USA. 1992;89:5847–5851. doi: 10.1073/pnas.89.13.5847. [DOI] [PMC free article] [PubMed] [Google Scholar]
- 2.Telenius H, Carter N P, Bebb C E, Nordenskjold M, Ponder B A, Tunnacliffe A. Genomics. 1992;13:718–725. doi: 10.1016/0888-7543(92)90147-k. [DOI] [PubMed] [Google Scholar]
- 3.Speicher M R, du Manoir S, Schrock E, Holtgreve Grez H, Schoell B, Lengauer C, Cremer T, Ried T. Hum Mol Genet. 1993;2:1907–1914. doi: 10.1093/hmg/2.11.1907. [DOI] [PubMed] [Google Scholar]
- 4.Speicher M R, Jauch A, Walt H, du Manoir S, Ried T, Jochum W, Sulser T, Cremer T. Am J Pathol. 1995;146:1332–1340. [PMC free article] [PubMed] [Google Scholar]
- 5.Kuukasjarvi T, Tanner M, Pennanen S, Karhu R, Visakorpi T, Isola J. Genes Chromosomes Cancer. 1997;18:94–101. [PubMed] [Google Scholar]
- 6.Nelson D L, Ledbetter S A, Corbo L, Victoria M F, Ramirez Solis R, Webster T D, Ledbetter D H, Caskey C T. Proc Natl Acad Sci USA. 1989;86:6686–6690. doi: 10.1073/pnas.86.17.6686. [DOI] [PMC free article] [PubMed] [Google Scholar]
- 7.Klein G. Adv Cancer Res. 1998;72:1–23. doi: 10.1016/s0065-230x(08)60698-3. [DOI] [PubMed] [Google Scholar]
- 8.Pantel K, Izbicki J, Passlick B, Angstwurm M, Häussinger K, Thetter O, Riethmüller G. Lancet. 1996;347:649–653. doi: 10.1016/s0140-6736(96)91203-9. [DOI] [PubMed] [Google Scholar]
- 9.du Manoir S, Schrock E, Bentz M, Speicher M R, Joos S, Ried T, Lichter P, Cremer T. Cytometry. 1995;19:27–41. doi: 10.1002/cyto.990190105. [DOI] [PubMed] [Google Scholar]
- 10.Lengauer C, Riethman H C, Speicher M R, Taniwaki M, Konecki D, Green E D, Becher R, Olson M V, Cremer T. Cancer Res. 1992;52:2590–2596. [PubMed] [Google Scholar]
- 11.Litt M, Hauge X, Sharma V. BioTechniques. 1993;15:280–284. [PubMed] [Google Scholar]
- 12.Stigbrand T, Andres C, Bellanger L, Bishr Omary M, Bodenmuller H, Bonfrer H, Brundell J, Einarsson R, Erlandsson A, Johansson A, et al. Tumour Biol. 1998;19:132–152. doi: 10.1159/000029984. [DOI] [PubMed] [Google Scholar]
- 13.Ried T, Petersen I, Holtgreve Grez H, Speicher M R, Schrock E, du Manoir S, Cremer T. Cancer Res. 1994;54:1801–1806. [PubMed] [Google Scholar]
- 14.Groden J, Thliveris A, Samowitz W, Carlson M, Gelbert L, Albertsen H, Joslyn G, Stevens J, Spirio L, Robertson M, et al. Cell. 1991;66:589–600. doi: 10.1016/0092-8674(81)90021-0. [DOI] [PubMed] [Google Scholar]
- 15.Guilford P, Hopkins J, Harraway J, McLeod M, McLeod N, Harawira P, Taite H, Scoular R, Miller A, Reeve A E. Nature (London) 1998;392:402–405. doi: 10.1038/32918. [DOI] [PubMed] [Google Scholar]
- 16.Greenblatt M S, Bennett W P, Hollstein M, Harris C C. Cancer Res. 1994;54:4855–4878. [PubMed] [Google Scholar]
- 17.Hainaut P, Hernandez T, Robinson A, Rodriguez Tome P, Flores T, Hollstein M, Harris C C, Montesano R. Nucleic Acids Res. 1998;26:205–213. doi: 10.1093/nar/26.1.205. [DOI] [PMC free article] [PubMed] [Google Scholar]
- 18.Lucito R, Nakimura M, West J A, Han Y, Chin K, Jensen K, McCombie R, Gray J W, Wigler M. Proc Natl Acad Sci USA. 1998;95:4487–4492. doi: 10.1073/pnas.95.8.4487. [DOI] [PMC free article] [PubMed] [Google Scholar]
- 19.Pantel K, Braun S, Passlick B, Schlimok G. Prog Histochem Cytochem. 1996;30:1–62. doi: 10.1016/s0079-6336(96)80013-1. [DOI] [PubMed] [Google Scholar]
- 20.Cote R J, Rosen P P, Lesser M L, Old L J, Osborne M P. J Clin Oncol. 1991;9:1749–1756. doi: 10.1200/JCO.1991.9.10.1749. [DOI] [PubMed] [Google Scholar]
- 21.Lindemann F, Schlimok G, Dirschedl P, Witte J, Riethmüller G. Lancet. 1992;340:685–689. doi: 10.1016/0140-6736(92)92230-d. [DOI] [PubMed] [Google Scholar]
- 22.Loeb L A. Cancer Res. 1991;51:3075–3079. [PubMed] [Google Scholar]
- 23.Lengauer C, Kinzler K W, Vogelstein B. Nature (London) 1998;396:643–648. doi: 10.1038/25292. [DOI] [PubMed] [Google Scholar]
- 24.Tomlinson I P, Novelli M R, Bodmer W F. Proc Natl Acad Sci USA. 1996;93:14800–14803. doi: 10.1073/pnas.93.25.14800. [DOI] [PMC free article] [PubMed] [Google Scholar]
- 25.Tomlinson I, Bodmer W. Nat Med. 1999;5:11–12. doi: 10.1038/4687. [DOI] [PubMed] [Google Scholar]
- 26.Fidler I J, Hart I R. Science. 1982;217:998–1003. doi: 10.1126/science.7112116. [DOI] [PubMed] [Google Scholar]
- 27.Zetter B R. N Engl J Med. 1990;322:605–612. doi: 10.1056/NEJM199003013220907. [DOI] [PubMed] [Google Scholar]
- 28.Solinas Toldo S, Lampel S, Stilgenbauer S, Nickolenko J, Benner A, Dohner H, Cremer T, Lichter P. Genes Chromosomes Cancer. 1997;20:399–407. [PubMed] [Google Scholar]
- 29.Pinkel D, Segraves R, Sudar D, Clark S, Poole I, Kowbel D, Collins C, Kuo W-L, Chen C, Zhai Y, et al. Nat Genet. 1998;20:207–211. doi: 10.1038/2524. [DOI] [PubMed] [Google Scholar]


