Abstract
UV resonance Raman spectroscopy was used to detect and estimate the frequency of the unfavored imino tautomer of the transition mutagen 5-hydroxy-2′-deoxycytidine (HO5dCyt) in its anionic form. In DNA, this 2′-deoxycytidine analog arises from the oxidation of 2′-deoxycytidine and induces C → T transitions with 102 greater frequency than such spontaneous transitions. An imino tautomer marker carbonyl band (≈1650 cm−1) is enhanced at ≈65°C against an otherwise stable spectrum of bands associated with the favored amino tautomer. This band is similarly present in the UV resonance Raman spectra of the imino cytidine analogs N3-methylcytidine at high pH and N4-methoxy-2′-deoxycytidine at pH 7 and displays features attributable to the imino form of C residues and their derivatives. The fact that the imino tautomer of HO5dCyt occurs at a frequency consistent with its high mutagenic enhancement lends strong support to the hypothesis that unfavored base tautomers play important roles in the mispair intermediates of replication leading to substitution mutations.
The tautomerism of nucleic acid bases is of great interest because of the putative role of their unfavored tautomers in substitution mutagenesis (1, 2). Thus, whereas the dominant amino and keto forms of the base residues enable correct gene replication by complementary base pairing between A and T and between G and C, the minor tautomeric imino and enol species allow for mispairing of A with C, G with T, and also are involved in mispairing of A with A, G with G, A with G, and G with A, resulting in transition and transversion mutations, respectively.
Experimental and theoretical investigations involving pK measurement of various tautomer analogs (3), relaxation methods (4), and quantum mechanical calculations (5) have afforded estimates of the frequency of these rare tautomers. However, because of the very low level of minor tautomeric species in solution (≈10−4–10−5; refs. 6–8), it has not been possible to observe them directly by spectroscopy. Here, we report evidence obtained by UV resonance Raman spectroscopy (UVRR) for the minor tautomer of a highly mutagenic analog of the 2′-deoxycytidine (dCyt) residue, 5-hydroxy-2′-deoxycytidine (HO5dCyt).
Earlier, it was found that C → T mutations resulting from transition metal-mediated damage to DNA by reactive oxygen species most frequently occur opposite C residues (9). The major mutagenic modification of these C residues is HO5dCyt, an oxidation product. HO5dCTP is incorporated efficiently into DNA by a DNA polymerase in vitro (10). On transfection of this DNA into Escherichia coli, it causes C → T transitions at a frequency of ≈2.5%, very much higher than that observed for any previously identified base analog-induced DNA lesion. A possible mechanism for these transitions involves a much greater frequency of the imino tautomer of HO5dCyt, which would increase the tendency to pair with A (2).
In fact, our results show that the frequency of the minor tautomer of the anionic form of HO5dCyt, which has substantial presence at physiological pH, is at least 100-fold higher than that of dCyt. Then, at pH 10.5, its UVRR temperature-difference spectrum contains a distinguishing marker band at 1658 cm−1 that is diagnostic of the carbonyl bond of the imino tautomer. The frequency of that tautomer near physiological temperature and pH is estimated to be in the range of ≈0.3–0.7%, which is reasonably close to the estimate of mutation frequency that it induces (10). This finding indicates that mutation as a consequence of a minor tautomer of HO5dCyt is a plausible mechanism for the C → T substitution mutation induced by reactive oxygen species and provides experimental evidence for a substitution mutation mechanism involving a minor tautomer intermediate base mispair.
MATERIALS AND METHODS
Materials.
HO5dCyt, N4-methoxy-2′-deoxycytidine (MeO4dCyt), and their heavy isotope analogs were synthesized (11) and purified by HPLC. dCyt and N3-methylcytidine methosulfate (Me3Cyt) were of the highest grade (Sigma) and were used without further purification.
Sample Preparation.
All isotopic analogs of HO5dCyt were dissolved in 0.02 M NaOH/NaHCO3 buffer, pH 10.5 (β = −0.009 ΔpH/Δ°C), well above its pK2 of 7.4 to avoid temperature effects on the ratio of its ionic forms. Me3Cyt was dissolved in the same buffer at pH 11. MeO4dCyt and dCyt were measured in 0.02 M NaH2PO4/Na2HPO4 buffer (pH 7). All samples were titrated at 25°C by using a pH electrode (pHM 26, Radiometer America) and then passed through a 0.45-μm Sterile Acrodisc filter (Gelman) before measuring UVRR spectra. Samples in 2H2O (D2O) were prepared after removing H2O by lyophilization.
UV Spectroscopy.
Absorption spectra were measured with a computer-driven AVIV 14DS spectrophotometer (Aviv Associates, Lakewood, NJ), equipped with a thermoelectrically controlled cell holder.
UVRR Spectroscopy.
Spectra were measured essentially as described (12). An intracavity double-argon ion laser (Innova 300 FReD, Coherent Radiation, Palo Alto, CA) was used to generate the 229-, 244-, and 257-nm continuous wave laser lines. UV radiation at 0.2–0.3 mW was incident on the sample and 135° backscattering geometry was used. Samples in 1-cm quartz cuvettes, magnetically stirred to prevent accumulation of photodegradation products in the beam, were placed in an aluminum-block cell holder, with sample temperature maintained by a circulating bath and monitored by a copper–constantan thermocouple in the block. Clean, dry N2 was delivered into the cuvette through a thin stainless steel tube to provide a protective atmosphere above the sample. Spectra were calibrated against neat solutions of ethanol and acetone, for which the Raman band frequencies are known. The accuracy of the calibrated spectra was approximately ±1 cm−1. Temperature-difference spectra were generated by subtracting the low-temperature spectrum from the high-temperature spectrum. Samples were 5 mM. The 981-cm−1 peak of 0.3 M Na2SO4 served as the internal standard at 244- and 229-nm excitation wavelengths, whereas the strong 1047-cm−1 peak of 0.03 M NaNO3 was used at the 257-nm excitation wavelength (because of the expanded wavenumber scale relative to the window for collecting the spectra). To confirm band assignments, measurements were made on nucleosides without and with heavy-atom substitutions, in D2O as well as in H2O.
RESULTS
pH Titration of HO5dCyt Monitored by UV Spectroscopy.
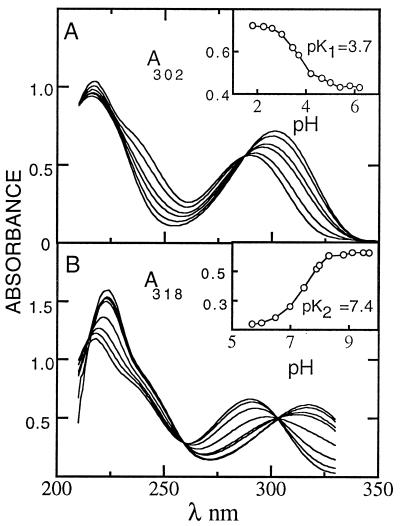
Fig. 1 shows UV absorption spectra of HO5dCyt between pH 2.25 and pH 11 at pH increments of ≈0.5. Starting at low pH, two discrete deprotonation events are apparent (see Fig. 2 and its Insets). The first involves deprotonation at N3 (pK1 = 3.7). Although this event corresponds to that in dCyt (pK = 4.3), the presence of the —OH group at C5 reduces pK1 by 0.6. This reduction is like the one observed for other pyrimidines with electron-withdrawing substituents on C5 (13). The second deprotonation involves conversion of the 5-OH group to its anion, with pK2 = 7.4. This pK is unique to HO5dCyt.
Figure 1.
UV spectrophotometric pH titration of HO5dCyt in buffers of 0.1 M glycine⋅HCl (pH 2.2–3.6), 0.1 M acetate (pH 3.6–5.8), 0.1 M phosphate (pH 6.0–8.0), and glycine/NaOH (pH 8.5–11.0). UV absorption spectra with titration curve Insets between pH 2.2 and 5.8 (A) and between pH 6.0 and 11.0 (B).
Figure 2.
Ionic and tautomeric forms of HO5dCyt as a function of pH.
In the physiological pH range of 7.5–8 (10), the mutagenically relevant species of HO5dCyt is most likely the anionic form (see Discussion). In fact, quantum chemical calculations (M. Karelson, A. Katritsky, and J.R.F., unpublished work) show that the imino tautomer is much more favored for the anion. Therefore, efforts to identify an imino tautomer were focused on its completely anionic form, present at pH 10.5 in a buffer not perturbed at elevated temperature.
UVRR Spectra of HO5dCyt
The Dominant Tautomer of HO5dCyt at High pH Is the Amino Form.
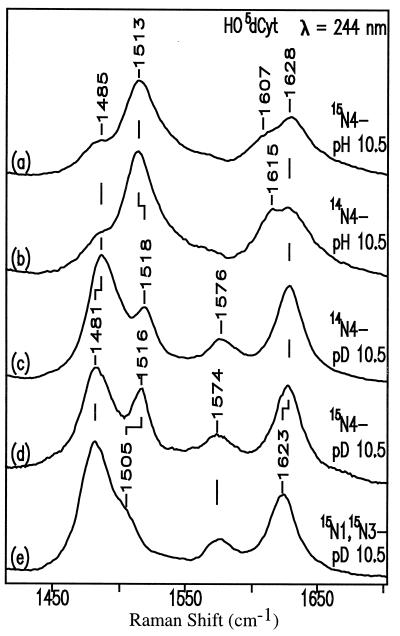
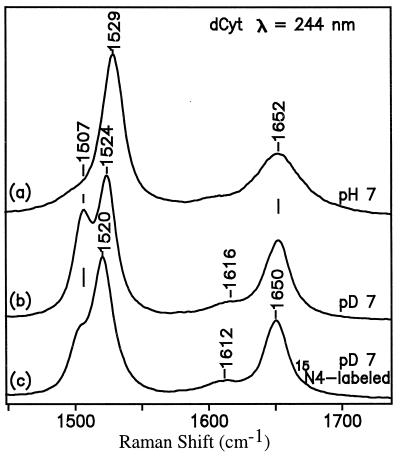
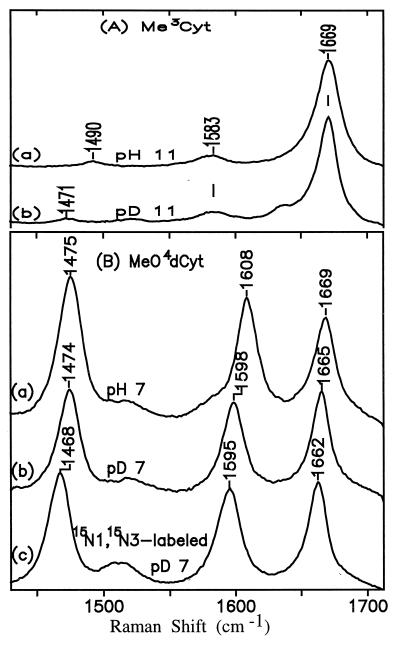
The amino tautomer is indicated by the almost complete absence of a wavenumber shift of the carbonyl band at 1628 cm−1 on going from H2O to D2O (Fig. 3, spectra b and c). This behavior resembles that of dCyt on going from pH 7 to pD 7 (Fig. 4, spectra a and b). If the major form were the imino tautomer, N3 would be protonated, and the wavenumber shift on going from H2O to D2O would be significant, as it is for uridine (+11 cm−1; ref. 14) and MeO4dCyt (−4 cm−1; see Fig. 8B, spectra a and b). On the other hand, the coupling between carbonyl and the exocyclic amino group of anionic HO5dCyt is less than the coupling in neutral dCyt; in D2O, when 14N4 is replaced by 15N4, the carbonyl band remains at 1628 cm−1 for anionic HO5dCyt (Fig. 3, spectra c and d) but shifts from 1652 cm−1 down to 1650 cm−1 for neutral dCyt (Fig. 4, spectra b and c).
Figure 3.
UVRR spectra (244-nm excitation) of anionic HO5dCyt (14N or 15N) in H2O and D2O.
Figure 4.
UVRR spectra (244-nm excitation) of neutral dCyt (14N or 15N).
Figure 8.
UVRR spectra (257-nm excitation) of neutral Me3Cyt (A) and neutral MeO4dCyt (B).
Band Assignments.
Most of the UVRR bands above 1450 cm−1 for anionic HO5dCyt can be assigned in a consistent way by comparing the bands for the known tautomer analogs dCyt, Me3Cyt, and MeO4dCyt in their variously isotopically labeled, i.e., substituted, counterparts. However, because of the presence at pH 10.5 of the O− adjacent to the C5 ⩵ C6 bond, the spectra of HO5dCyt have some unique features (Table 1).
Table 1.
UVRR bands of dCyt and anionic HO5dCyt
| Nucleoside | Solvent and isotope | Band location, cm−1
|
||
|---|---|---|---|---|
| C2⩵O | C5⩵C6 | N3⩵C4 | ||
| dCyt, pH 7 | H2O | 1652 | 1660 | 1529 |
| D2O | 1652 | 1616 | 1524 | |
| 15N4-labeled, D2O | 1650 | 1612 | 1520 | |
| HO5dCyt, pH 10.5 | H2O | 1628 | 1615 | 1513 |
| D2O | 1628 | 1576 | 1485 | |
| 15N4-labeled, D2O | 1628 | 1574 | 1481 | |
| 15N1-, 15N3-labeled, D2O | 1623 | 1574 | 1481 | |
For example, dCyt shows a single prominent band at 1652 cm−1 (Fig. 4, spectrum a), which is almost insensitive to D2O substitution (Fig. 4, spectrum b) and is assigned to the carbonyl stretching vibration (15). Another low-intensity band in D2O at ≈1616 cm−1 is assigned to a coupled N3⩵C4, C5⩵C6 stretching mode. Its counterpart in H2O is located at ≈1660 cm−1 (shoulder) and is observable only with 200-nm excitation (14). The large D2O downshift (42 cm−1) for this band signifies the strong involvement of the amino substituent in this mode. The band at 1529 cm−1 in H2O is assigned to the N3⩵C4 stretching mode.
In the case of anionic HO5dCyt in H2O, the band pattern generally downshifts ≈20 cm−1 relative to dCyt because of the presence of the negative charge on C5. This downshift results in broad bands centered at 1628 cm−1 and 1513 cm−1 (Fig. 3, spectra b and c). Analysis of spectra of 15N4-labeled HO5dCyt shows that the 1628-cm−1 band is composed of two components (compare the spectra of HO5dCyt and 15N4-HO5dCyt, Fig. 3, spectra a and b), i.e., the 1628-cm−1 band with a shoulder at 1615 cm−1. The 1628-cm−1 component is essentially insensitive to D2O and is assigned to the carbonyl moiety, whereas the 1615-cm−1 band is highly sensitive to isotope-substitution on the exocyclic amino group; the band shifts down to 1607 cm−1 when 14N4 is replaced by 15N4 and down to 1576 cm−1 on going from H2O to D2O. The 1615-cm−1 band is assigned to a coupled N3⩵C4, C5⩵C6 stretch with strong involvement of the amino group.
There is another strong band at 1513 cm−1, which shifts down to 1485 cm−1 in D2O (Fig. 3, spectra b and c). By analogy with dCyt (Fig. 4), this band is assigned to a ring stretching mode of N3⩵C4, with substantial involvement of the amino group on C4.
The introduction of 15N at N1 and N3 of HO5dCyt causes a significantly greater downshift for the shoulder at 1518 cm−1 in the D2O spectrum than for the other bands (Fig. 3, spectrum e). This difference signifies greater involvement of 15N1 and 15N3 in this band, which, however, cannot yet be assigned. Its potential energy distribution can be from N3⩵C4 to N1—C2, similar to that in dCMP (14).
The Minor Tautomer of HO5dCyt Is Signified by the Carbonyl Marker Band of the Imino Tautomer in the Temperature-Difference Spectra.
Although, as noted, there are several spectral similarities between the anionic form of HO5dCyt and neutral dCyt, HO5dCyt is unique in the sensitivity to temperature of both its UV spectra (Fig. 5) and its UVRR spectra (Figs. 6 and 7).
Figure 5.
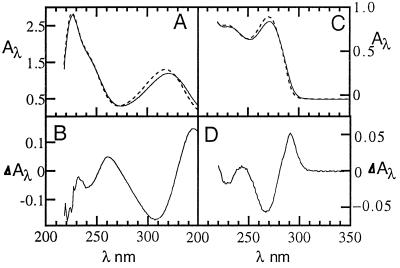
UV absorption spectra and temperature-difference spectra of HO5dCyt in 0.02 M NaOH/NaHCO3 buffer at pH 10.5 at 25°C (A, dashed line), 75°C (A, solid line) and 75° − 25°C (B). Comparable spectra of dCyt in 0.02 M NaOH/NaHCO3 buffer at pH 7 at 25°C (C, dashed line), 75°C (C, solid line) and 75° − 25°C (D).
Figure 6.
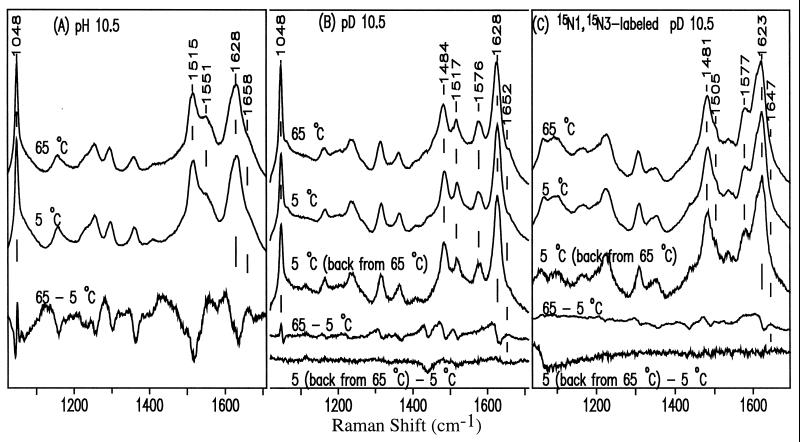
UVRR spectra (257-nm excitation) of anionic HO5dCyt at 65°C and 5°C, and temperature-difference spectrum 65° − 5°C at pH 10.5 (A) or pD 10.5 (B). Comparable spectra of 15N1,15N3-HO5dCyt at pD 10.5 (C). B and C also show spectra of HO5dCyt at 5°C before and after heating to 65°C.
Figure 7.
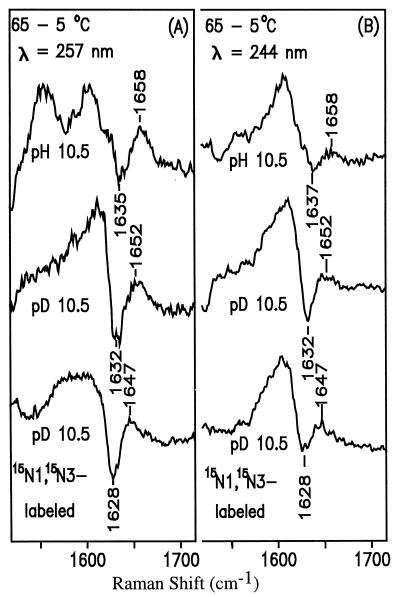
UVRR temperature-difference spectra of anionic HO5dCyt obtained with 257-nm (A) and 244-nm (B) excitation.
In anionic HO5dCyt, the π → π* transition band centered at 318 nm in the UV absorption spectrum (16) is markedly red-shifted relative to that in the spectrum of dCyt, where it is centered at 271 nm. As temperature is raised from 25° to 75°C, the 318-nm band for HO5dCyt undergoes a further hypochromic red shift to 320 nm. The change that occurs when the temperature is raised is reversed fully when the temperature is returned to 25°C (data not shown). Moreover, when the temperature is raised from 25° to 75°C for dCyt, the resulting hypochromicity in the 271-nm band is red-shifted only marginally. This difference in sensitivity to increasing temperature indicates that temperature elevation induces an additional type of change in the electronic structure of HO5dCyt that does not occur in dCyt. This additional change is consistent with a much greater unfavored tautomer concentration for anionic HO5dCyt than for dCyt.
From the UVRR temperature-difference spectra, it can be seen that on going from 5° to 65°C, a new species with a distinct band pattern appears. Because the original Raman spectrum is recovered after the heated solution is cooled (Fig. 6 B and C), as was the original UV spectrum (see above), the species enhanced at high temperature must be in equilibrium with the major species (amino tautomer) that is responsible for the other UVRR bands. We identify the new species as the imino tautomer of HO5dCyt (pH 10.5 and pD 10.5; Fig. 2), whose existence is characterized by the marker band at 1658 cm−1 (pH 10.5) and 1652 cm−1 (pD 10.5) in the temperature-difference spectra. This marker band appears against the relatively clean background of the original HO5dCyt spectrum, and as noted, it changes reversibly with temperature. The resemblance of its high wavenumber to that of the carbonyl band of the model compounds Me3Cyt (Fig. 8A) and MeO4dCyt (Fig. 8B) leads us to assign it confidently to the carbonyl stretching mode of the imino tautomer. Although the introduction of 15N at both N1 and N3 in the minor tautomer in D2O downshifts the carbonyl band from 1652 cm−1 to 1647 cm−1, protonation at N3 induces D2O-sensitivity (1658 cm−1 → 1652 cm−1) in that band. Note that such a downshift does not occur for the carbonyl band in the amino form (Table 2). Comparison of the temperature-difference spectra in Fig. 7 also shows that the carbonyl band is more enhanced with 257- than with 244-nm excitation. It is important to emphasize that such a temperature-difference band could not be detected for neutral HO5dCyt (data not shown; see Discussion).
Table 2.
Marker C2⩵O band for tautomers of anionic HO5dCyt and model imino analogs
| Tautomer | Carbonyl band location, cm−1
|
||
|---|---|---|---|
| pH 10.5 | pD 10.5 | pD 10.5 (15N1-, 15N3-) | |
| HO5dCyt (amino) | 1628 | 1628 | 1623 |
| HO5dCyt (imino) | 1658 | 1652 | 1647 |
| MeO4dCyt (imino) | 1669 | 1665 | 1662 |
| Me3Cyt (imino) | 1669 | 1669 | — |
Taken together, these observations provide coherent evidence for the enhanced occurrence of an imino tautomer of anionic HO5dCyt at elevated temperature.
DISCUSSION
Mechanism for Enhanced Frequency of Imino Tautomer of Anionic HO5dCyt.
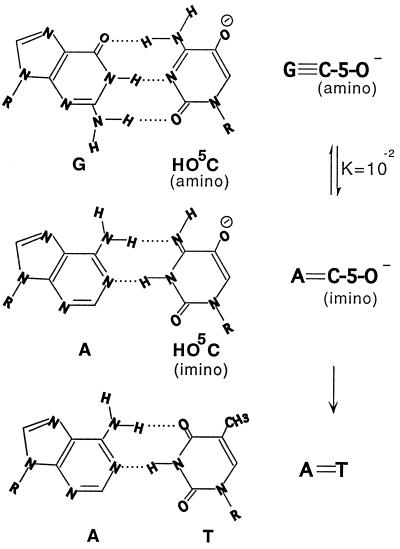
In the Watson–Crick base-pairing schemes, the bases all occur as the favored tautomers. It is the very strong preference for these favored tautomers and their role in the successive incorporation and checking steps that provide a basis for the great fidelity of DNA replication (2). Although the spontaneous mutation frequencies are ≈10−9 for transitions and ≈10−10 for transversions (17, 18), these low levels can be accounted for by the role of the unfavored base tautomers in both the nucleotide incorporation step and the subsequent editing step of the replication process (2). In those steps, the unfavored tautomers occur with frequencies from ≈10−4 to 10−5 (2). At such frequencies, C pairs with A rather than with G in the incorporation step of DNA replication. Moreover, the introduction of a substituent into the dCyt residue could possibly result in a base analog whose imino tautomer occurs at much higher frequency. The recently identified oxidation product of dCyt, HO5dCyt, does in fact prove to be highly mutagenic (10, 19). Although Kreutzer et al. (20) suggest that HO5dCyt mutagenesis could result from its deamination, their results are irrelevant to the work of Feig et al. and Fujikawa et al. (10, 19). Moreover, we have no indication of such deamination even at 65°C and pH 10.5. Rather, our results and those of Feig et al. and Fujikawa et al. indicate that HO5dCyt is directly mutagenic. Direct mutagenicity must be the case, because the H bonding potential of its imino tautomer resembles that of T (Fig. 9), which explains the C → T substitution mutation observed in DNA damaged by reactive oxygen species.
Figure 9.
Suggested mechanism of transition mutagenesis by anionic HO5dCyt. R = 2′-deoxyribose.
The neutral 5-hydroxyl group of HO5dCyt is electron-withdrawing, as indicated by the reduction of the pK1 of N3 by 0.6 unit relative to that of dCyt. An electron-withdrawing substituent at C5 would not be expected to increase the frequency of the imino tautomer, which requires a proton at N3. However, on ionization of the 5-hydroxyl group (pK2 7.4, Fig. 1B), the inductive property of the 5-substituent is reversed. In that event, an increase in the imino tautomer frequency would be expected for the anionic form of HO5dCyt, as anticipated by quantum chemical calculations (M. Karelson, A. Katritsky, and J.R.F., unpublished work). This increase is caused by the ionized 5-hydroxyl group (O−), which is strongly electron-donating and which substantially increases the basicity of N3. In a similar fashion, the pK of N3 of 5-hydroxy-2′-deoxyuridine is increased to 11.7, which is 2.4 units higher than in 2′-deoxyuridine (13), confirming that ionization of the 5-hydroxyl substituent strongly increases the affinity of N3 of the pyrimidine moiety for a proton. The relatively low pK2 of the 5-OH substituent of HO5dCyt is the key to its much enhanced tendency towards the unfavored tautomer and therefore to its mutagenicity.
Estimation of Frequency of Imino Tautomer of HO5dCyt.
In view of the similarity between the structure of anionic HO5dCytimino and the model compounds Me3Cyt and MeO4dCyt, their electronic transition moments and Franck–Condon factors must be comparable (21). If that is the case, then the relative intensities of their marker carbonyl bands in spectra measured under comparable conditions should reflect the relative proportion of their imino tautomer species. Therefore, spectra were measured for the anionic form of HO5dCyt and the neutral forms of Me3Cyt (pH 11) and of MeO4dCyt (pH 7) at the same nucleoside concentration and in the presence of the same concentration of internal standard. Consistent with expectation, the intensities of the marker carbonyl band are nearly the same at room temperature for Me3Cyt, which is fixed structurally as an imino tautomer analog, and for MeO4dCyt, which is known to be more than 90% in the imino form (ref. 22; see below).
As noted earlier, the carbonyl imino tautomer band in anionic HO5dCyt is too weak to be identified at low temperature, but it was possible to locate and quantify its intensity reliably in the 65° − 5°C temperature-difference spectrum. The intensity of this difference band is not directly comparable to that of the amino form of HO5dCyt. This is because the electronic structures of the two tautomers are different, so that their electronic transition moments and Franck–Condon factors differ. It is nevertheless impressive that the difference band is ≈5% of that of the carbonyl band of the amino form. For quantitative purposes, the intensity of the difference band was compared instead with the intensity of the carbonyl band of the model imino analog Me3Cyt. This comparison, made by normalizing the relevant spectra against the corresponding intensities of the internal standard and then curve fitting to determine the intensity of the carbonyl band for Me3Cyt and of the difference band for HO5dCyt, gives a ratio of ≈1%. With a pK2 of 7.4 and assuming the neutral form has a much lower tendency toward the imino tautomer (M. Karelson, A. Katritsky, and J.R.F., unpublished work), this comparison gives a biologically relevant imino tautomer frequency for HO5dCyt of ≈0.3–0.7%, i.e., the 1% value is reduced, assuming mutagenesis only from the anionic species near room temperature. This value, some 102- to 103-fold higher than the putative imino tautomer frequency of the natural residue dCyt, is comparable to the mutation frequency induced by HO5dCyt (10).
With an electronegative methoxy substituent on N4, MeO4dCyt, the product of reaction between dCyt and methoxamine (NH2OCH3; ref. 23) has been shown by NMR to pair with both A and G in a DNA duplex (24, 25). Generally, it is agreed that this ambivalent base pairing is caused by the co-occurrence of substantial proportions of both imino and amino tautomers, with the imino form predominating in aqueous solution at room temperature by a 20:1 ratio (22).
The increasing tendency toward the imino tautomer from dCyt (10−4 to 10−5) → anionic HO5dCyt (10−2) → MeO4dCyt (101) makes it apparent that the tautomeric equilibrium is determined mainly by the relevant basicity of ring N3 and exocyclic N4 of the cytosine moiety, which, in turn, is influenced strongly by the electronegative substituent; the higher the basicity of N3 relative to that of N4 because of the influence of the substituent, the higher the frequency of the imino relative to the amino tautomer.
Relevance of Findings to the Mechanism of Substitution Mutations.
The compelling evidence obtained in this investigation combined with that of M. Karelson, A. Katritsky, and J.R.F. (unpublished work) for the enhanced occurrence of the imino tautomer provides a molecular rationale for the unusually high mutagenicity associated with HO5dCyt, thereby supporting the general role hypothesized for unfavored base tautomers in the mechanisms of spontaneous substitution mutations (2). These findings strongly militate against arguments that unfavored tautomers of the bases are chemically unreasonable intermediates leading to transitions and transversions (26, 27); the findings also emphasize the plausibility of the mutagenic roles proposed for such tautomers.
The argument that the thermodynamically predominant non-Watson–Crick configurations of mispairs are the reaction intermediates involved in erroneous DNA replication events (28, 29) places the discrimination between “correct” Watson–Crick and “incorrect” non-Watson–Crick base pairs not on the stereochemical discrimination capability of the replicative apparatus (2) but on differences in their thermodynamic stability. Such an argument assumes that the replicative event is an equilibrium process, which it is not. The concept of stereochemical selection of the Watson–Crick base pairs and their sterically equivalent pseudo-Watson–Crick pairs (2) is supported by many observations (e.g., refs. 30–32) indicating that nucleic acid polymerases catalyze template-directed synthesis with various unnatural and noncanonical combinations of template residues and incoming triphosphates only when they conform to Watson–Crick geometry. These findings indicate that the polymerases are very sensitive to the external geometry of a base pair but are indifferent to the arrangement of hydrogen bonds and other interactions that maintain that stereochemistry. In this connection, the mispairs formed only from favored tautomers of the canonical bases always distort that geometry, either vectorially, as for the wobble base pairs, or by deviating from the standard glycosyl-bond separation distance, as with purineanti⋅purineanti pairs or with certain pyrimidine⋅pyrimidine pairs (2, 33). In addition, all indications are that mismatch repair enzymes distinguish wobble from Watson–Crick pairs based on stereochemical rather than just thermodynamic criteria.
The idea favored by the present analysis has found compelling verification in a recent observation (S. Johnson, J. Kiefer, and L. S. Beese, unpublished work); a crystalline DNA polymerase-template complex with a G⋅T wobble pair at the incorporation site becomes locked into a distorted conformation incapable of proceeding to the incorporation of the next substrate nucleotide, whereas a Watson–Crick-paired substrate nucleotide can proceed to incorporation of the next substrate nucleotide. This finding indicates that wobble base pairs can be distinguished from Watson–Crick and pseudo-Watson–Crick pairs by the replicative apparatus. What remains in the quest to understand the mechanism underlying substitution mutational events is to observe a mispair locked in its transition state within the polymerase, i.e., before it decays to the wobble conformation in the distorted polymerase incorporation site.
The demonstration of an unfavored tautomer of a mutagenic base analog at a level consistent with its mutagenicity provides strong support for a major stereochemical component to base discrimination in nucleic acid synthesis.
Acknowledgments
We are grateful to Dr. X. Zhao for helpful discussions regarding the interpretation of the Raman spectra. This work was supported by National Institutes of Health Grants GM42936 to J.R.F., GM25158 to T.G.S., and GM41336 and CA33572 to L.C.S.
ABBREVIATIONS
- dCyt
2′-deoxycytidine
- HO5dCyt
5-hydroxy-2′-deoxycytidine
- Me3Cyt
N3-methylcytidine methosulfate
- MeO4dCyt
N4-methoxy-2′-deoxycytidine
- UVRR
UV resonance Raman spectroscopy
References
- 1.Watson J D, Crick F H C. Nature (London) 1953;171:964–967. doi: 10.1038/171964b0. [DOI] [PubMed] [Google Scholar]
- 2.Topal M D, Fresco J R. Nature (London) 1976;263:285–289. doi: 10.1038/263285a0. [DOI] [PubMed] [Google Scholar]
- 3.Elguero J, Marzin C, Katritzky A R, Linda P. In: Tautomerism of Heterocycles, Advances in Heterocyclic Chemistry. Katrisky A R, Boulton A J, editors. New York: Academic; 1976. , Suppl. 1, pp. 1–71. [Google Scholar]
- 4.Dreyfus M, Dodin G, Bensaude O, Dubois J E. J Am Chem Soc. 1975;97:2369–2376. doi: 10.1021/ja00842a011. [DOI] [PubMed] [Google Scholar]
- 5.Kwiatkowski J S, Zielinski T J, Rein R. Adv Quantum Chem. 1986;18:85–130. [Google Scholar]
- 6.Tucker G, Irvin J. J Am Chem Soc. 1951;73:1923–1929. [Google Scholar]
- 7.Kenner, G. W., Reese, C. B. & Todd, A. R. (1955) J. Chem. Soc., 855–859.
- 8.Katritsky, A. & Waring, A. J. (1962) J. Chem. Soc., 1504–1544.
- 9.Tkeshelashvili L K, McBride T J, Spence K, Loeb L A. J Biol Chem. 1991;266:6401–6406. [PubMed] [Google Scholar]
- 10.Feig D I, Sowers L C, Loeb L A. Proc Natl Acad Sci USA. 1994;91:6609–6613. doi: 10.1073/pnas.91.14.6609. [DOI] [PMC free article] [PubMed] [Google Scholar]
- 11.LaFrancois, C. J., Fujimoto, J. & Sowers, L. C. (1998) Chem. Res. Toxicol., in press. [DOI] [PubMed]
- 12.Mukerji I, Shiber M C, Fresco J R, Spiro T G. Nucleic Acids Res. 1996;24:5013–5020. doi: 10.1093/nar/24.24.5013. [DOI] [PMC free article] [PubMed] [Google Scholar]
- 13.Privat E J, Sowers L C. Mut Res. 1996;354:151–156. doi: 10.1016/0027-5107(96)00005-x. [DOI] [PubMed] [Google Scholar]
- 14.Fodor S P, Rava R P, Hays T R, Spiro T G. J Am Chem Soc. 1985;107:1520–1529. [Google Scholar]
- 15.Purrello R, Molina M, Fresco J R, Spiro T G. J Am Chem Soc. 1993;115:760–767. [Google Scholar]
- 16.Hug W, Tinoco I., Jr J Am Chem Soc. 1973;95:2803–2813. doi: 10.1021/ja00790a010. [DOI] [PubMed] [Google Scholar]
- 17.Drake J W. Nature (London) 1969;221:1132. doi: 10.1038/2211132a0. [DOI] [PubMed] [Google Scholar]
- 18.Fowler R G, Degnen G E, Cox E C. Mol Gen Genet. 1974;133:179–191. doi: 10.1007/BF00267667. [DOI] [PubMed] [Google Scholar]
- 19.Fujikawa K, Kamiya H, Kasai H. Nucleic Acids Res. 1998;26:4582–4587. doi: 10.1093/nar/26.20.4582. [DOI] [PMC free article] [PubMed] [Google Scholar]
- 20.Kreutzer D A, Essigmann J M. Proc Natl Acad Sci USA. 1998;95:3578–3582. doi: 10.1073/pnas.95.7.3578. [DOI] [PMC free article] [PubMed] [Google Scholar]
- 21.Spiro T G, Stein P. Annu Rev Phys Chem. 1977;28:501–521. [Google Scholar]
- 22.Morozov Y V, Savin F A, Chekhov V O. Photochemistry. 1982;20:229–251. [Google Scholar]
- 23.Shugar D, Huber C, Birnbaum G. Biochim Biophys Acta. 1976;447:274–284. doi: 10.1016/0005-2787(76)90050-2. [DOI] [PubMed] [Google Scholar]
- 24.Gdaniec Z, Ban B, Sowers L C, Fazakerley G V. Eur J Biochem. 1996;242:271–279. doi: 10.1111/j.1432-1033.1996.0271r.x. [DOI] [PubMed] [Google Scholar]
- 25.Fazakerley G V, Gdaniec Z, Sowers L C. J Mol Biol. 1993;230:6–10. doi: 10.1006/jmbi.1993.1119. [DOI] [PubMed] [Google Scholar]
- 26.Morgan A R. Trends Biochem Sci. 1993;18:160–163. doi: 10.1016/0968-0004(93)90104-u. [DOI] [PubMed] [Google Scholar]
- 27.von Borstel P. Mut Res. 1994;307:131–140. doi: 10.1016/0027-5107(94)90285-2. [DOI] [PubMed] [Google Scholar]
- 28.Echols H, Goodman M F. Annu Rev Biochem. 1991;60:477–511. doi: 10.1146/annurev.bi.60.070191.002401. [DOI] [PubMed] [Google Scholar]
- 29.Kennard O. In: Nucleic Acids and Molecular Biology. Eckstein F, Lilley D M J, editors. Heidelberg: Springer; 1987. pp. 25–52. [Google Scholar]
- 30.Kornberg A. DNA Replication. New York: Freeman; 1980. p. 33. , 119–120, 130. [Google Scholar]
- 31.Piccirlli J A, Krauch T, Moroney S E, Benner S A. Nature (London) 1990;343:33–37. doi: 10.1038/343033a0. [DOI] [PubMed] [Google Scholar]
- 32.Moran S, Ron R X, Kool E. Proc Natl Acad Sci USA. 1997;94:10506–10511. doi: 10.1073/pnas.94.20.10506. [DOI] [PMC free article] [PubMed] [Google Scholar]
- 33.Topal M, Fresco J R. Nature (London) 1976;263:289–293. doi: 10.1038/263289a0. [DOI] [PubMed] [Google Scholar]


