Abstract
In this paper, we review the concept of sustainability with regard to a single-species, age-structured fish population with density dependence at some stage of its life history. We trace the development of the view of sustainability through four periods.
The classical view of sustainability, prevalent in the 1970s and earlier, developed from deterministic production models, in which equilibrium abundance or biomass is derived as a function of fishing mortality. When there is no fishing mortality, the population equilibrates about its carrying capacity. We show that carrying capacity is the result of reproductive and mortality processes and is not a fixed constant unless these processes are constant. There is usually a fishing mortality, FMSY, which results in MSY, and a higher value, Fext, for which the population is eventually driven to extinction. For each F between 0 and Fext, there is a corresponding sustainable population. From this viewpoint, the primary tool for achieving sustainability is the control of fishing mortality.
The neoclassical view of sustainability, developed in the 1980s, involved population models with depensation and stochasticity. This viewpoint is in accord with the perception that a population at a low level is susceptible to collapse or to a lack of rebuilding regardless of fishing. Sustainability occurs in a more restricted range from that in the classical view and includes an abundance threshold. A variety of studies has suggested that fishing mortality should not let a population drop below a threshold at 10–20% of carrying capacity.
The modern view of sustainability in the 1990s moves further in the direction of precaution. The fishing mortality limit is the former target of FMSY (or some proxy), and the target fishing mortality is set lower. This viewpoint further reduces the range of permissible fishing mortalities and resultant desired population sizes. The objective has shifted from optimizing long-term catch to preserving spawning biomass and egg production for the future. The use of discount rates in objective functions involving catch is not a suitable alternative to protecting reproductive value.
As we move into the post-modern time period, new definitions of sustainability will attempt to incorporate the economic and social aspects of fisheries and/or ecosystem and habitat requirements. These definitions now involve ‘warm and fuzzy’ notions (healthy ecosystems and fishing communities, the needs of future generations, diverse fish communities) and value judgements of desired outcomes. Additional work is needed to make these definitions operational and to specify quantitative objectives to be achieved. In addition, multiple objectives may be incompatible, so trade-offs in what constitutes sustainability must be made. The advances made under the single-species approach should not be abandoned in the post-modern era, but rather enhanced and combined with new approaches in the multi-species and economic realms.
Keywords: sustainability, single-species, population, model, fishery, management
1. Introduction
Agent Smith: ‘Every mammal on this planet instinctively develops a natural equilibrium with the surrounding environment. But you humans do not. You move to an area and you multiply and multiply until every natural resource is consumed and the only way you can survive is to spread to another area. There is another organism on this planet that follows the same pattern… A virus. Human beings are a disease, a cancer of this planet. You are a plague.’The Matrix (see http://www.scifiscripts.com/matrix_97_draft.txt)
Sustainability has emerged as one of the key foci of the 2000s across a variety of disciplines. The adjective ‘sustainable’ has been attached to nouns such as yield, use, harvest, population, resources, ecosystem, species, habitat, development, economy, community, education, energy, resources, poetry and future. Associated with sustainability are the concepts of precaution, risk aversion, resilience, persistence, rebuilding, maintenance, health, robustness, adaptive management, diversity, tradition, uncertainty and conservation. In no field more so than in fisheries management has this focus become so ubiquitous, because of the overfishing of so many fish populations worldwide.
Sustainability seems to mean different things to different people. Two applicable definitions from the Oxford Concise Dictionary are that sustainability is the ability to ‘bear weight of, hold up, keep from falling or sinking’ or ‘keep going continuously’. We perceive that scientists in the natural resources fields are similarly concerned with resources not diminishing and that they remain at a relatively high level over a long time period.
A definition of sustainability specific to fisheries appears in the report ‘Sustaining marine fisheries’ from the National Research Council (1999): ‘Fishing activities that do not cause or lead to undesirable changes in biological and economic productivity, biological diversity, or ecosystem structure and functioning from one human generation to the next … conducted over the long term at an acceptable level of biological and economic productivity without leading to ecological changes that foreclose options for future generations’. Wefering et al. (2000) state: ‘The concept of sustainability combines the needs of present and future generations, and takes the interdependencies of economic activities and ecological status into account’.
One major problem in defining sustainability is that most definitions like these are not operational, in the sense that they do not contain a set of specific rules or procedures to tell whether a particular fishery or ecosystem meets the definition. According to Wefering et al. (2000), ‘the goal of sustainable development has a noteworthy weakness—the difficulty of measuring sustainability’. They further asserted that there is a need for sustainability indicators: reference values and sustainability thresholds, and the adequate representation of reversible and manageable processes. Nevertheless, current operational definitions seem arbitrary, ambiguous or applicable only to particular situations. Larkin (1977) noted that earlier attempts to improve on MSY by defining ‘optimum yield’ were plagued by the similar lack of an operational basis. Fogarty & Murawski (1998) observed: ‘Although sustainability is an explicit objective of fishery policy in many areas throughout the world, articulation of this principle has not prevented overexploitation of many stocks. Clear and meaningful objectives with specific management goals must be stated and implemented’.
To make the definition of sustainability more operational, Charles (2001), in the book Sustainable fishery systems, breaks sustainability into four components: (i) ecological, (ii) socio-economic, (iii) community and (iv) institutional. The ecological component involves the single-species resource base, interacting species and the ecosystem in which they are embedded. The socio-economic component involves macro-level socio-economic welfare related to overall net revenue and employment. The community component refers to micro-level socio-economic welfare at the level of individual communities. Finally, the institutional component relates to the management structure that is developed to provide for the first three components and involves the regulatory and management structures. In this paper, we focus only on the ecological component related to single species.
Historically, the sustainability of fish populations and their fisheries has been predicated on what is called the ‘single-species approach’, in which assessments and management recommendations are made using data only from the species of interest. The surplus production beyond that necessary for maintaining the population is considered available for human use. The centrepiece of the single-species approach is a population dynamics model that integrates the biological processes affecting the population, the effects of harvesting and the information collected from its fisheries and from scientific studies.
Criticisms of this approach have intensified in the past tenyears and include the following.
Assessment models are biased because they do not incorporate the predation by other species.
Assessment models are limited because of their emphasis on equilibrium solutions, such as MSY.
Assessment models do not usually account for environmental changes, whether interannual or interdecadal.
A correct assessment approach requires that a multi-species framework be used.
Harvest recommendations from single-species assessment do not consider the needs of other species.
Harvest recommendations from single-species assessment involve the deliberate fishing down of a population and therefore adversely change the ecosystem.
The single-species approach is invalidated, because overfishing has occurred for at least a majority of the world’s fisheries.
Single-species approaches do not account for the indirect effects of fishing (e.g. bottom fishing on habitat quality).
We review the history of the single-species approach and show how the underlying features of single-species models are important to the definition of sustainability. This relationship involves the biological processes affecting a population such as growth, reproduction, mortality, density dependence and stochasticity. Using a prototype of a fish population and fishery, we illustrate these key processes and their influence on population dynamics. We clarify the limits of single-species assessment models by commenting on the above criticisms. We assert that the single-species approach still has much to offer and recommend that it continue to be used and improved. At the same time, new approaches need to be developed to account for other components of sustainability such as multi-species interactions, but these should not cause the single-species approach to be abandoned.
2. Single-species models
The single-species approach can be divided into three parts: the population assessment model, the management strategy resulting from the model and the implementation of the strategy. We deal with only the first two parts. Implementation is related to the fourth component of Charles’s (2001) definition of sustainability (institutional and management issues). Sissenwine & Mace (2001) contend that much of the overfishing that has occurred can be traced to implementation failure rather than to the failure of scientific advice resulting from the first two parts.
Population assessment models, reviewed thoroughly in Hilborn & Walters (1992) and Quinn & Deriso 1999, have varying levels of complexity. Surplus production models combine biological processes into a few population parameters such as intrinsic rate of increase and carrying capacity. Delay–difference models account explicitly for growth, mortality and recruitment in an age-structured setting, but do not use age-structured data. Age-structured assessment models integrate biological factors and use a variety of data. Length- or size-structured models are generalizations of age-structured models that use length-structured data and focus on the conversion of length to age with growth models.
Regardless of which model form is used, the long-term behaviour is the same, in that the population usually converges to a stable equilibrium value (but see § 4a for chaotic behaviour). This convergence requires density dependence, usually in early life history. The most prominent type of density dependence involves compensatory reduction in early life survival as the population increases, in which ‘density’ may be measured in terms of the total population, spawning population, population during early life or these quantities per unit area. We avoid population models with density independence, because they admit only exponential behaviour to either infinite or zero population size. We further avoid models with constant recruitment, which are unrealistic in the limits of low and high population size. Recruitment cannot be constant at very low spawning sizes because too few eggs are produced. It cannot be constant at very high population sizes, because there would be insufficient food or habitat for the population. Constant recruitment always leads unrealistically to a sustainable population, because there is always a new set of individuals to replace those that die, no matter what the cause.
We classify the scientific study of sustainability into four periods. Classical sustainability (say 1970s and before) deals with deterministic population models not subject to environmental or stochastic variability. Post-classical sustainability (say 1980s) incorporates either depensation (low survival at low population size) or stochasticity (random variation) in early life history. In modern sustainability (say 1990s), precaution is further considered and leads to more conservative approaches. Finally, we are entering the post-modern period, in which additional components of sustainability related to ecological and socio-economic considerations are included. The first three periods have seen primarily single-species approaches. We admit that our categories are necessarily crude and that the evolution of sustainability in view of biological processes has not been a strictly linear process. Nevertheless, these nominal categories and time periods serve to illustrate some dramatic changes in both modelling of populations and in the perception of what scientifically constitutes the sustainability of natural populations.
3. Classical sustainability
Without loss of generality, we consider a deterministic, age-structured population with density dependence in its early life history (Quinn & Deriso 1999, ch. 7). The density dependence is represented by a spawner–recruit relationship, such as the Ricker or Beverton–Holt. Recruitment is defined as the abundance of 1-year-olds and spawning is quantified by the amount of egg production (the sum over age of the product of abundance, maturity and fecundity). The spawner–recruit function is written as N1,t+1=Eggst×S0(Eggst), in which Eggst is the egg production in year t and S0 is the density-dependent survival for age 0. The population is subject to both natural (M) and fishing (F) mortality. For ages a older than 1 year, a recursion relationship governs the population dynamics:
For reasonable values of M and F that are constant over time, the population (usually) tends to a positive equilibrium abundance (in numbers) and biomass (in weight). Consequently, there are also positive equilibrium values for catch (in numbers) and yield (in weight). When fishing mortality F=0, the population tends to its carrying capacity K (also known as unfished, pristine or virgin biomass). The formula for K can be written in abundance or biomass as the sum of equilibrium abundances or biomasses at age, or
where Λa=(juvenile survival)×(adult survival to age a), Wa=average weight at age a, R1=∑amaturitya×fecunditya×Λa (lifetime eggs per 1 year old), (see Quinn & Deriso 1999, ch. 7, eqns (7.42) and (7.46)). The ratio of progeny to egg production is early-life survival from age 0 to age 1 and is clearly a function of egg production. Thus, K is a derived quantity that is a function of lifetime egg production of a 1 year old, the inverse function of early life survival and cumulative survival values from age 1 up to each successive age. Thus, carrying capacity results from reproductive and mortality processes, some of which may be affected by prior fishing. When any of these processes is not constant over time, then K should not be viewed as a constant.
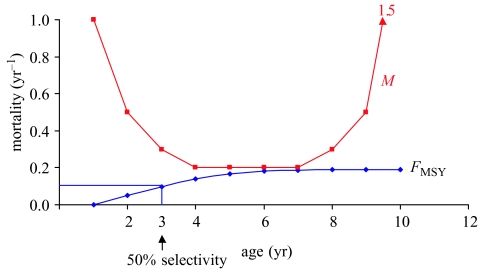
We develop a hypothetical prototype of an age-structured population to illustrate these concepts. The population has 10 ages. Natural mortality M is a U-shaped function of age, with the highest mortality during the early life history and increasing mortality as senescence approaches at the older ages (figure 1). Fishing mortality F is a logistic function of age, in which 50% selectivity occurs at age 3. This function is also illustrated in figure 1, corresponding to fishing at a rate that produces MSY (see figure 6 legend).
Figure 1.
Natural (M) and fishing mortality (F) as a function of age for the prototype. Fishing mortality shows the selectivity of the gear as a function of age and is shown at the rate producing MSY. The value for natural mortality at age 9 is 1.5.
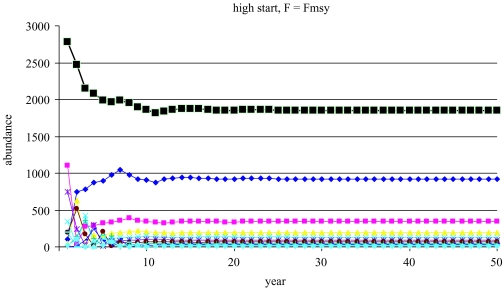
Figure 6.
Trajectory of the prototype over 50 years with fishing at the rate producing MSY, showing convergence to a lower stationary, stable population than with no fishing. Key as in figure 5.
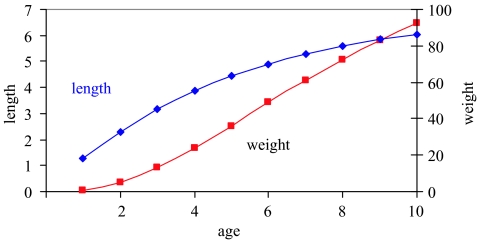
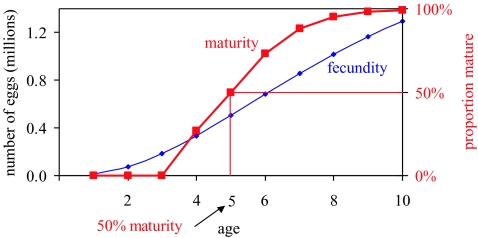
Length L is modelled as a typical von Bertalanffy function, and weight W is an isometric (cubic) function of length (figure 2). Maturity is a logistic function of age, in which 50% are mature at age 5 (figure 3). Fecundity is an isometric function of length (figure 3). A Ricker spawner–recruit relationship (N1=Eggs×αexp(−βEggs)) is used to determine the number of age 1 individuals from the number of eggs produced by the spawning population (figure 4). Population parameters are given in table 1. None of the population parameters is a function of time, so that carrying capacity K is a constant. Two initial populations are examined: a low population well below the equilibrium level and a high population above the equilibrium population but with an age distribution far from that of equilibrium.
Figure 2.
Length (L) and weight (W) as a function of age for the prototype.
Figure 3.
Maturity and fecundity as a function of age for the prototype. The product of the two, net fecundity, is used to calculate egg production.
Figure 4.
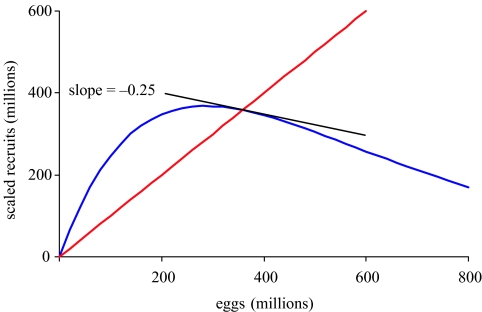
The Ricker spawner–recruit function for the prototype, showing the relationship between scaled age 1 abundance (age 1 abundance multiplied by lifetime egg production) and number of eggs produced. Recruitment is scaled so that the 45° replacement line can be drawn. The intersection is the equilibrium point and it is stable, because the absolute value of its slope is less than 1.
Table 1.
Parameters used in the prototype of an age-structured fish population and low and high initial population numbers at age for the prototype simulations. (Notation is as in Quinn & Deriso (1999).)
| LVB | length–age parameters | L∞ | 100 |
| κ | 0.2 | ||
| t0 | 0 | ||
| isometric | weight–length parameters | α | 0.00001 |
| β | 3 | ||
| isometric | fecundity–length parameters | α | 2 |
| β | 3 | ||
| logistic | maturity–age parameters | m∞ | 1 |
| κ | 1 | ||
| γ | 5 | ||
| Ricker | spawner–recruit parameters | α | 1.00×10⁻⁵ |
| β | 3.50×10⁻⁹ | ||
| logistic | selectivity–age parameters | κ | 1 |
| γ | 3 | ||
| initial population | |||
| age | low | high | |
| 1 | 100 | 100 | |
| 2 | 50 | 1100 | |
| 3 | 50 | 50 | |
| 4 | 0 | 345 | |
| 5 | 0 | 750 | |
| 6 | 0 | 200 | |
| 7 | 10 | 10 | |
| 8 | 5 | 5 | |
| 9 | 0 | 200 | |
| 10 | 20 | 20 | |
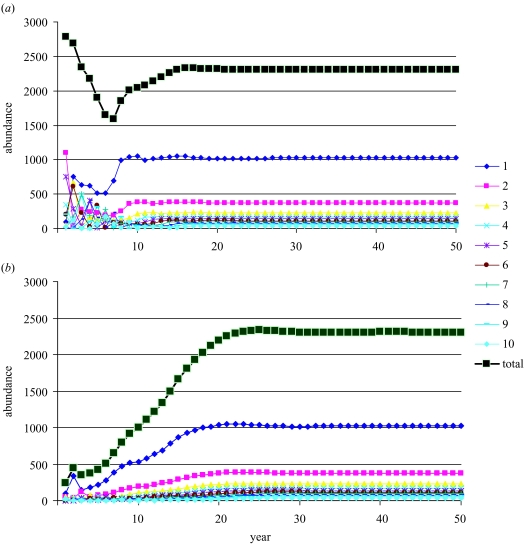
When no fishing occurs, the population equilibrates to its carrying capacity K of almost 2300 individuals, aged 1 year and older (figure 5). The population also has a stable age distribution at equilibrium. These results are independent of whether the population starts low or high. The initial population size influences the trajectory of the approach to equilibrium but not its final outcome. The resulting stationarity of abundance and stability of its age distribution is a result of density dependence in the spawner–recruit relationship and not an assumption being made.
Figure 5.
Trajectory of the prototype over 50 years with no fishing, showing convergence to a stationary, stable population, no matter whether the initial population distribution starts (a) high or (B) low. In both (a) and (b) the population at each age is shown together with the total population, which is the sum over all ages.
When fishing occurs, there is a continuum of sustainable (meaning positive) yields and populations, starting at F=0 with zero yield and equilibrium population at carrying capacity (figure 6. There is a fishing mortality, FMSY, which results in MSY, and a higher value, Fext, for which the population is eventually driven to extinction (termed Fτ, Mace 1994; or Fcrash, ICES 1997). For each F between 0 and Fext, there is a corresponding sustainable population. The trajectory of the population, illustrated in figure 6) when F=FMSY, shows equilibration to a lower population size than the carrying capacity. A finite value for Fext may not exist for some populations depending on the nature of the spawner–recruit relationship or when mean age of spawning is much below mean age of capture.
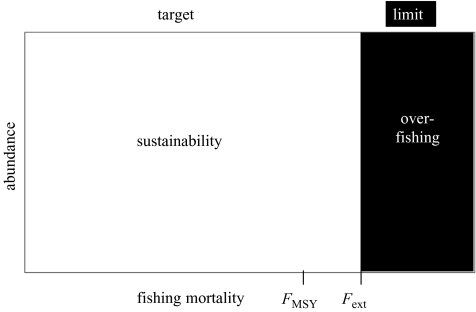
This classical model suggests that fishing mortality is the most important control variable in managing a fishery and that a population at a low level can rebuild quickly to the optimal MSY level. Much of the initial scientific advice regarding catch limits in the 1970s and before, developed from this type of deterministic model. Consequently, the classical view is that FMSY should be viewed as a target, and that Fext is a limit to be avoided (figure 7). Because of quick rebuilding, there is no need for abundance thresholds for curtailing fishing in this view.
Figure 7.
The classical notion of sustainability, with sustainable combinations of fishing and abundance shown in white and unsustainable ones in black. FMSY is the target fishing mortality and Fext is the limit, beyond which the population eventually goes to extinction. In the classical view, current population abundance is not a factor in sustainability, because typical models always have the capability of rebuilding.
4. Neoclassical sustainability
The classical view is at odds with our modern perception that a fish population at a low level is susceptible to collapse or not rebuilding. There are many examples of fish populations that have been reduced to low levels that do not seem to respond quickly (e.g., Zheng et al. 1995; Hutchings 2000; Anderson & Rose 2001). The presence of low survival at low population levels is known as depensation. It is formally defined as those population levels for which d(R/S)/dS>0. A heuristic explanation of this condition is that early-life survival (R/S) is increasing as egg production S increases. Consequently, a decline in a population will cause early-life survival to decline, which exacerbates the population decline. By contrast, for a population without depensation, there would be a compensatory increase in early-life survival as a population declined, which would ameliorate the population decline. Depensation can arise from intraspecific causes, such as the inability to find mates at low population density. It can also arise from interspecific causes, such as a high predator population, which continually crops the prey population when it is at low levels.
Furthermore, the deterministic character of the classical model ignores stochasticity in population processes that could also contribute to lack of recovery. The most important and largest source of variation in population processes is usually in the early life history, which is described by the spawner–recruit function in a population model. Such variation is probably driven by interannual and interdecadal fluctuations in the environment and ecosystem, which may induce changes at all trophic levels. In the neoclassical view of sustainability, depensation and stochasticity are formally incorporated into population models. These two processes began to receive much attention in the 1980s.
(a) Depensation
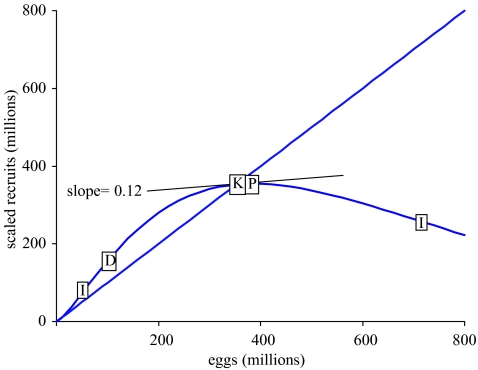
To illustrate the effect of depensation, we modify our prototype by replacing the Ricker spawner–recruit model with the depensatory gamma model: N1=Eggsγ×αexp(−βEggs). Parameter α is changed to 1×10⁻⁸ and γ is set to 1.35 to give a similar curve to the Ricker model, only with the inclusion of depensation for egg production levels of 1×10⁻⁸ (calculated as (γ−1)/β) or less (figure 8). Note that the depensation point is different from the inflection points of the curve. The two inflection points, given by , are on either side of the curve’s peak. The depensatory prototype still has a stable equilibrium, as evidenced by the absolute value of its slope being less than one where it intersects the replacement line.
Figure 8.
The gamma spawner–recruit function for the depensatory prototype, showing the relationship between scaled recruitment (age 1 abundance) and number of eggs produced. (I, inflection point; D, depensation point; K, carrying capacity; P, peak recruitment).
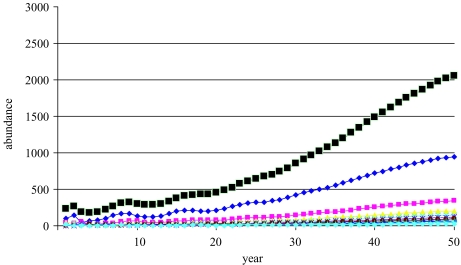
The trajectory of the depensatory prototype (figure 9) is much different from the classical one (figure 5) when the population starts low, although both eventually approach stable equilibrium. The depensation point is not reached until year 30, showing clearly that depensation extends the time to rebuild. Depensation forces recruitments to be low for the first 30 years, which slows population growth. Other mechanisms that could produce low recruitments, such as a regime shift, would create the same effect, independent of cause. Thus biological and environmental effects on recruitment are difficult to separate. In practice, it has been difficult to demonstrate the existence of depensation with observed spawner–recruit data (Myers et al. 1995; Lierman & Hilborn 1997). Even in salmonid populations with a three order of magnitude range in spawner abundance, there is no clear pattern of reduced per capita survival at low spawner abundance (Collie et al. 1990). Furthermore, detecting depensation may be almost impossible for heavily fished populations, because fishing may depress reproductive potential continually, which would prevent rebuilding in itself.
Figure 9.
Trajectory of the depensatory prototype over 50 years with no fishing and a low starting population size, showing retarded population growth until year 30. Key as in figure 5.
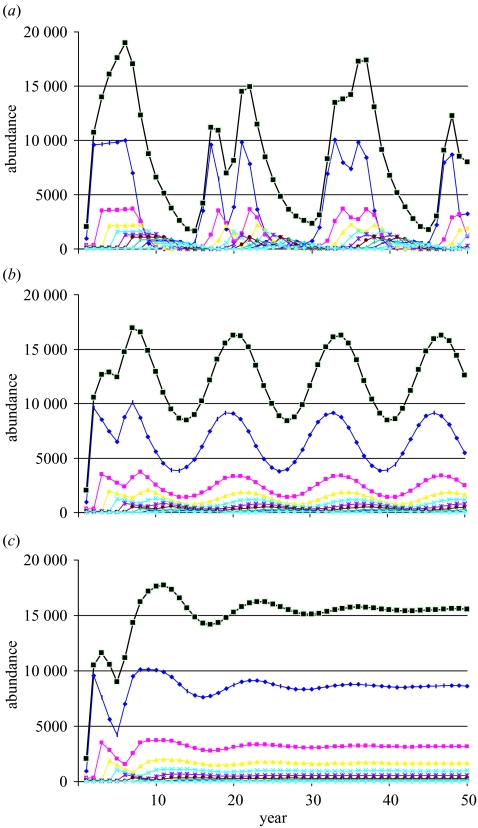
Further complicating the understanding of population processes is the presence of limit cycles and chaos for sufficiently high values of the spawner–recruit parameter α (regardless of what spawner–recruit model is used). Such occurrences challenge our conventional understanding of sustainability. To illustrate this problem, we increase α by a factor of 10 in the depensatory prototype with no fishing and then add fishing at the fully selective F values of 0.3 and 0.5 (figure 10. Under no fishing, the population exhibits wildly chaotic fluctuations in recruitment, seemingly resembling totally random fluctuations, but nevertheless a function of the spawner–recruit relationship. These fluctuations then carry through the subsequent ages in the population. When F=0.3, the outcome is a limit cycle with a period of 14 years. When F=0.5, the population converges to a stable equilibrium and at a higher average level than the unfished population. It is unclear how one should define sustainability for such a population.
Figure 10.
Trajectory of the depensatory prototype with spawner–recruit parameter α increased by a factor of 10 and a low starting population size. It is shown over 50 years with (a) no fishing F=0, (b) fishing at F=0.3, and (c) fishing at F=0.5, showing the change from chaos to limit cycle to stability. Key as in figure 5.
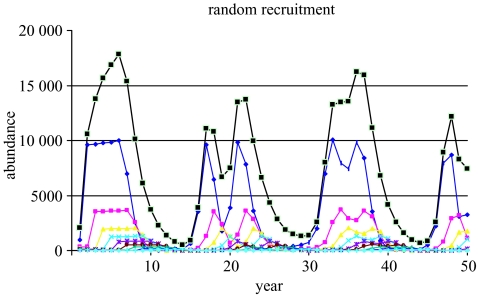
Alternatively, one could posit that recruitment in the unfished population came from an environmental (exogenous) mechanism independent of spawning stock. To illustrate this effect, the model was restructured so that the same recruitment values (at age 1) over time occurred as in the unfished population, no matter what fishing mortality was applied. In that case, fishing the population at F=0.3 (or 0.5) does not change the chaotic dynamics of the population, because they stem solely from the environmental process (figure 11).
Figure 11.
Trajectory of an alternate population, wherein recruitment is identical to the unfished, chaotic depensatory prototype (figure 10a) and the population is fished at F=0.3, showing that chaotic dynamics remain with fishing. Key as in figure 5.
In conclusion, depensation prevents a population from recovering quickly from depletion or overfishing. There are often good biological reasons to suspect that it is present, such as an inability of fishes to find mates at low population densities or increased predation of a smaller juvenile fish school. However, depensation has been hard to detect because it is confounded with environmental fluctuations. No matter what the cause, it is prudent to keep the population from dropping too low. Studies have suggested placing a threshold at 10–20% of K, below which fishing is curtailed (Beddington & Cooke 1983; Quinn et al. 1990b; Thompson 1993). Studies have also shown that curtailing fishing at low population sizes is optimal for many objective functions involving catch (Hightower & Grossman 1987; Quinn et al. 1990b).
(b) Stochasticity
The preceding analyses in this paper have been deterministic, but in reality, we suspect that most population parameters change, especially early-life survival. These changes are expected because the ecosystem is rarely in a stationary state and environmental conditions that affect population parameters are never constant. Theory has shown that stochastic early-life survival reduces median population growth rate (Quinn & Deriso 1999, ch. 7).
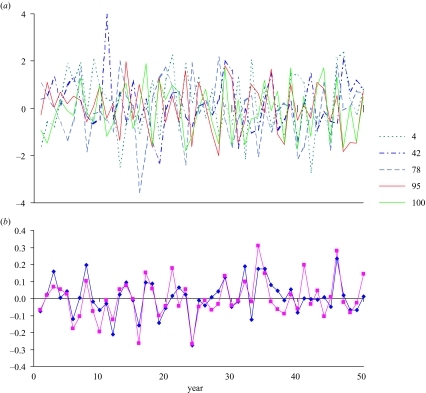
For our stochastic prototype, we alter the Ricker spawner–recruit relationship to include log-normal variability: . This form of the equation is chosen so that the expected value of recruitment, E(N1), is the same as the deterministic value, or E(N1)=Eggs×αexp(−βEggs). The parameter σ, which is approximately equal to the coefficient of variation of recruitment, is set to 1. This value is moderately high compared with values estimated with real populations but is useful for illustrative purposes. We generated 100 replicates of the stochastic model and calculated the mean and median of selected population variables (stochastic errors, recruitment, yield, egg production) for comparison with the deterministic ones. Fishing occurs at the deterministic MSY value.
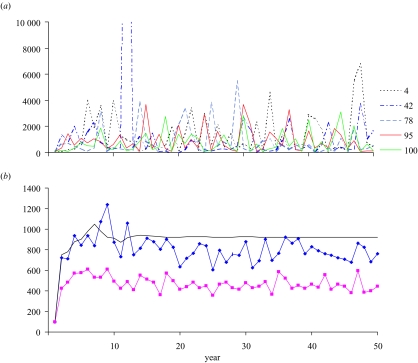
The stochastic errors ε vary mostly between -2 and 2 among years and replications (figure 12a), as expected from the normal distribution. Not surprisingly, the mean and median errors across years vary without trend around zero (figure 12b). Multiplying the Ricker spawner–recruit function with exponentiated values of these errors produces widely varying recruitment values across years and replications (figure 13a). Interestingly, mean recruitment eventually becomes smaller in later years than the deterministic value (figure 13b). We attribute the former result to the fact that, in this situation, stochasticity results in spawning stocks for many years that are offset from the deterministic equilibrium, for which recruitment is near the peak (figure 4). The corresponding recruitments from these spawnings are smaller on average, because they will mainly occur to the left and right of the peak recruitment value in figure 4. This phenomenon was first noted by Cordue (2001), in which the degree of difference is shown to be a function of natural mortality, the steepness of the spawner–recruit curve, and the level of recruitment variability. The median is smaller than both the mean and the deterministic value (figure 13b), which is in agreement with theory related to the skewed log-normal distribution, in which the median is less than the mean.
Figure 12.
(a) Stochastic environmental errors in recruitment across 50 years for five selected replicates (replicate numbers appear in the key) from the stochastic model, generated from the normal distribution with mean 0 and variance 1, and (b) mean (diamonds) and median (squares) of the errors for the 50 years across all 100 replicates.
Figure 13.
(a) Stochastic recruitment across 50 years for five selected replicates from the stochastic model, generated from the Ricker spawner–recruit function with log-normal errors (exponentiated values in figure 12a), and (b) mean (diamonds) and median (squares) recruitment for the 50 years across replications, compared with deterministic (solid line) recruitment.
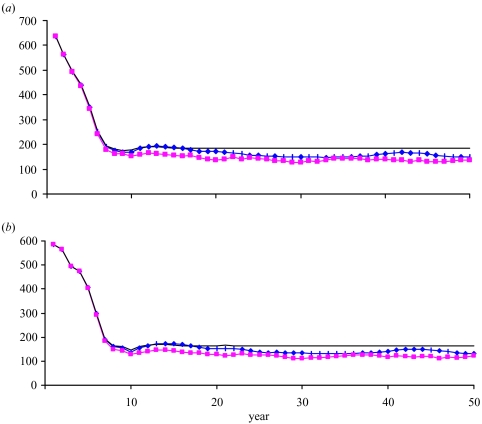
Both mean and median yields are smaller than the deterministic yield across time due to lower recruitment and correspondingly lower population abundance (figure 14a). The same differences occur with egg production (figure 14b).
Figure 14.
(a) Mean (diamonds) and median (squares) yield for the 50 years across replications, compared with deterministic (solid line) yield, with fishing at the MSY level, and (b) corresponding mean (diamonds) and median (squares) egg production for the 50 years across replications, compared with deterministic (solid line) egg production.
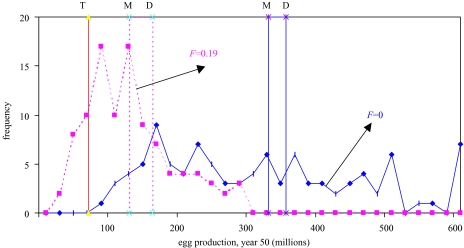
The presence of stochasticity means that the population continues to vary over time rather than reaching a deterministic equilibrium. This concept is illustrated in figure 15, showing the frequency distributions of egg production in a stochastic population under no fishing and fishing at the MSY level. The distributions are quite broad, and the mean is less than the deterministic value. Egg production under no fishing would never drop below a threshold level at 20% of the deterministic value under no fishing. However, the egg production in year 50 would be below this threshold 17% of the time when fishing at the MSY level. One operational definition of an overfished or depleted population is one that falls below this 20% level. In this case, fishing at MSY would produce an overfished population at time 50 in 17% of all realizations of this population.
Figure 15.
Frequency distributions of egg production in year 50 from 100 replications of a stochastic population without fishing (solid line) and with fishing at the MSY level (dotted line). Also shown are the deterministic (D) and mean (M) levels of egg production for both scenarios and a typical threshold level (T) at 20% of the deterministic unfished population.
In conclusion, stochastic effects are large on all population parameters examined, regardless of life stage (from recruitment to the fished population to egg production from the spawning stock). The overall effect of stochasticity is downward: yield and population abundance are lower than the deterministic case. Thus, more conservative action is necessary if stochasticity is present. It would be interesting to see if this pattern holds for other statistical distributions of the errors.
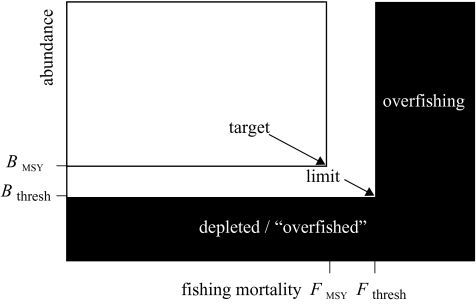
Taken together, the effects of depensation and stochasticity suggest that the classical view of sustainability needs to be altered to prevent the population from going too low. The neoclassical view considers both fishing mortality and abundance, as in figure 16. Compared with the classical view in figure 7, the range of sustainability is reduced in two ways: (i) low abundance below a specified level, say Bthresh, is to be avoided; and (ii) the corresponding fishing mortality, Fthresh, that reduces the population to this low level becomes the new limit and is smaller than Fext. The classical view of FMSY as a target remains unchanged.
Figure 16.
The neoclassical notion of sustainability, with sustainable combinations of fishing and abundance shown in white and unsustainable ones in black. FMSY is the target fishing mortality and Fthresh is the limit, at which the population is expected to equilibrate at Bthresh. In the neoclassical view, both current population abundance and fishing mortality are factors in defining sustainability.
5. Modern sustainability
MSY is the target in both the classical and neoclassical views and its presence remains in many international, national and regional standards and legislative acts to this day (Quinn & Deriso 1999, ch. 11). Various policies evolved to achieve MSY, include constant catch, exploitation and escapement policies. It has been clear that a constant catch at the MSY level is not sustainable, because insufficient production is available at any other biomass level than that producing MSY. Consequently, a constant catch policy must be at a lower level than MSY. Alternatively, constant exploitation or fishing mortality policies automatically adjust for variations in biomass and proper implementation should keep the population near the level producing MSY (albeit with variations depending on the level of stochasticity in the population).
Larkin (1977) presaged many recent concerns in his Epitaph to MSY: ‘Here lies the concept, MSY. / It advocated yields too high, …’. His concerns included a reduction in genetic variability, the observations of catastrophic declines in some fish populations and the inability to accommodate interactions among species. He concluded: ‘It is certain that the concept of MSY will alone not be sufficient’.
As time-series became long enough to examine spawner–recruit curves in the 1980s, it was clear that there was substantial uncertainty in the spawner–recruit relationship, presumably owing to environmental variability. Consequently, alternatives to FMSY were sought, which were not based on a spawner–recruit relationship, such as maximizing the yield per recruit by adjusting fishing mortality (Fmax) and minimum size. However, Fmax is often larger than FMSY because it does not account for density dependence and, consequently, it is often not as conservative. An important development for increased conservatism was F0.1, which is the fishing mortality that produces a marginal 10% increase in yield per recruit compared to that at F=0; F0.1 is necessarily less than Fmax (but not necessarily less than FMSY.
All these biological reference points involve yield optimization as their primary objective. In a landmark paper, Sissenwine & Shepherd (1987) tied together yield per recruit, MSY and spawner–recruit theory and suggested a move to preserving spawning biomass (or egg production) or spawning biomass per recruit. By shifting the focus from the fishery to the resource, conservation and sustainability were explicitly made the primary objectives. Further work by Clark (1993), Thompson (1993) and Mace & Sissenwine (1993) suggested that a constant fishing mortality policy, Fx%, that preserves expected spawning biomass (or egg production) per recruit at x% of an unfished population, would be a suitable proxy for FMSY. Typical values of x are between 35 and 45 (Quinn & Deriso 1999, ch. 11).
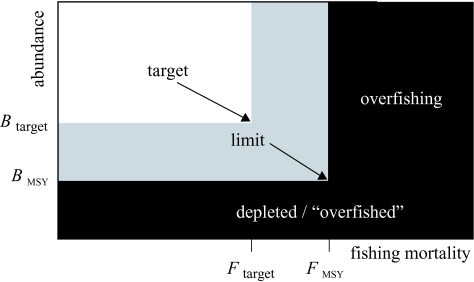
Another important development occurred in the 1990s: the formal consideration of risk (Francis & Shotton 1997; Punt & Hilborn 1997). This development stemmed from advances in assessment methodology and decision-making by considering Bayesian methods and decision analysis. As one example, the International Council for the Exploration of the Sea has adopted a precautionary reference point, Fpa, a fishing mortality rate with a low probability of stock collapse (ICES 1998). The major consequence of considering risk has been the recommendation of lower harvests and related management measures. This has led to quantitative harvest policies (also known as control rules), in which FMSY has changed from a target to a limit (Mace 2001). Thus, the permissible set of fishing mortalities and abundances that constitutes sustainability in the modern view (figure 17) has been further restricted over that in the neoclassical view (figure 16). In this figure, there is a new grey area of caution between the target and limit values. Some people would consider the grey area sustainable; others would not.
Figure 17.
The modern notion of sustainability, with sustainable combinations of fishing and abundance shown in white, cautionary ones in grey, and unsustainable ones in black. FMSY is now the limiting fishing mortality rather than the target. Different people would view the grey area as sustainable or non-sustainable.
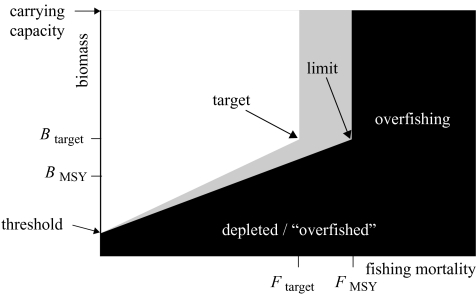
More risk-averse control rules have been implemented in several fisheries than those based on constant fishing mortality. These rules include the aforementioned threshold level, below which fishing is curtailed, or biomass-based adjustment, which implements lower F at population abundance lower than the target level (figure 18). One advantage of the biomass-based adjustment is that more risk-averse action is taken continuously as a population drops below its desired target level, rather than waiting until it drops below the threshold level.
Figure 18.
A biomass-based control rule with a target and a limit. In this example, a constant fishing mortality occurs when the population is above the target up to its carrying capacity. The target fishing mortality is smaller than the limiting fishing mortality of FMSY. When the population drops below the target biomass, fishing mortality is linearly reduced down to zero fishing mortality at a threshold level. A linear reduction in fishing mortality produces approximately a quadratic reduction in catch (yield≈F×B).
To illustrate the modern view of sustainability, we calculated the biological reference points mentioned above for the classical Ricker prototype (table 2. Average natural mortality is ca. 0.30, which can be viewed as an upper bound for reasonable harvest policies, in the sense that higher values are usually above the level producing MSY (Deriso 1982). In this case, FMSY is the most risk-averse, perhaps because of strong density dependence and that the age of 50% maturity occurs two years after the age of 50% selectivity of the fishing gear. Fishing mortality reference points based on spawning biomass per recruit (40% of unfished), egg production per recruit (40%), and spawning abundance per recruit (50%) are similar and close to F0.1. These reference points exploit a small proportion of total abundance (6% or less) and exploitable abundance (25% or less) and preserve spawning biomass per recruit at 38% or more. Fmax is much larger than the others and would be at best on the outer bounds of sustainability.
Table 2.
Biological reference points for the classical Ricker prototype, their average exploitation fractions (μ1=C/N;μ2=C/EN), and their values of spawning biomass per recruit.
(F: full-recruitment fishing mortality; C: catch; N: abundance; EN: exploitable abundance, the sum over age of abundance times selectivity; SB: spawning biomass, the sum over age of the product of abundance, average weight, and maturity; E: egg production, the sum over age of the product of abundance, maturity, and fecundity; SN: spawning abundance, the sum over age of the product of abundance and maturity; R: recruitment, abundance of age 1 fishes.)
| F | μ1(%) | μ2(%) | SB/R(%) | |
|---|---|---|---|---|
| avg. F=M | 0.30 | 6.1 | 24 | 36 |
| FMSY | 0.19 | 4.2 | 15 | 52 |
| Fmax | 0.45 | 7.7 | 33 | 24 |
| F0.1 | 0.28 | 5.8 | 22 | 38 |
| F40%(SB) | 0.26 | 5.5 | 21 | 40 |
| F40%(E) | 0.26 | 5.5 | 21 | 40 |
| F50%(SN) | 0.24 | 5.2 | 19 | 43 |
Discounting is an economic term that relates to sustainability. With a positive discount rate, future yields from a fish stock are valued less than the same yield taken at present (Clark 1985). Positive discount rates are commonly used for investment and management decisions, because of the uncertainty that future harvests will be available and because of alternative investment opportunities for capital. Clark (1985) stated a fundamental principle of renewable resource economics: ‘Higher discount rates normally imply lower levels of resource conservation by private resource owners, other things being equal’. Positive discount rates are inconsistent with the modern view of sustainability, which assumes that fish stocks will be valued in the future at least as much as they are now. In fact, some environmental groups have advocated the use of negative discount rates, which would assign higher value to future harvests (see Quinn & Deriso 1999, p. 447).
To illustrate the effect of discounting we calculated the sum of discounted yields from years 3 to 50 in 50-year simulations of the Ricker prototype model with different levels of fishing mortality. The first two years were omitted from the sum to remove the influence of the initial population sizes, which were the same for each value of fishing mortality. Simulations were run with high and low starting populations and with five different discount rates. For both starting population sizes, fishing mortality resulting in maximum discounted yield was higher with positive discounting (table 3), because most of the value is obtained in the early years and catch in the later years has smaller value. Positive discounting is inconsistent with any definition of sustainability because discounted yield would be maximized at a fishing mortality greater than Fext (0.37).
Table 3.
Fishing mortality, Fmdy, which produces maximum discounted yield over the time horizon for various values of the discount rate δ, for the classical Ricker prototype with low and high starting populations.
| δ | Fmdy | |
|---|---|---|
| low start | high start | |
| −0.8 | 0.17 | 0.19 |
| −0.4 | 0.17 | 0.19 |
| 0.0 | 0.15 | 0.22 |
| 0.4 | 0.51 | 0.43 |
| 0.8 | 0.72 | 0.46 |
With negative discounting, a slightly lower fishing mortality rate would maximize yield for the high starting population (table 3). The reason that we did not see bigger differences is that fishing mortality was fixed over the entire simulation time-frame. To obtain high yields in the future, one would need to allow the population to rebuild and then to fish it down again. However, a sustainable yield in the future would be the same as a sustainable yield today, so a negative discount rate may not be a useful concept. One could argue that the fish stock has a future value whether it is harvested or not and that the negative discount rate should be applied to stock abundance instead of yield. In this case, value would be maximized with no fishing, irrespective of the discount rate. A more useful approach is to explicitly recognize the trade-offs among conflicting objectives as discussed in § 6.
In conclusion, the modern view of sustainability is more focused on preservation of spawning biomass and production at all life stages than ever before. Many reference points are similar and usually lower than average natural mortality. Generally, assessment science has evolved to the point at which scientists know what levels of F are safe to preserve spawning biomass, avoid risk and allow harvest. Nevertheless, there are many situations in which the uncertainties in the information make it difficult to formulate prudent management decisions.
The objectives of scientific advice in the single-species setting have also become explicit and well defined. Quantitative control rules have been implemented for most US marine fisheries and the operational approach with simulation testing has been implemented around the world. Nevertheless, the choice of a particular reference point needs a process that can lead to scientific and political agreement(s) and must be adaptable to particular populations and situations. Our examination of discounted yield shows that the specified objective has major effects on the decision-making.
6. Post-modern sustainability
As mentioned in § 1, the single-species approach as implemented in the modern view of sustainability is under attack as being insufficient to guarantee sustainability in this post-modern period. In the future, it will be incumbent upon fishery management systems to explicitly consider other species requirements, ecosystem and habitat requirements, economic aspects, social/community aspects and institutional aspects, as itemized by Charles (2001).
One danger is that the achievements of the past with single-species approaches will be thrown aside and replaced with ‘warm and fuzzy’ goals that lack a solid scientific basis. Under post-modern sustainability, it has frequently been mentioned that the goals are to provide for healthy ecosystems, healthy fishing communities, the needs of future generations and diverse fish communities. Yet, at the current time, there are no unambiguous definitions of these goals and no accepted scientific approach for achieving them (Link 2000).
It is possible that the laudable goal of precaution that underlies post-modern sustainability will become an unscientific, political tool to unjustly deprive harvesters of their opportunity to earn a living. This could happen because the burden of proof under precautionary approaches shifts to the harvesters and regulators to show that regulations prevent harm or damage. Given the high degree of uncertainty and stochasticity in biological systems, it may not be possible to prove that an action will have no effect. Clearly, there is a need for balancing the burden of proof among competing sides (harvesters, protectors), but a fair approach has yet to be resolved.
Therefore, the challenges for post-modern sustainability are several. There is a need to specify value judgements of desired outcomes, which may or may not be scientifically based. Definitions of sustainability need to be made operational and useful, so that the achievement of sustainability can be assessed. Quantitative objectives corresponding to these judgements and definitions will then have to be developed. It is likely that some of the multiple objectives will be incompatible, so there will have to be some kind of process for making trade-offs.
In our view, the next steps that are needed to move into the era of post-modern sustainability include the following.
- Avoid incorrect characterizations of the single-species approach. The criticisms listed in § 1 are examples of this problem.
- Single-species models are biased because they do not incorporate the predation by other species. In truth, the natural mortality parameter in these models accounts directly for such removals, although it is difficult to measure and probably varies over time as predator levels change. The degree of bias may be substantial for some forage species with widely varying predator populations. It may be minimal for predators near the top of the trophic web.
- Assessment models are limited because of their emphasis on equilibrium solutions. As shown in this paper, an equilibrium point is an outcome of the necessary biological process of density dependence. Stochasticity can be included in population models so that the population continues to vary over time. Harvest strategies do not require a constant catch and can adapt to changes in the population, as described in the section on modern sustainability.
- Assessment models do not usually account for environmental changes, whether interannual or interdecadal. In reality, much work has gone into development of advanced spawner–recruit models that account for environmental changes (Quinn & Deriso 1999, ch. 3). As shown in this paper, stochasticity is readily incorporated into population models and has important consequences.
- A correct assessment approach requires that a multi-species framework be used. Current single-species assessment models are essentially accounting models that seek to integrate the sources of information about a population. As such, they often account for the main biological processes affecting a population and avoid restrictive assumptions about such processes. Enhancements in single-species models are desirable (see point (iii)) and further investigation of multi-species models is warranted (see point (iv)). The increased biological realism in multi-species models needs to be balanced against their additional complexities and data requirements (see NRC 1998).
- Harvest recommendations from single-species assessment do not consider the needs of other species. Multi-species considerations will not substitute for existing recommendations from single-species assessments. Instead, ecosystem considerations will supplement existing regulations to address additional concerns, such as bycatch, predator–prey demands and habitat alteration (Murawski 2000).
- Harvest recommendations from single-species assessment involve the deliberate fishing down of a population and therefore adversely change the ecosystem. In reality, modern reference points are developed to preserve spawning biomass of the population at its most productive level and to avoid threshold levels that may prevent the population from rebuilding quickly.
- The single-species approach is invalidated, because overfishing has occurred for at least a majority of the world’s fisheries. In most cases, it has not been the harvest recommendation that is at fault but rather the failure to implement it (Fogarty & Murawski 1998; Sissenwine & Mace 2001).
- Single-species approaches do not account for the indirect effects of fishing (e.g. bottom fishing on habitat quality). While the direct effects of bottom fishing on benthic communities have been well studied (NRC 2002), the indirect effects on fish production are much less well understood. Effort regulation is the cornerstone of fisheries management; stocks that are harvested at sustainable rates will have a smaller environmental ‘footprint’ than those that are overfished. Even so, certain vulnerable habitats require protections beyond that afforded by effort regulation.
Build on what is already known. The wealth of knowledge about fisheries management has increased enormously over the last 20 years. There have been major advances in single-species models and development of new economic theory. Some biological and economic models are among the most complex and state-of-the-art in the general fields of mathematics and statistics (Quinn 2003). The insights that have developed from their development have influenced the approaches used in other fields.
Encourage further single-species advancements. While modern assessment models are sufficiently complex for estimating population size, composition and related parameters over time, there is a need for improvement. Additional work is needed for approaches that allow population parameters such as natural mortality to vary over time (Fu & Quinn 2000). Process-oriented studies are needed to explain the role of biological, physical and environmental processes in the dynamics of populations. Further simulation testing of harvest strategies is needed for robustness to environmental change and measurement errors in data (Butterworth et al. 1997; Cooke 1999). The spatial dimension in stock assessments is often neglected, but the migratory nature of many populations should be incorporated (Quinn et al. 1990a). Models with discrete values of population size perform differently to continuous ones, leading to different population behaviours in regard to stability, cycling and chaos (Henson et al. 2001); further theoretical and laboratory investigation of population models in relation to habitat and discretization is needed. Further investigation of models that incorporate different sources of population variability need further attention. For example, models that combine chaotic behaviour from deterministic considerations and demographic variability from stochastic considerations are now being developed (Dennis et al. 2001). There is also need for further research on the effects of excessive harvesting on demographic parameters, such as egg quality related to fish size, fecundity and maturity related to size and age, and survival as a function of bycatch. These factors could induce depensatory or genetic changes in populations.
Encourage multi-species investigations. Multi-species models provide a first and attainable step toward placing single-species models in an ecosystem context. Predation is the main cause of natural mortality and its magnitude varies with the abundance of predator and prey populations. A suite of multi-species models exists for estimating the magnitude of predation mortality and evaluating its consequences for harvested populations (Hollowed et al. 2000). Biological reference points for prey species with high and variable levels of predation mortality should be conditioned on predator abundance (Collie & Gislason 2001). Keeping the multi-species models reasonably simple is desirable both to perform detailed mathematical analysis and to fully understand how the model’s structure influences its outcomes (Olson et al. 2005). Considerable work on estimating predation mortality rates in the 1980s and 1990s (MSVPA and other models) indicated that predation was considerably higher than the levels of natural mortality commonly assumed in classical single-species models. Especially in the North Sea, this led scientists to predict that regulations to increase the biomass of predator species would be counterproductive if they also increased the rates of cannibalism and predation mortality (Pope 1991). Revisionist interpretations that incorporate stock–recruitment relationships now indicate that the expected gains in recruitment would more than compensate for increased losses to predation (Collie et al. 2003). Therefore, consistent scientific advice based on multi-species models will necessarily require the correct specification of biological and ecological structure, which will remain a difficult challenge.
Develop tools for handling and visualizing multiple species and objectives. As fisheries models have become more complex, it has become correspondingly more difficult to visualize and to understand their output. Increased complexity is considered one of the main reasons that multi-species models are not more widely used. However, with modern graphical methods it is possible to present the results of complex models in a condensed form that can be readily understood by decision-makers (Wefering et al. 2000). For example, projections of a multi-fleet, multi-species model of the North Sea have been summarized with AMOEBA plots (Collie et al. 2003). Interactive versions of these visualization tools should be made available to decision-makers and stakeholders.
Provide checklists for measuring performance. The development of sustainability indicators is being actively pursued all over the world. A checklist for single-species assessments (NRC 1998, Appendix D) involves stock issues, data quality, model specification and harvest evaluation. A similar approach for objectives related to the ecosystem and economic and social considerations could be useful. Charles (2001) provides a starting point by listing several different indicators.
In conclusion, this presentation of single-species models and approaches shows that the definition and understanding of sustainability is intimately associated with biological processes of survival, growth and reproduction. At least some of these processes are necessarily density dependent, for a population to be regulated within the perimeters of its environment. Better understanding of both depensatory and compensatory processes is critical to understand the changes in a population. Biological processes must also necessarily be stochastic to explain the observed fluctuations of natural populations related to environmental and other factors that cannot yet be explained. Finally, these processes are dependent on other species and components of the ecosystem. For some populations, species interactions can be suitably handled through careful adjustment of the parameters of the single-species models; for others, a direct and explicit linkage is necessary to accurately measure sustainability (Collie & Gislason 2001). The challenge is ‘to integrate comprehensive models of key species of interest with comprehensive models of the biological, physical and chemical environment in which they live, while at the same time reducing the dimensions of complexity to manageable levels’ (Mace 2001).
As we have progressed from classical to neoclassical to modern to post-modern views of sustainability, our perceptions have become more risk-averse to better account for the risks involved. The evolution of sustainability will probably continue to involve insights from the single-species approach combined with new approaches based on additional goals and objectives.
Acknowledgments
This paper was originally presented at the World Conference on the Scientific and Technical Bases for the Sustainability of Fisheries, 26–30 November 2001, University of Miami, Rosenstiel School of Marine and Atmospheric Science, Center for Sustainable Fisheries, Miami, Florida. The authors thank Dr Nelson Ehrhardt for making this paper possible. This work was undertaken while T. J. Quinn II was on sabbatical at the University of Rhode Island. The authors thank the University of Rhode Island and the University of Alaska Fairbanks for support. Comments by Robert Mohn, Don Olson and an anonymous referee are greatly appreciated.
Glossary
- MSY
maximum sustainable yield
References
- Anderson J.T., Rose G.A. Offshore spawning and year-class strength of northern cod (2J3KL) during the fishing moratorium, 1994–1996. Can. J. Fish. Aquat. Sci. 2001;58:1386–1394. [Google Scholar]
- Beddington J., Cooke J.G. The potential yield of fish stocks. 1983. U.N. FAO Fisheries Technical Paper 242. [Google Scholar]
- Butterworth D.S., Cochrane K.L., Oliveira J.A.A. Management procedures: a better way to manage fisheries? The South African experience. Am. Fish. Soc. Symp. 1997;20:83–90. [Google Scholar]
- Charles A. Sustainable fishery systems. Blackwell Science; London: 2001. [Google Scholar]
- Clark C.W. Bioeconomic modeling and fisheries management. Wiley; New York: 1985. [Google Scholar]
- Clark, W. G. 1993 The effect of recruitment variability on the choice of a target level of spawning biomass per recruit. Univ. Alaska Sea Grant College Program, rep. no. 93-02, pp. 233–246.
- Collie J.S., Gislason H. Biological reference points in a multispecies context. Can. J. Fish. Aquat. Sci. 2001;58:2167–2176. [Google Scholar]
- Collie J.S., Peterman R.M., Walters C.J. Experimental harvest policies for a mixed-stock fishery: Fraser River sockeye salmon, Onchorhynchus nerka. Can. J. Fish. Aquat. Sci. 1990;47:145–155. [Google Scholar]
- Collie J.S., Gislason H., Vinther M. Using AMOEBAs to display multispecies, multifleet fisheries advice period. ICES J. Mar. Sci. 2003;60:709–720. [Google Scholar]
- Cooke J.G. Improvement of fishery-management advice through simulation testing of harvest algorithms. ICES J. Mar. Sci. 1999;56:797–810. [Google Scholar]
- Cordue P.L. A note on incorporating stochastic recruitment into deterministic age structured population models. ICES J. Mar. Sci. 2001;58:794–798. [Google Scholar]
- Dennis B., Desharnais R.A., Cushing J.M., Henson S.M., Costantino R.F. Estimating chaos and complex dynamics in an insect population. Ecol. Monogr. 2001;71:277–303. [Google Scholar]
- Deriso R.B. Relationship of fishing mortality to natural mortality and growth at the level of maximum sustainable yield. Can. J. Fish. Aquat. Sci. 1982;39:1054–1058. [Google Scholar]
- Francis R.I.C.C., Shotton R. ‘Risk’ in fisheries management: a review. Can. J. Fish. Aquat. Sci. 1997;54:1699–1715. [Google Scholar]
- Fogarty M.J., Murawski S.A. Large-scale disturbance and the structure of marine systems: fishery impacts on Georges Bank. Ecol. Applic. 1998;8:S6–S22. [Google Scholar]
- Fu C., Quinn II T.J. Estimability of natural mortality and other population parameters in a length-based model: Pandalus borealis in Kachemak Bay, AK. Can. J. Fish. Aquat. Sci. 2000;55:2420–2432. [Google Scholar]
- Henson S.M., Costantino R.F., Cushing J.M., Desharnais R.A., Dennis B., King A.A. Lattice effects observed in chaotic dynamics of experimental populations. Science. 2001;294:602–605. doi: 10.1126/science.1063358. [DOI] [PubMed] [Google Scholar]
- Hightower J.E., Grossman G.D. Optimal policies for rehabilitation of overexploited fish stocks using a deterministic model. Can. J. Fish. Aquat. Sci. 1987;44:803–810. [Google Scholar]
- Hilborn R., Walters C.J. Quantitative fisheries stock assessment: choice, dynamics, & uncertainty. Chapman & Hall; New York: 1992. [Google Scholar]
- Hollowed A.B., Bax N., Beamish R., Collie J.S., Fogarty M., Livingston P.A., Pope J., Rice J.C. Are multispecies models an improvement on single-species models for measuring fishing impacts on marine ecosystems? ICES J. Mar. Sci. 2000;57:707–719. [Google Scholar]
- Hutchings J.A. Collapse and recovery of marine fishes. Nature. 2000;406:882–885. doi: 10.1038/35022565. [DOI] [PubMed] [Google Scholar]
- International Council for the Exploration of the Sea (ICES) 1997 Report of the Study Group on the precautionary approach to fisheries management. ICES CM 1997/Assess.: 7.
- International Council for the Exploration of the Sea (ICES) 1998 Report of the Study Group on the precautionary approach to fisheries management. ICES CM 1998/ACFM: 10.
- Larkin P.A. An epitaph for the concept of maximum sustainable yield. Trans. Am. Fish. Soc. 1977;106:1–11. [Google Scholar]
- Lierman M., Hilborn R. Depensation in fish stocks: a hierarchic Bayesian meta-analysis. Can. J. Fish. Aquat. Sci. 1997;54:1976–1984. [Google Scholar]
- Link J. Fisheries management in an ecosystem context: what does it mean, what do we want, and can we do it? In Incorporating ecosystem considerations in stock assessments and management advice. In: Mace P.M., editor. 2000. pp. 5–11. NOAA Tech. Memo. NMFS-F/SPO-46. [Google Scholar]
- Mace P.M. Relationships between common biological reference points used as thresholds and targets of fisheries management strategies. Can. J. Fish. Aquat. Sci. 1994;51:110–122. [Google Scholar]
- Mace P.M. A new role for MSY in single-species and ecosystem approaches to fisheries stock assessment and management. Fish and Fisheries. 2001;2:2–32. [Google Scholar]
- Mace P.M., Sissenwine M.P. How much spawning per recruit is enough? Can. Spec. Publ. Fish. Aquat. Sci. 1993;120:101–117. [Google Scholar]
- Murawski S.A. Definitions of overfishing from an ecosystem perspective. ICES J. Mar. Sci. 2000;57:649–658. [Google Scholar]
- Myers R.A., Barrowman N.J., Hutchings J.A., Rosenberg A.A. Population dynamics at low population levels. Science. 1995;269:1106–1108. doi: 10.1126/science.269.5227.1106. [DOI] [PubMed] [Google Scholar]
- National Research Council (NRC) Improving fish stock assessments. National Academy Press; Washington, DC: 1998. [Google Scholar]
- National Research Council (NRC) Sustaining marine fisheries. National Academy Press; Washington, DC: 1999. [Google Scholar]
- National Research Council (NRC) Effects of trawling and dredging on seafloor habitat. National Academy Press; Washington, DC: 2002. [Google Scholar]
- Olson, D. B., Cosner, C., Cantrell, S. & Hastings, A. 2005 Persistence of fish populations in time and space as a key to sustainable fisheries. Bull. Mar. Sci (In the press.)
- Pope J.G. The ICES Multispecies Assessment Working Group: evolution, insights, and future problems. ICES Mar. Sci. Symp. 1991;193:22–33. [Google Scholar]
- Punt A.E., Hilborn R. Fisheries stock assessment and decision analysis: a review of the Bayesian approach. Rev. Fish Biol. Fish. 1997;7:35–63. [Google Scholar]
- Quinn T.J., II Ruminations on the development and future of population dynamics models in fisheries. Natural Resource Model. 2003;16:341–392. [Google Scholar]
- Quinn T.J., II, Deriso R.B. Quantitative fish dynamics. Oxford University Press; New York: 1999. [Google Scholar]
- Quinn T.J., II, Deriso R.B., Neal P.R. Migratory catch age analysis. Can. J. Fish. Aquat. Sci. 1990a;47:2315–2327. [Google Scholar]
- Quinn T.J., II, Fagen R., Zheng J. Threshold management policies for exploited populations. Can. J. Fish. Aquat. Sci. 1990b;47:2016–2029. [Google Scholar]
- Sissenwine M.P., Mace P.M. Governance for responsible fisheries: an ecosystem approach. In: Sinclair M., Valdimarsson G., editors. Responsible fisheries in the marine ecosystem. CABI Publishing; Wallingford, UK: 2001. pp. 363–390. [Google Scholar]
- Sissenwine M.P., Shepherd J.G. An alternate perspective on recruitment overfishing and biological reference points. Can. J. Fish. Aquat. Sci. 1987;44:913–918. [Google Scholar]
- Thompson G.G. A proposal for a threshold stock size and maximum fishing mortality rate. Can. Spec. Publ. Fish. Aquat. Sci. 1993;120:303–320. [Google Scholar]
- Wefering F.M., Danielson L.E., White N.M. Using the AMOEBA approach to measure progress toward ecosystem sustainability within a shellfish restoration project in North Carolina. Ecol. Model. 2000;130:157–166. [Google Scholar]
- Zheng J., Murphy M.C., Kruse G.H. A length-based population model and stock-recruitment relationships for red king crab, Paralithodes camtschaticus, in Bristol Bay, Alaska. Can. J. Fish. Aquat. Sci. 1995;52:1229–1246. [Google Scholar]


