Abstract
Commonly found in raw oysters, Vibrio vulnificus poses a serious health threat to immunocompromised individuals and those with serum iron overload, with a fatality rate of approximately 50%. An essential virulence factor is its capsular polysaccharide (CPS), which is responsible for a significant increase in virulence compared to nonencapsulated strains. However, this bacterium is known to vary the amount of CPS expressed on the cell surface, converting from an opaque (Op) colony phenotype to a translucent (Tr) colony phenotype. In this study, the consistency of CPS conversion was determined for four strains of V. vulnificus. Environmental conditions including variations in aeration, temperature, incubation time, oxidative stress, and media (heart infusion or modified maintenance medium agar) were investigated to determine their influence on CPS conversion. All conditions, with the exception of variations in media and oxidative stress, significantly affected the conversion of the population, with high ranges of CPS expression found even within cells from a single colony. The global quorum-sensing regulators RpoS and AI-2 were also examined. While RpoS was found to significantly mediate phenotypic conversion, quorum sensing was not. Finally, 12 strains that comprise the recently found clinical (C) and environmental (E) genotypes of V. vulnificus were examined to determine their rates of population conversion. C-genotype strains, which are most often associated with infection, had a significantly lower rate of population conversion from Op to Tr phenotypes than did E-genotype strains (ca. 38% versus ca. 14%, respectively). Biofilm capabilities of these strains, however, were not correlated with increased population conversion.
Vibrio vulnificus is a gram-negative, halophilic bacterium that is typically isolated from oysters and estuarine environments and is responsible for 95% of all seafood-borne fatalities in the United States (23). V. vulnificus can induce various syndromes depending on the mode of transmission, and mortality rates differ with regard to the route of infection. The mortality rate for cases of primary septicemia following ingestion of raw oysters is approximately 50%, and individuals who are immunocompromised, diabetic, or alcoholic or who suffer from hepatic disorders are at greater risk (23). V. vulnificus can also cause a 25% mortality rate in patients with wound infections (22). In all, V. vulnificus carries the highest case fatality rate of any food-borne pathogen (24).
While the pathogenicity of V. vulnificus has been extensively studied, the essential virulence factors have not been fully elucidated. However, several virulence factors have been suggested for this bacterium (16, 18, 29, 34, 38, 39), including lipopolysaccharide, siderophores, flagella, and the presence of capsular polysaccharide (CPS). Of these factors, virulence is definitively related to CPS expression, with 50% lethal dose values reported to range from as few as a single cell for encapsulated cells to 6.5 × 10⁷ cells for nonencapsulated phenotypes (30, 34). When encapsulated, the colony morphology is opaque (Op), while the translucent (Tr) colony morphology has decreased CPS and attenuated virulence (29, 38). It has been reported that V. vulnificus exhibits phase variation from opaque to translucent colony morphology (3, 4), and a similar opaque-translucent phase variation has been described for Vibrio parahaemolyticus (5). A rugose variant of V. vulnificus with a crinkled appearance (7) that is highly associated with biofilm formation has also been reported.
Phase variation is linked with virulence in many different bacterial species (35), and phenotypic variations of capsule, fimbriae, flagella, and surface-exposed antigens are known to occur. Mechanisms for these changes can be through genetic regulation, such as short sequence repeats; site-specific recombination; epigenetic regulation, such as pyelonephritis-associated pilus phase variation; or signal regulation by sigma factors and environmental triggers (35, 37).
Although capsule phase variation is well studied in many bacteria, the mechanism of phase variation of CPS in V. vulnificus is relatively unknown. To date, four genetic regions that are essential to CPS expression in V. vulnificus have been identified (30, 38). The regions include genes that encode transport proteins as well as proteins involved in capsule synthesis and polymerization and several genes of unknown function. Through transposon mutagenesis, disruptions in these regions result in decreased pathogenesis by a magnitude of 108 (30).
The group 1 capsular polysaccharide operon of V. vulnificus has been shown through transposon mutagenesis to bear a significant role in nonreversible phenotypic variation of CPS expression. Intergenic repetitive DNA elements surround wzb, a gene encoding a cognate phosphatase involved in the assembly of CPS, which allows the deletion of wzb, resulting in translucent phenotypes (4). Irreversible translucent colonies occur with the deletion of wzb, while reversible translucent colonies appear with the down-regulation, not the deletion, of wzb. Reversible, translucent-phase variants still possessing wzb are named TR1. Irreversible translucent variants, which are defined by the absence of wzb (TR2) and the absence of multiple group 1 capsular polysaccharide operon genes in addition to wzb (TR3), have also been observed (4). In situ experiments show the down-regulation of wzb and wza in the environment, but the environmental stimulus and genetic mechanism of the down-regulation are unknown (31).
Recent studies have shown that V. vulnificus can be separated into two major genotypes, which could account for possible differences in CPS expression. Nilsson et al. found that these strains fall into two different groups, each harboring a 17-nucleotide difference within the 16S rRNA gene (21). Likewise, the gene encoding the V. vulnificus hemolysin has sequence variations that can also be used to divide this species into the same two groups (27, 28). Based on previous studies by Nilsson et al. (21), one group appears to be composed largely of environmental strains, while the other is composed primarily of strains isolated from clinical cases. From a previous study in our laboratory using randomly amplified polymorphic DNA-PCR analysis, we generated an amplicon from V. vulnificus that was highly associated with clinical strains (36). This amplicon contained a noncoding region as well as part of the VV0401 gene, which has an unknown function. The numerous base differences allowed the strains of V. vulnificus examined to be easily and rapidly differentiated (27) into two genotypes, which fell into the same lineage as observed by 16S rRNA gene analysis (21). We found that one sequence variation is highly associated with environmental isolates (90%), while the other sequence variation is associated with clinical isolates (93%). These variations were named C type, which correlated with strains isolated from clinical cases, and E type, which correlated with strains isolated from environmental cases (27).
In the present study, we investigated the role of environmental conditions in the conversion of V. vulnificus cells from the opaque phenotype to the translucent phenotype. Effects of temperature, aeration, culture medium, and time of incubation were examined, as were as the possible roles of the stress sigma factor RpoS, AI-2 quorum sensing, and oxidative stress. Finally, C-type and E-type strains were examined to determine whether differences between these strains might account for the different rates in opaque-to-translucent colony morphotype conversion that we observed in V. vulnificus.
MATERIALS AND METHODS
Bacterial strains and growth conditions.
A total of 12 strains of V. vulnificus were used for this study, 6 of which were E-type strains and 6 of which were C-type strains (27). In all our studies, the opaque form was employed as the inoculum. The strains were kept as freezer stocks at −80°C in Luria-Bertani (LB) broth (10 g tryptone, 5 g yeast extract, 10 g NaCl) or heart infusion (HI) broth (Difco), with 20% (vol/vol) glycerol. Strains were grown in HI broth or on HI plates at 22°C for 24 h. Liquid cultures were grown with aeration.
Wild-type strain C7184K was compared to isogenic mutants including AH1 (rpoS mutant) (10), JDO1 (luxS mutant) (2), and K853 (oxyR mutant) (15). Cells were grown as described above with the addition of chloramphenicol (2 μg/ml) to HI plates and to cultures grown overnight from freezer stocks. Media for K853 also contained sodium pyruvate (0.4 mg/ml), which was added to scavenge oxygen radicals to which this strain is highly susceptible.
Determination of population conversion.
Population conversion from the opaque to the translucent phenotype was determined by growing cultures from freezer stocks overnight in HI broth, and fresh broths were then inoculated at a 10% (vol/vol) dilution in modified maintenance (MM) medium (29), which consisted of 10 g proteose peptone 3, 10 g NaCl (pH 7.0), and 20 mg/liter of cysteine. Cultures were then subjected to various culture conditions (incubation time, aeration, and temperature) for a set length of time. All conditions were compared to those of cultures grown statically in MM broth at 37°C for 72 h. Diluting and counting of total opaque and translucent colonies on HI agar after 24 h at 22°C determined initial cell densities and morphologies. Final population phenotypes were determined by counting opaque and translucent colonies on HI agar after 24 h at 22°C. All tests were performed on a total of three separate cultures grown overnight with five subsets per culture grown overnight (n = 15 per strain). Population conversion was defined as the percentage of the translucent population at the initial time point compared with the percentage of the translucent population at the final time point. Results were quantified by subtracting the percentage of the translucent population at time zero from the final percentage of the translucent population. Population conversion for isogenic mutants was compared with that of the wild-type strain to determine the effects of quorum sensing, RpoS, and OxyR on the conversion from opaque to translucent phenotypes.
Oxidative stress studies.
Based on a previous study investigating the role of reactive oxygen species in the culturability of V. vulnificus (15), hydrogen peroxide (0.2 mM) was added to the MM broth prior to conducting conversion assays. Every 24 h, an additional 0.2 mM was added to the medium. The same methodology was applied in studies to examine ascorbic acid (5 mM) as an antioxidant. Cells were removed after 72 h of repeated peroxide or ascorbate treatment and examined for population conversion. Results were compared with translucent percentages counted before oxidative stress treatment.
Biofilm assay.
Cultures were grown overnight and inoculated into a sterile 96-well polycarbonate plate in order to determine biofilm-forming potential, as described previously by O'Toole and Roberto (25). Briefly, cells were allowed to attach for 72 h. The absorbance at 595 nm was then measured as an indication of the number of cells present in the biofilm, after which unattached cells were carefully pipetted off and washed with phosphate-buffered saline. Following staining with crystal violet, ethanol was added to elute the stain from the cells. The absorbance at 450 nm was measured as an indication of the number of cells present in the biofilm. Each assay was performed in duplicate.
Spent-medium studies.
C7184K, JDO1, and AH1 were grown overnight (with antibiotics when appropriate), and capsule population conversion assays without antibiotics were conducted as described above. After 72 h, the cultures were centrifuged, and supernatants were decanted and filtered through a sterile 0.22-μm filter. This sterile spent medium was then used as the growth medium into which a 10% volume of bacterial culture was inoculated. Cells were then incubated statically for 72 h and then plated as described above to allow any colony phenotype differences to be determined.
Statistical analysis.
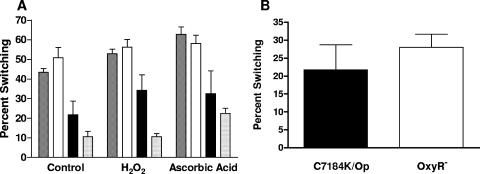
Statistical analysis was dependent upon individual tests performed. All figures show means and standard errors of the means, except for Fig. 4A, which shows means and standard deviations.
FIG. 4.
Population conversion and oxidative stress. (A) Population conversion studies were performed on JY1305 (▩), Env1 (□), C7184K (▪), and CMCP6 ( ) under oxidative stress (addition of H2O2) and in the presence of an antioxidant (ascorbic acid) with comparisons to control cells not exposed to oxidative stress. A two-way ANOVA, followed by a Bonferroni posttest, was used for statistical analysis, with results showing no significant interaction. (B) Oxidative stress was further investigated by comparing the parent strain, C7184K (black), to an oxyR mutant K853 derivative (white) under conditions described in the legend of Fig. 1. Student's t test was used to analyze data resulting in no statistical difference between the two strains.
RESULTS
Population conversion by different strains of V. vulnificus.
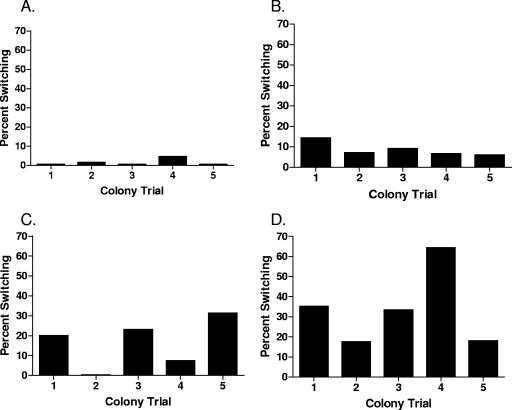
To investigate opaque-to-translucent conversion rates between V. vulnificus strains, five colonies were isolated from HI plates from each of four strains, C7184K, CMCP6, JY1305, and Env1, and subjected to the population conversion assay. Cells from different colonies taken from each of the four strains demonstrated great variation in the rate of population conversion, ranging from <1% to >60% between strains and from <20% to >60% in individual colonies taken from a single strain (Fig. 1).
FIG. 1.
Population conversion in multiple colony isolates from a single strain. Conversion assays were performed using five separate colonies taken from each of four V. vulnificus strains: (A) C7184K, (B) CMCP6, (C) Env1, and (D) JY1305. All assays were conducted in MM medium without aeration for 72 h at 37°C.
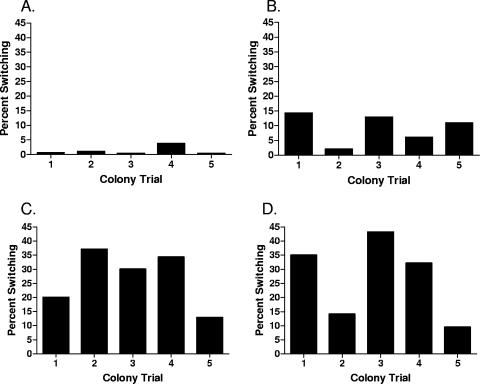
In a second study, five individual assays were performed on cells taken from single colonies of each of the same four strains grown overnight to determine the consistency of population conversion within individual cells. We observed that cells from a single colony could demonstrate severalfold differences in population conversion (Fig. 2). To minimize the effect of variation, assays were performed using three individual cultures grown overnight with five experimental subsets of each culture, for a total of 15 individual assays performed for each strain under investigation.
FIG. 2.
Population conversion in cells taken from single colonies from individual strains. Conversion assays were performed on multiple inocula taken from single colonies of (A) C7184K, (B) CMCP6, (C) Env1, and (D) JY1305 using the conditions described in the legend of Fig. 1.
Effects of aeration on population conversion.
We wished to determine whether environmental conditions influenced a bacterial culture with an opaque phenotype to undergo conversion to a predominately translucent population. As an initial test of this, an environmental strain of V. vulnificus, Env1, was tested in the population conversion assay with and without aeration. Under these conditions, Env1 demonstrated a highly significant (P < 0.05) increase in conversion to the translucent phenotype (average of 50.9% ± 19.8%) under static conditions compared with aerated cultures (average of 29.7% ± 19.1%). This result indicated that environmental conditions can play a role in population conversion and that aeration (or the lack thereof) was important in the change.
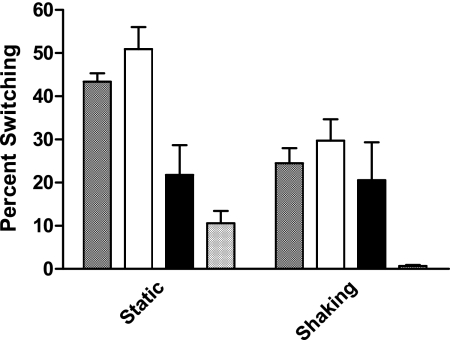
To determine whether this result was strain specific, two C-type strains, C7184K and CMCP6, and two E-type strains, Env1 and JY1305, were examined under aerated and static conditions. As shown in Fig. 3, a significant increase (P < 0.002) in conversion from the opaque phenotype to the translucent phenotype under static conditions was observed for three strains, JY1305, Env1, and CMCP6 (43.4% ± 7.4%, 50.9% ± 19.8%, and 10.6% ± 11.0%, respectively) compared to the same cultures incubated overnight with aeration (24.5% ± 13.7%, 29.7% ± 19.1%, and 0.007% ± 0.009%, respectively). The effects of aeration on C7184K (21.6% ± 25.9%) were not significantly different from that on statically grown cultures (20.6% ± 34.0%), but this strain demonstrated values ranging from 0.1% to 88.9% in both aerated and statically grown cultures.
FIG. 3.
Population conversion of strains under aeration and nonaeration conditions. Population conversion studies (n = 15) were performed on JY1305, Env1, C7184K, and CMCP6 without (□) and with (▪) aeration in MM medium for 72 h at 37°C. Student's t test was used for statistical analysis.
Oxidative stress and population conversion.
Since aeration influenced phenotypic population conversion in the majority of strains tested, we examined whether this result might be due to a cell's reaction to oxidative stress. To this end, hydrogen peroxide was added to the population conversion assay to cause additional oxidative stress, while ascorbic acid was added in other assays as an antioxidant. Neither agent significantly affected population conversion (Fig. 4A). As an additional test of this possibility, a catalase-deficient mutant of C7184K, K853, was examined. Again, no difference was found between the catalase mutant (28.0% ± 14.0%) and the wild-type strain (21.8% ± 25.8%) (Fig. 4B), further supporting our conclusion that oxidative stress does not play a major role in the ability of a strain to undergo population conversion. The final populations of strains AH1, JDO1, and K853 exhibited a 3-log decrease in survival rates with the addition of ascorbic acid, but no decrease was observed in any of the wild-type strains.
Biofilm and population conversion.
The translucent phenotype in V. vulnificus is associated with an increased ability to form biofilms (11), so we examined 12 strains to determine whether higher conversion rates were also associated with increased biofilm development. Results were then compared with the population conversion from opaque to translucent phenotypes of the strains. A mutant of rpoS was used as a negative control, as rpoS has been shown to have decreased motility and biofilm development (1, 10). No correlation between biofilm formation and population conversion was found with all average biofilm values in the range of 0.17 to 1.2, except for two C-type strains (YJ016 at 0.0926 and MO6 at 0.0780). There was no statistical difference between any of the strains tested, suggesting that biofilm formation does not induce phenotypic conversion of the population. However, E-type strains had a slightly higher extent of biofilm formation (0.1528 ± 0.0255) than C-type strains (0.1345 ± 0.0362).
Quorum sensing and population conversion.
Since quorum sensing has been shown to determine transcriptional activation for up to 10% of the Escherichia coli genome (32, 33) and to be a regulatory factor in vibrios (14, 17, 20), this regulatory mechanism was examined for its possible effects in increasing phenotypic population conversion. To study this, a luxS mutant, JDO1, was used in the conversion population assay for comparison to the parent strain, C7184K. Although JDO1 exhibited a lowered level of population conversion (12.7% ± 6.2%), it was not found to be statistically significant (P = 0.1316) compared to the wild-type strain (21.8% ± 25.9%). Population conversion was then determined using spent media from C7184 and JDO1 for strains C7184, CMCP6, JY1305, and Env1. Population conversion from the opaque phenotype to the translucent phenotype did not increase when strains were exposed to spent media (data not shown). Likewise, conversion for JDO1 did not differ when in the presence of wild-type spent media (2.1% ± 0.3%) compared to JDO1 spent media (3.9% ± 2.0%).
Environmental conditions and population conversion.
To determine what environmental conditions other than aeration might influence the rate of population conversion to a translucent phenotype, a variety of factors were tested in the population conversion assay. A previous report indicated that conversion rates were higher in MM medium than in HI medium (3), so MM medium and HI medium were tested to determine population conversion variations. When MM medium and HI medium were compared, no statistical difference between the rates of population conversion was found using a one-way analysis of variance (ANOVA) (P = 0.1488) for each of the four individual C-type and E-type strains tested.
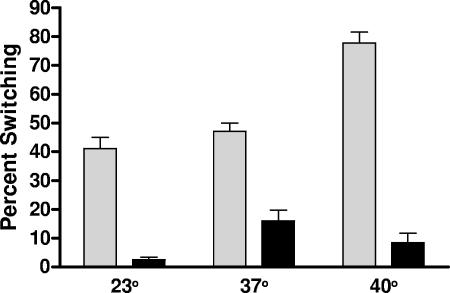
As shown in Fig. 5, major differences in conversion rates between C- and E-type strains were seen at all temperatures examined (23, 37, and 40°C). Furthermore, in the 15 different repeats, an increase in temperature from 23 to 40°C was found to significantly (P < 0.0001) increase population conversion in the two E-type strains. In contrast, the two C-type strains showed a conversion increase only between 23°C and 37°C, with a decrease in population conversion occurring as the temperature was increased from 37°C to 40°C (Fig. 5). The difference in population conversion as temperature increased indicates additional differences in C-type and E-type strains with regard to their ability to undergo capsule conversion.
FIG. 5.
Effects of temperature on the conversion of E-type and C-type strains. Two E-type strains, JY1305 and Env1 (shaded bars), and two C-type strains, C7184K and CMCP6 (solid bars), were compared for population conversion, with each strain having 15 replicate assays performed. Increasing temperature was used under conditions described in the legend of Fig. 1. Statistical analysis was performed by using two-way ANOVA followed by a Bonferroni posttest. Strains, temperature, and their interactions were all found to be statistically significant (P < 0.0001 for all).
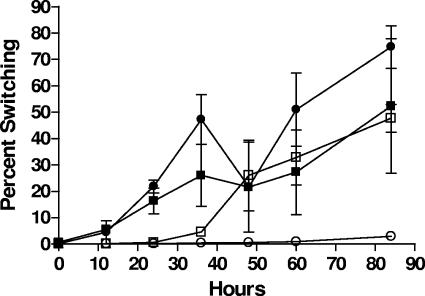
When the time required for population conversion was monitored (Fig. 6), translucent populations were observed in E-type strains at ca. 12 h, with population changes becoming stable after ca. 60 h. For C-type strains, translucent populations were not detected until after 24 h.
FIG. 6.
Population conversion over time. The time required for population conversion to occur was monitored over an 85-h period in strains C7184 (○), CMCP6 (□), Env1 (•), and JY1305 (▪). Experiments were performed in duplicate and were repeated (n = 4).
Role of RpoS in population conversion.
Since most of the conditions studied would be expected to induce stress in the bacterial cells, we examined the possible role of RpoS (8) in the phenotypic conversion of the population. To do this, we examined an rpoS mutant, AH1, and the parent strain, C7184K, with different temperatures, aeration, nutrient levels, and oxidative stress conditions. Conversion rates were consistently higher for AH1 (48.7% ± 10.8%) compared to the wild type (25.9% ± 25.9%), and a highly significant difference (P < 0.0001) in population conversion was observed overall between the two strains. Spent media from AH1 and C7184K were used in the conversion assays to determine if the presence of exoenzymes controlled by RpoS could account for an increase in population conversion. Statistically, there was no difference in population conversion compared to spent-medium studies from AHI (5.6% ± 0.8%) with wild-type spent medium (6.4% ± 2.8%), suggesting that downstream RpoS products are not significantly involved in increasing translucent population conversion in V. vulnificus.
Comparison of population conversion and C- and E-type strains.
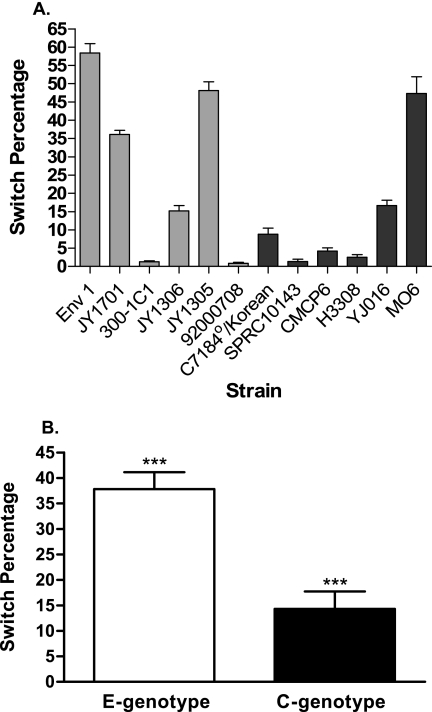
To further examine the ability of C and E strains to undergo population conversion from the opaque to the translucent phenotype, 12 strains (six C type and six E type) were tested using our standard assay (MM broth at 37°C for 72 h under static conditions). While major differences in switch rates were again observed between strains, whether of the C or E genotype (Fig. 7A), three of the six E-genotype strains switched at relatively high (>35%) rates, while only one of six C-genotype strains had a high conversion rate. Indeed, when averaged, the E-type strains demonstrated a statistically significant (P = 0.0003) increase in population conversion to the translucent phenotype (an average of 37.8%) compared to C-type strains (an average of 14.3%). This suggests that there may be a genetic difference that exists between the C-type and E-type strains that allows C types to better resist population conversion.
FIG. 7.
Population conversion of C-type and E-type strains. (A) Individual conversion of six C-type and six E-type strains. Each strain was assayed 15 times in MM medium for 72 h at 37°C under static conditions. E-type strains (░⃞) are differentiated from C-type strains (▪). (B) Averages of the six C-type and six E-type strains. Shown are means and standard errors of the means.
DISCUSSION
Phase variation refers to a reversible expression phase where genetic variability is heritable (35). One characteristic of such variation is that the frequency of reversion in phase expression exceeds that of random mutation (35). In our study, strains of V. vulnificus were found to have a wide range of population conversion rates from opaque to translucent morphologies (<1% to >70%). Such variation was present even within an individual strain (i.e., when multiple colonies of a single strain were examined for population conversion) (Fig. 1). More surprisingly, even cells within a single colony of a strain exhibited wide variation (Fig. 2). Because of this variation found within a single colony, it became evident that multiple tube assays were needed to determine conversion rates between strains.
Since single-colony isolates are considered genotypically identical, the range of population conversion rates suggests that these differences are a consequence of when the first phase variation incident occurred in the population; that is, the earlier the incidence of phase variation from the opaque to the translucent phenotype occurs, the larger the resulting population conversion. Our data are indicative of a genetic mechanism for phase variation as defined previously by Van der Woude and Bäumler (35). However, no reversion from the translucent phenotype to the opaque phenotype was observed in our studies, suggesting that this phase variation is irreversible. This is explained by recent research by Chatzidaki-Livanis et al., who demonstrated a genetic mechanism for irreversible phase variation in V. vulnificus (4).
The ability of V. vulnificus to evade the host immune system and inflict the extreme tissue damage often seen in V. vulnificus infections is, in part, a result of whether the cell possesses CPS on its cell surface (29). To find conditions that affect capsule production and therefore the pathogenicity of V. vulnificus, we examined whether time of incubation, temperature, aeration, oxidative stress, quorum sensing, the presence of RpoS, nutrient levels, and spent media could increase the population conversion from an opaque to a translucent phenotype.
We made several observations regarding capsule expression in V. vulnificus when starting with opaque cultures. First, in the conversion assay, translucent cells did not begin appearing in detectable numbers until after 12 h for E-type strains and after 24 h for C-type strains. Once appearing, conversion rates continued to increase at a steady but gradual rate until about 50 h. Beyond that time, translucent population numbers tended to stabilize. This suggests that some of the environmental conditions present in our assay might actually demonstrate selectivity for translucent or opaque survival instead of an increase in the rate of phase variation. This could also account for the wide variability seen in repetitions of the conversion assay and would suggest that the undetectable translucent cells at the beginning of the assay could be outcompeting opaque cells over time. Grau et al. previously reported better survival of a rugose variant compared to opaque and translucent derivatives of V. vulnificus dependent on temperature (7), so perhaps the conditions of the conversion assay impart a selective advantage to a given phenotype instead of a phenotypic conversion of a single cell from an opaque morphology to a translucent morphology. Also, the death phase for bacterial cultures begins 2 to 3 days after inoculation (6), so if the opaque population begins dying at that time, it would result in the appearance of an increased percentage of the translucent population. Studies are currently under way to address this point.
We found that aeration plays a major role in decreasing the appearance of translucent populations. Although previous research indicates that Pseudomonas aeruginosa develops a clear polysaccharide capsule in response to oxidative stress (13), our data suggested that this is not a factor in the population conversion observed in V. vulnificus under aerated conditions. Since previous research on V. vulnificus indicated that translucent phenotypes have enhanced attachment and biofilm capabilities (12), aeration might have been expected to result in a decrease of attachment and biofilm development. However, biofilm formation, a putative virulence factor (12, 13), was examined and found not to play a role in the decrease of the translucent phenotype under aeration. Although translucent cultures are better able to form a biofilm, we did not examine pure translucent cultures compared to opaque cultures. Starting with all opaque cultures could account for the lack of correlation between biofilm formation and phase variation observed in this experiment. Unlike previous research reported (3, 11), population conversion was not dependent on the nutrient content of the media, although cells grew at comparable rates. This suggests that the change in population conversion may not be dependent on different metabolic functions.
The exact cause for the decrease in the translucent morphotype with aeration suggests the involvement of a different mechanism. Interestingly, quorum sensing, another factor in biofilm development (9), was not found to statistically affect population conversion. This was somewhat surprising, since quorum sensing has been implicated in the transcriptional activation of many putative virulence genes (32, 33), including in V. vulnificus (14), as well as CPS production in V. parahaemolyticus (5, 19). Likewise, RpoS was found to be involved in significant population conversion under the conditions used in our study, which aligns itself with research demonstrating the involvement of RpoS in other stress responses by V. vulnificus (10, 26).
In this study, the difference in the ability to resist phenotypic conversion was found to be highly dependent on the genotype of V. vulnificus, with C-type strains being more able to resist the population shift (i.e., to remain encapsulated) than E-type strains. This has great public health implications, since C-type strains are more often associated with clinical cases than are E-type strains (21, 27) and are better able to resist decreasing CPS expression at temperatures important to human infection. Furthermore, our data suggest that C-type strains are better able to resist population conversion following temperature increases (as would occur upon passing from the environment to the human host) than are E-type strains. A further understanding of these findings may be beneficial in understanding phase variation and population conversion in V. vulnificus as well as for possible public health considerations.
Acknowledgments
These studies were funded by a grant (2002-1240-42) from the North Carolina Sea Grant College Program. The Graduate School of UNC Charlotte is gratefully acknowledged for providing printing funding.
We thank Jane Michalski for her valuable comments in the preparation of the manuscript.
Footnotes
Published ahead of print on 25 August 2006.
REFERENCES
- 1.Adams, J. L., and R. J. McLean. 1999. Impact of rpoS deletion on Escherichia coli biofilms. Appl. Environ. Microbiol. 65:4285-4287. [DOI] [PMC free article] [PubMed] [Google Scholar]
- 2.Beam, D. 2004. Quorum sensing and pathogenesis in Vibrio vulnificus. M.S. thesis. University of North Carolina at Charlotte, Charlotte.
- 3.Chatzidaki, M. A., and A. C. Wright. 2003. Group 1-like capsular polysaccharide operon and phase variation in Vibrio vulnificus, abstr. B295, p. 86. Abstr. 103rd Gen. Meet. Am. Soc. Microbiol. 2003. ASM Press, Washington, D.C.
- 4.Chatzidaki-Livanis, M., M. K. Jones, and A. C. Wright. 2006. Genetic variation in the Vibrio vulnificus group 1 capsular polysaccharide operon. J. Bacteriol. 188:1987-1998. [DOI] [PMC free article] [PubMed] [Google Scholar]
- 5.Enos-Berlage, J. L., and L. L. McCarter. 2000. Relation of capsular polysaccharide production and colonial cell organization to colony morphology in Vibrio parahaemolyticus. J. Bacteriol. 182:5513-5520. [DOI] [PMC free article] [PubMed] [Google Scholar]
- 6.Finkel, S. E. 2006. Long-term survival during stationary phase: evolution and the GASP phenotype. Nat. Rev. Microbiol. 4:113-120. [DOI] [PubMed] [Google Scholar]
- 7.Grau, B. L., M. C. Henk, and G. S. Pettis. 2005. High-frequency phase variation of Vibrio vulnificus 1003: isolation and characterization of a rugose phenotypic variant. J. Bacteriol. 187:2519-2525. [DOI] [PMC free article] [PubMed] [Google Scholar]
- 8.Hengge-Aronis, R. 2002. Signal transduction and regulatory mechanisms involved in control of the σS (RpoS) subunit of RNA polymerase. Microbiol. Mol. Biol. Rev. 66:373-395. [DOI] [PMC free article] [PubMed] [Google Scholar]
- 9.Huber, B., K. Riedel, M. Hentzer, A. Heydorn, A. Gotschlich, M. Givskov, S. Molin, and L. Eberl. 2001. The cep quorum-sensing system of Burkholderia cepacia H111 controls biofilm formation and swarming motility. Microbiology 147:2517-2528. [DOI] [PubMed] [Google Scholar]
- 10.Hülsmann, A., T. M. Rosche, I.-S. Kong, H. M. Hassan, D. M. Beam, and J. D. Oliver. 2003. RpoS-dependent stress response and exoenzyme production in Vibrio vulnificus. Appl. Environ. Microbiol. 69:6114-6120. [DOI] [PMC free article] [PubMed] [Google Scholar]
- 11.Jones, M. K., M. A. Chatzidaki, and A. C. Wright. 2003. Induction of high-frequency phase variation of capsular polysaccharide in Vibrio vulnificus, abstr. B165, p. 63. Abstr. 103rd Gen. Meet. Am. Soc. Microbiol. 2003. ASM Press, Washington, D.C.
- 12.Joseph, L. A., and A. C. Wright. 2004. Expression of Vibrio vulnificus capsular polysaccharide inhibits biofilm formation. J. Bacteriol. 186:889-893. [DOI] [PMC free article] [PubMed] [Google Scholar]
- 13.Kim, E., W. Sabra, and A. Zeng. 2003. Iron deficiency leads to inhibition of oxygen transfer and enhanced formation of virulence factors in cultures of Pseudomonas aeruginosa PAO1. Microbiology 149:2627-2634. [DOI] [PubMed] [Google Scholar]
- 14.Kim, S. Y., S. E. Lee, Y. R. Kim, C. M. Kim, P. Y. Ryu, H. E. Choy, S. S. Chung, and J. H. Rhee. 2003. Regulation of Vibrio vulnificus virulence by the LuxS quorum-sensing system. Mol. Microbiol. 48:1647-1664. [DOI] [PubMed] [Google Scholar]
- 15.Kong, I.-S., T. C. Bates, A. Hülsmann, H. Hassan, and J. D. Oliver. 2004. Role of catalase and oxyR in the viable but nonculturable state of Vibrio vulnificus. FEMS Microbiol. Ecol. 50:133-142. [DOI] [PubMed] [Google Scholar]
- 16.Lee, J.-H., J. B. Rho, K.-J. Park, C. B. Kim, Y.-S. Han, S.-H. Choi, K. H. Lee, and S.-J. Park. 2004. Role of flagellum and motility in pathogenesis of Vibrio vulnificus. Infect. Immun. 72:4905-4910. [DOI] [PMC free article] [PubMed] [Google Scholar]
- 17.Lilley, B. N., and B. L. Bassler. 2000. Regulation of quorum sensing in Vibrio harveyi by LuxO and Sigma-54. Mol. Microbiol. 36:940-954. [DOI] [PubMed] [Google Scholar]
- 18.Linkous, D. A., and J. D. Oliver. 1999. Pathogenesis of Vibrio vulnificus. FEMS Microbiol. Lett. 174:207-214. [DOI] [PubMed] [Google Scholar]
- 19.McCarter, L. L. 1998. OpaR, a homolog of Vibrio harveyi LuxR, controls opacity of Vibrio parahaemolyticus. J. Bacteriol. 180:3166-3173. [DOI] [PMC free article] [PubMed] [Google Scholar]
- 20.McDougald, D., S. Srinivasan, S. A. Rice, and S. Kjelleberg. 2003. Signal-mediated cross-talk regulates stress adaptation in Vibrio species. Microbiology 149:1923-1933. [DOI] [PubMed] [Google Scholar]
- 21.Nilsson, W. B., R. N. Paranjype, A. DePaola, and M. Strom. 2003. Sequence polymorphism of the 16S rRNA gene of Vibrio vulnificus is a possible indicator of strain virulence. J. Clin. Microbiol. 41:442-446. [DOI] [PMC free article] [PubMed] [Google Scholar]
- 22.Oliver, J. 2005. Wound infections caused by Vibrio vulnificus and other marine bacteria. Epidemiol. Infect. 133:383-391. [DOI] [PMC free article] [PubMed] [Google Scholar]
- 23.Oliver, J., and J. Kaper. 2001. Vibrio species, p. 228-264. In M. P. Doyle, L. R. Beuchat, and T. J. Montville (ed.), Food microbiology: fundamentals and frontiers, 2nd ed. ASM Press, Washington, D.C.
- 24.Oliver, J. D. 2006. Vibrio vulnificus, p. 349-366. In F. L. Thompson, B. Austin, and J. Swings (ed.), The biology of vibrios. ASM Press, Washington, D.C.
- 25.O'Toole, G. A., and K. Roberto. 1998. Flagellar and twitching motility are necessary for Pseudomonas aeruginosa biofilm development. Mol. Microbiol. 30:295-304. [DOI] [PubMed] [Google Scholar]
- 26.Park, K.-J., M.-J. Kang, S. H. Kim, H.-J. Lee, J.-K. Lim, S. H. Choi, S.-J. Park, and K.-H. Lee. 2004. Isolation and characterization of rpoS from a pathogenic bacterium, Vibrio vulnificus: role of σS in survival of exponential-phase cells under oxidative stress. J. Bacteriol. 186:3304-3312. [DOI] [PMC free article] [PubMed] [Google Scholar]
- 27.Rosche, T. M., Y. Yano, and J. D. Oliver. 2005. A rapid and simple PCR analysis indicates there are two subgroups of Vibrio vulnificus which correlates with clinical or environmental isolation. Microbiol. Immunol. 4:381-389. [DOI] [PubMed] [Google Scholar]
- 28.Senoh, M., S. Miyoshi, K. Okamoto, B. Fouz, C. Amaro, and S. Shinoda. 2005. The cytotoxin-hemolysin genes of human and eel pathogenic Vibrio vulnificus strains: comparison of nucleotide sequences and application to the genetic grouping. Microbiol. Immunol. 49:513-519. [DOI] [PubMed] [Google Scholar]
- 29.Simpson, L. M., V. K. White, S. F. Zane, and J. D. Oliver. 1987. Correlation between virulence and colony morphology in Vibrio vulnificus. Infect. Immun. 55:269-272. [DOI] [PMC free article] [PubMed] [Google Scholar]
- 30.Smith, A. B., and R. J. Siebeling. 2003. Identification of genetic loci required for capsular expression in Vibrio vulnificus. Infect. Immun. 71:1091-1097. [DOI] [PMC free article] [PubMed] [Google Scholar]
- 31.Smith, B., and J. D. Oliver. 2006. In situ and in vitro gene expression by Vibrio vulnificus during entry into, persistence within, and resuscitation from the viable but nonculturable state. Appl. Environ. Microbiol. 72:1445-1451. [DOI] [PMC free article] [PubMed] [Google Scholar]
- 32.Sperandio, V., J. L. Mellies, W. Nguyen, S. Shin, and J. B. Kaper. 1999. Quorum sensing controls expression of the type III secretion gene transcription and protein secretion in enterohemorrhagic and enteropathogenic Escherichia coli. Proc. Natl. Acad. Sci. USA 96:15196-15201. [DOI] [PMC free article] [PubMed] [Google Scholar]
- 33.Sperandio, V., A. G. Torres, J. A. Giron, and J. B. Kaper. 2001. Quorum sensing is a global regulatory mechanism in enterohemorrhagic Escherichia coli O157:H7. J. Bacteriol. 183:5187-5197. [DOI] [PMC free article] [PubMed] [Google Scholar]
- 34.Strom, M. S., and R. N. Paranjpye. 2000. Epidemiology and pathogenesis of Vibrio vulnificus. Microbes Infect. 2:177-188. [DOI] [PubMed] [Google Scholar]
- 35.Van der Woude, M. W., and A. J. Bäumler. 2004. Phase and antigenic variation in bacteria. Clin. Microbiol. Rev. 17:581-611. [DOI] [PMC free article] [PubMed] [Google Scholar]
- 36.Warner, J. M., and J. D. Oliver. 1999. Randomly amplified polymorphic DNA analysis of clinical and environmental isolates of Vibrio vulnificus and other Vibrio species. Appl. Environ. Microbiol. 65:1141-1144. [DOI] [PMC free article] [PubMed] [Google Scholar]
- 37.Wolfe, A. J., D. S. Millikan, J. M. Campbell, and K. L. Visick. 2004. Vibrio fischeri σ54 controls motility, biofilm formation, luminescence, and colonization. Appl. Environ. Microbiol. 70:2520-2524. [DOI] [PMC free article] [PubMed] [Google Scholar]
- 38.Wright, A. C., J. L. Powell, J. B. Kaper, and J. G. Morris, Jr. 2001. Identification of a group 1-like capsular polysaccharide operon for Vibrio vulnificus. Infect. Immun. 69:6893-6901. [DOI] [PMC free article] [PubMed] [Google Scholar]
- 39.Yoshida, S., M. Ogawa, and Y. Mizuguchi. 1985. Relation of capsular materials and colony opacity to virulence of Vibrio vulnificus. Infect. Immun. 47:446-451. [DOI] [PMC free article] [PubMed] [Google Scholar]


