

Abstract
Background & Aims:
The plasminogen (plg) system participates in tissue repair in several organs, but its role in pancreas repair remains poorly characterized. To better understand the role of plg in pancreas recovery following injury, we examined the course of caerulein-induced pancreatitis in plg deficient and sufficient mice.
Methods:
Pancreatitis was induced by caerulein administration (50 μg/kg, 7 ip injections). Mice were sacrificed either at the acute phase (7 hours after the first caerulein injection) or during recovery (at 2, 4 and 7 days). In pancreatic sections we examined: pancreatic morphology, trypsin activation, inflammatory cell infiltration, acinar cell death, cell proliferation, extracellular matrix (ECM) deposition, activation of stellate cells (PSCs), and components of the plg and metalloproteinase systems.
Results:
In plg sufficient mice, pancreatic plg levels and plasmin activity increased during the acute phase and remained elevated during recovery. Pancreatitis resolved in plg sufficient mice within 7 days. Pancreas recovery involved reorganization of the parenchyma structure, removal of necrotic debris, cell proliferation, transient activation of PSCs and moderate deposition of ECM proteins. Acute pancreatitis (7-h) was indistinguishable between plg deficient and sufficient mice. In contrast, pancreas recovery was impaired in plg deficient mice. Plg deficiency led to disorganized parenchyma, extensive acinar cell loss, poor removal of necrotic debris, reduced cell proliferation and fibrosis. Fibrosis was characterized by deposition of collagens and fibronectin, persistent activation of PSCs and upregulation of pancreatic TGF-β1.
Conclusions:
Plg/plasmin deficiency leads to features similar to those found in chronic pancreatitis such as parenchymal atrophy and fibrosis.
Introduction
Chronic pancreatitis is characterized by parenchymal atrophy, chronic inflammation and abundant fibrosis in interlobular and periacinar areas. 1 Although extensive experimental work has improved our understanding of the fibrotic process, the mechanisms underlying pancreatic fibrogenesis remain unclear. A generally accepted theory is that fibrosis is the result of repeated injury and/or a failure in the repair process following organ damage. 2 This injury may result from different causes including alcohol abuse, viral infections and hormonal and metabolic disorders. 3,4 Regardless of the cause, organ recovery requires extensive extracellular matrix remodeling. After damage, a provisional matrix is established at the site of injury that probably derives from early-activated myofibroblast-type cells and circulating proteins such as fibrin, fibronectin or vitronectin. 5 Adequate remodeling of this provisional matrix allows cell proliferation, migration and assembly of new parenchymal cells. These processes are coordinated via production of ECM proteins, growth factors, adhesion proteins and extracellular-degrading proteases, and complex cell-matrix interactions. Alterations in this coordinated process leads to an imbalance between biosynthesis and proteolytic clearance of matrix components, impair regeneration and ultimately to fibrosis. 6,7
Two main extracellular proteolysis systems participate in tissue remodeling and repair processes: matrix metalloproteinases (MMP) 8,9 and proteases of the plasminogen (plg) system. 10 While the MMP system has been extensively studied in several organs including pancreas, the role of the plg system in pancreas repair remains poorly defined. The plg system comprises a number of proteases and protease inhibitors that govern the proteolytic activation of plg into plasmin. Plasmin is a serine protease with a broad substrate specificity that is compatible with the degradation of several components of the extracellular matrix, and activation of metalloproteinases (MMPs) and latent growth factors. 10,11Plasminogen is secreted primarily from hepatocytes and released into circulating blood and body fluids. In the extravascular space plg binds to components of the extracellular matrix and to cellular receptors. Plg stored in the pericellular space has a resting proteolytic potential whose activation is tightly regulated by a balance between plg activators and inhibitors. The main physiological plg activators are tissue-type plasminogen activator (tPA) and urokinase-type plasminogen activator (uPA), the later being the main plg activator in tissue remodeling processes. 12 uPA is secreted as an inactive protein that is converted to the active form by other proteases, including plasmin.13,14 Binding of uPA to its specific cellular receptor, uPAR promotes pericellular uPA activation and in turn, plg activation. The resulting active proteases, uPA and plasmin, can participate in pericellular matrix degradation by their own proteolytic activity. In addition, the uPA-uPAR complex modulates a plethora of plg-independent processes such as cell adhesion, migration and proliferation through interaction with integrins, ECM proteins and/or intracellular signaling systems 15 uPA activation is negatively regulated by specific plg activator inhibitors, the best characterized being PAI-1. PAI-1 expression is almost undetectable in normal tissues but is strongly induced in pathological conditions. 16 PAI-1 is secreted as an active molecule capable of inhibiting uPA. However, PAI-1 can spontaneously convert to a latent form with resulting loss of inhibitory activity. 17
Compelling evidence for the involvement of the plg system in ECM turnover during tissue repair comes from targeted gene deletion or overexpression in mice. In this regard, several studies have shown that tissue repair following experimental injury in several organs is impaired in mice deficient in plg, uPA or tPA or transgenic mice overexpressing PAI-1. 18-23 These mice also exhibit increased ECM deposition proteins within the injured organ, an effect attributed at least in part to reduced plasmin-associated extracellular proteolysis. Accordingly, PAI-1 deficiency appears to protect from experimental fibrosis in several organs, although the final outcome may vary in relation with the characteristics of the experimental model. 24-26
Components of the plg activating system are synthesized within the pancreas. Under physiological conditions, acinar, ductal and vascular cells are the main cells expressing uPAR and producing uPA. 27,28 Under pathological conditions, several cell types such as injured parenchyma cells, endothelial cells, inflammatory cells, myofibroblast-type cells and cancer cells can produce plg activators and PAI-1 14,29. Overexpression of uPA and tPA as well as uPAR and PAI-1 in stroma and cancer cells has been associated with pancreatic cancer progression and invasion 29-31. In relation with pancreatitis, plasmin activity has been reported to be elevated in blood and pancreatic exudates at early times in experimentally induced pancreatitis 32,33 and also in acute pancreatitis in humans. 34,35 A recent study has reported that PAI-1 gene expression is upregulated early after experimental pancreatitis, 36 an effect that may limit the extent of plg activation. Furthermore, Friess et al found increased expression for uPA, uPAR and PAI-1 in pancreatic biopsies from patients with acute and chronic pancreatitis compared to normal pancreatic sections from organ donors. 37,38 Since components of the plg system were overexpressed in acinar and ductal cells close to necrotic areas, the authors suggested that the plg system might play a role in removal of necrotic debris.
Despite evidence supporting a role for the plg system in acute and chronic pancreatitis, no studies have specifically investigated whether the system participates in ECM degradation and repair processes following pancreas injury. Recently, we reported that rat acinar cells produce uPA and uPAR and activate plg to plasmin at the cell surface.28 Moreover, our data suggest that plasmin is involved in ECM degradation in pancreas since inhibition of plasmin activity by aprotinin, a known serine-protease inhibitor, or Fatty acid ethyl esters, toxic ethanol metabolites, increased the content of ECM proteins without affecting mRNA expression.28
Based in the above information, we hypothesized that the plg system and in particular plg/plasmin activity modulates matrix turnover following pancreas injury and contributes to organ recovery. To test this hypothesis, we examined pancreatic recovery following an episode of experimental acute pancreatitis in mice genetically deficient in plg and in plg sufficient mice. For these studies, we selected the known model of pancreatitis based in necroinflammatory injury to acinar cells induced by hyperstimulation with the cholecystokinin analogue caerulein. Specifically, we examined during the whole course of pancreatitis (from the acute phase up to seven days after caerulein administration) the expression and activity of components of the plg system, and the consequences of plg deficiency on the severity of pancreatitis, acinar cell death and proliferation, activation of pancreatic stellate cells (PSCs) and deposition of ECM proteins, all events that occurred during the development and resolution of pancreatitis.
Materials and Methods
Animals
We used plg deficient mice and their littermate plg sufficient mice. Mice (mixed 129 SvJ/CF-1/NIH Black Swiss background) were generated by disruption of the genes coding for plg and have been describe elsewhere. 39 Genotyping of the plg alleles was performed as described. 39 Mice of all genotypes were housed in standard facilities under controlled conditions of temperature, humidity and illumination, and maintained on standard rodent chow and free access to tap water. Animal care and all procedures were approved by the Institutional Animal Care and Use Committees of the Children’s Hospital Research Foundation (Cincinnati), VAGLAHS and the University of California.
Experimental Pancreatitis and Tissue Processing
Mice were randomly divided into groups of 6-8 animals each and subjected to an episode of experimental acute pancreatitis to induced pancreas damage. Pancreatitis was induced in two months old plg deficient and sufficient mice by administration of seven hourly intraperitoneal injections of 50 μg/kg caerulein (American Peptide Company, Sunnyvale, CA). Control mice from all genotypes received comparable injections of 0.9 % sodium chloride (saline). Mice were sacrificed at several time points: 7 hours following the first injection of caerulein or saline (acute phase), and 2, 4 and 7 days later (recovery phase). Mice were examined daily for body weight as well as signs of diarrhea or distress such as piloerection, lethargy and periorbital exudates.
Mice were sacrificed at the indicated times by CO2 asphyxiation. Immediately blood samples were collected from the inferior vena cava and processed for measurements of amylase activity. Pancreata and lung sections were removed, weighed and immediately frozen in liquid nitrogen and store at -80 °C for subsequent studies, or fixed in 10 % buffered formalin phosphate or 2 % glutaraldehyde for histological analysis.
Acinar Cell Isolation
Dispersed pancreatic acini were isolated from male plg sufficient mice (+/-) by collagenase digestion as described before. 28 Briefly, the pancreas was digested with CLPS grade collagenase (Worthington Biochemicals, Freehold, NJ), and the resulting preparation of acini was suspended in 199 medium supplemented with antibiotics (100 U/mL penicillin and 100 μg/mL streptomycin, all products from Invitrogen, Carlsbad, CA). Acini were incubated at 37°C in a 5 % CO2-air humidified atmosphere for 4 h. Cells were incubated with cholecystokinin (Research Plus, Manasquan, NJ) at supraphysiological concentrations (100 nmol/L), and with or without 2 μmol/L human plg (Calbiochem, San Diego, CA). At the end of the incubation period, cells and conditioned media were harvested and analyzed for activation of plg (zymography), Lactate Dehydrogenase (LDH) release and activation of caspase-3 (Western blotting).
Histological Analysis
Formalin-fixed pancreatic sections from at least 4 mice per group were embedded in paraffin. Five μm sections were stained with H&E for assessment of parenchyma structure, inflammation and necrosis. Two experienced pathologists who were blinded to treatments examined in multiple random, non-overlapping sections acinar cell necrosis, cell vacuolization, edema and inflammatory cell infiltration. Inflammation was scored as the density of the inflammatory cell infiltrate (neutrophils, monocytes/macrophages and lymphocytes) as described before: 40 “absent” (0), “low” (1), “moderate” (2) or “extensive” (3).
Acinar cell necrosis was determined by counting the number of necrotic cells or the extent of areas with loss of cellularity and necrotic content, and expressed in the figures as percentage of necrotic cells per total pancreatic area. Cells with swollen cytoplasm, loss of plasma membrane integrity, and leakage of organelles into interstitium were considered necrotic. Apoptotic cells were identified as cells exhibiting DNA fragmentation (TUNEL positive cells) in conjunction with characteristic morphological changes related with apoptosis, such as shrinkage and membrane blebbing (400-magnification). DNA fragmentation was assessed by the terminal deoxynucleotidyl transferase-mediated dUTP nick end labeling (TUNEL) procedure (Apoptosis Detections kit TA4625; R&D Systems, Minneapolis, MN).
The Mason’s trichrome staining procedure was used for detection of intrapancreatic collagens in formalin-fixed tissue sections. Total collagen was evaluated by morphometric analysis of digitized pictures obtained from multiple random, non-overlapping sections under a high-power field (x 400-magnification, 6-10 random fields per section). Images were captured with all exposures manually set at equal times with a Nikon Eclipse E600 microscope equipped with a digital camera using the SPOT imaging software (Diagnostic Instruments, Sterling Heights, MI). The amount of collagen (stained in blue) in the pictures was quantified using a computer-assisted image analysis system (MetaMorph imaging system; Universal Imaging Corporation, Downingtown, PA) and expressed as stained area per total examined area.
Immunohistochemistry
Formalin-fixed pancreatic tissue sections (5 μm) were pretreated to remove paraffin and unmask antigens, and blocked with 1 % H2O2 and 1 % goat normal serum. Then, sections were stained with the proliferation marker Proliferating Cell Nuclear Antigen (anti-PCNA antibody; Signet Pathology Systems, Dedham, MA) or primary antibody to alpha-smooth muscle actin (α-SMA; Sigma Chemical, St. Louis, MO). PCNA is an auxiliary protein synthesized in early G1 and S phases of the cell cycle and can be used as marker for proliferating cells. Cell proliferation was estimated by counting the number of PCNA positive cells present within high power random fields (area of each field 0.07 mm2) and expressed as total number of PCNA positive cells per total acinar cells. α-SMA is a cytoskeletal protein present in activated stellate cells and was used as marker of PSC activation. Sections stained with the secondary antibodies alone were negative.
Trypsin Activity
Active trypsin in pancreatic tissue homogenates was measured as described previously 41. Briefly, the tissue was homogenized on ice in a buffer containing 5 mmol/L MES, 1 mmol/L MgSO4 and 250 mmoles/L sucrose (pH 6.5). A 25-ml aliquot of the homogenate was incubated at 37 °C for 300 sec in assay buffer containing 50 mmol/L Tris (pH 8.0), 150 mmol/L NaCl, 1 mmol/L CaCl2 and 0.1 mg/ml BSA and Boc-Gln-Ala-Arg-AMC as specific substrate for trypsin. Cleavage of this substrate by trypsin releases 7-amino-4-methylcoumarin (AMC), which emits fluorescence at 440 nm (γem) with excitation at 380 nm (γex). Trypsin activity in each sample was determined using a standard curve for purified trypsin (Sigma Chemical, St. Louis, MO).
Myeloperoxidase Activity.
Neutrophil infiltration in pancreas and lung tissue was quantified by measuring myeloperoxidase (MPO) activity as previously described 42 with minor modifications. Briefly, tissue samples were homogenized in 20 mmol/L potassium phosphate buffer (pH 7.4) containing 1 mmol/L EDTA, and thereafter resuspended in 50 mmol/L potassium phosphate buffer (pH 6) containing 0.5 % hexadecyltrimethyl ammonium bromide. The samples were then freeze-thawed three times, sonicated for 30 sc, incubated at 60°C for 2 h, and centrifuged for 20 min at 14,000 g. MPO activity was measured in aliquots of the supernatants mixed with 3,3,5,5-tetramethylbenzidine as substrate for MPO (final concentration 1.6 mmol/L) diluted in 80 mmol/L potassium phosphate buffer (pH 5.4) containing freshly added H2O2 (final concentration 3 mmol/L). Absorbance at 620-nm was measured for 3 min at 30 sec intervals. MPO activity was estimated by comparison of values to those obtained with known concentrations of human MPO (Sigma Chemical, St. Louis, MO) and expressed as activity units per mg of tissue homogenates.
Hydroxyproline Quantification
Total collagen was assessed by measuring hydroxyproline content as described before. 28 Pancreatic tissue samples were hydrolyzed in 6 mol/L HCl at 110 °C for 16 hours. After neutralization, hydroxyproline was oxidized for 20 minutes by adding 1 mL of chloramine T dissolved in sodium-citrate buffer (pH 6.0) and 30% methyl cellosolve (Sigma Chemical, St. Louis, MO). The reaction was stopped with 3 mmol/L perchloric acid, and 1 mL of Ehrlich’s reagent (ICN Biochemicals, Aurora, OH) was added to the samples. Samples were incubated at 60°C for 20 min and the absorbance was measured at 550 nm. Hydroxyproline values were expressed as μg per mg of total DNA.
Plasmin and uPA Activities
Plasmin activity was analyzed as described previously. 28 Briefly, aliquots of tissue homogenates (400 μg total protein) were added to Tris buffer (100 mmol/L Tris, pH 7.5, 10 mmol/L CaCl2). Samples were incubated for 30 min at 37°C. Then, 80 μg of the plasmin substrate D-Val-Leu-Lys-AFC.2TA (Enzyme Systems Products, Livermore, CA) were added to the samples, and the formation of AFC by enzyme activity was measured spectrofluorometrically at different time points (γex 400 nm; γem 505 nm). Specificity of the substrate was assessed by using known concentrations of rat plasminogen (American diagnostica, Greenwich, CT), previously activated in the presence of uPA (20 nmol/L), and inhibition by 5 μg/mL aprotinin and 1 mmol/L phenylmethylsulfonyl flouride. Plasmin activity was expressed as pmol of AFC generated per mg of total protein per min.
uPA activity was measured by chromogenic assay using a commercial kit (Chemicon International, Temecula, CA). Briefly, aliquots of the cell lysate were added to 96-well plates containing appropriate amounts of assay buffer and a specific uPA chromogenic substrate (tripeptide with pNA group). After 20 hours incubation at 37°C, the production of a colored product cleaved from the chromogenic substrate by active uPA was detected at 405 nm (spectophotometry). Active uPA was calculated relative to known concentrations of uPA and expressed as activity units per mg of total protein.
Immunoblot Analysis
Pancreatic tissue samples or isolated acinar cells were homogenized on ice-cold RIPA buffer containing 50 mmol/L Tris (pH 7.4), 150 mmol/L NaCl, 1 % deoxycholic acid, 1% Triton X-100, 0.1 % SDS and a freshly added mixture of protease inhibitors (50 μg/mL each of aprotinin, pepstatin, leupeptin, antipain, chymostatin and 1 mmol/L phenylmethylsulfonyl flouride). Protein extracts (40-60 μg total proteins) were resolved by 4-20 % SDS-PAGE then blotted to nitrocellulose membranes following standard methods as previously described 28. Antibodies used included anti-plasminogen (Innovative Research, Southfield, MI); anti-uPA and anti-PAI-1 (American Diagnostica; Stamford, CT); anti-fibronectin, and anti-α-smooth-muscle (α-SMA; Sigma Chemical, St. Louis, MO), anti-tissue inhibitor of metalloproteinase-1 (TMP-1; Chemicon International, Temecula, CA), and anti-caspase-3 and anti caspase-8 (Cell Signaling Technology, Danvers, MA). Anti-Glyceraldehyde-3-phosphate dehydrogenase (GAPDH; Abcam, Cambridge, MA) mAb was used as a loading control for total protein cell content. Membranes were then incubated with horseradish peroxidase-conjugated specific secondary antibodies (Biorad, Hercules, CA). Immunoreactive bands were visualized on Kodak XAR5 film using chemiluminescence’s detection reagents (Pierce, Rockford, IL). Optical densitometry reading of the immunoblots was performed using Scion imaging software (Scion Corporation, Frederick, MD).
Gelatin Zymography
Gelatinase activity in pancreatic samples was assessed by using 10 % zymogram gels containing 0.1 % gelatin (Invitrogen, Carlsbad, CA). Samples were homogenized in modified RIPA buffer containing 50 mmol/L Tris-HCl (pH, 7.4), 150 mmol/L NaCl, 1 % NP-40, a mixed of protease inhibitors (aprotinin, leupeptin, pepstatin, 5 μg/ml each) and 1 mmol/L PMSF. Equal amounts of protein extracts were separated by electrophoresis under non-denaturing conditions, gels were washed for 1 hour in 2.5 % Triton X-100 and incubated at 37°C for 16-18 h in 50 mmol/L Tris-buffer containing 20 mmol/L EDTA or serine protease inhibitors (5 μg/ml aprotinin and 10 μg/ml soybean trypsin inhibitor) to block serine protease or MMP activities, respectively. Then, gels were stained with 0.5 % Coomassie Blue, de-stained with a mixture of water/methanol/glacial acetic acid (50:40:10) solution and air-dried. In some gels, recombinant human MMP-2 and MMP-9 (Sigma Chemical, St. Louis, MO) or human plg (Calbiochem, San Diego, CA) previously activated to plasmin with uPA were run simultaneously with the samples as positive controls.
Quantification of TGF-β1 and PAI-1
Levels of TGF-β1 and antigen PAI-1 in pancreas were determine by using commercially available ELISA kits: TGF-β1 (Emax ImmunoAssay SystemBiochem, Promega, Madison, WI); PAI-1 (MPAIKT-TOT, Innovative Research, Southfield, MI). Pancreatic samples were homogenized in PBS containing a mixture of protease inhibitors (50 μg/mL each of aprotinin, pepstatin, leupeptin, antipain, chymostatin and 1 mmol/L phenylmethylsulfonyl fluoride). Unbroken cells were disrupted by brief sonication on ice. Insoluble debris was removed by centrifugation and protein extracts were processed for ELISA following instructions of the manufactures. Both ELISA kits consisted in an antibody sandwich format. In this format, active TGF-β1 or PAI-1 (free, latent and complexed forms) were captured by specific coated antibodies. Then, the captured TGF-β1 or PAI-1 was bound to specific primary antibodies and the complexes were detected with specific peroxisase-conjugated secondary antibodies. Levels of detection for active TGF-β1 was 32 pg/ml and 0.05 ng/ml for PAI-1.
Other Assays
Amylase levels in plasma and pancreatic tissue homogenates were determined using the Phadebas Amylase Test (Pharmacia Diagnostics, Uppsala, Sweden) following the recommendations of the manufacture. Total protein concentration in tissue extracts was measured by the Bradford assay (Bio-Rad Laboratories, Richmond, CA). Total DNA in tissue samples was quantified by spectrofluorometric assay 43 using Hoeschst-33258 stain and calf thymus DNA as a standard (γex 356 nm; γem 458 nm). LDH activity was analyzed using a LDH Detection Kit (Roche, Mannheim, Germany).
Statistical analysis
Data are presented as means ± SEM of values obtained from at least five mice per group. Histology pictures, immunoblots and zymogram pictures are representative of at least four mice per group. Statistical analysis of the data was performed using the SigmaStat software. We compared group means by using the unpaired Student t test for pairwise comparison and one way or two-way ANOVA and Tukey post hoc method for multiple comparisons. A value of P<0.05 was considered statistically significant.
Results
Characterization of plasminogen deficient and sufficient mice
In the present study, we used two-month old plg deficient mice and their littermate plg sufficient mice. Plg sufficient mice carrying one mutant allele (+/-) were used as controls for most of the experiments since they were genetically closer to plg deficient mice, displayed similar production of plg in liver compared to wild type, and had an essentially wild-type phenotype. 44 In addition, preliminary studies showed that the severity of caerulein-induced pancreatitis and pattern of recovery did not differ between plg (+/-) and plg (+/+) mice (data not shown). Two-month old plg-deficient mice appeared healthy, with normal pancreas morphology and had similar body weight compared to littermate controls. Thus, male plg +/-mice had an average body weight of 30 g (1.05) vs. 29.7 g (0.6) in male plg -/- mice. Female plg +/- mice had a body weight of 24.0 g (0.4) compared to 22.6 g (0.5) in female plg -/- mice. Values in parenthesis represent the SEM of 6 mice per group. Of note, histological examination of the pancreas did not reveal noticeable fibrin deposits either before or after caerulein administration in any group of mice, irrespective of plg status (data not shown). Although fibrin deposition is a hallmark of the deleterious effects of plg deficiency in other organs, 45 it appears irrelevant to caerulein-induced pancreatitis.
Plasminogen/plasmin levels and activity increase in pancreas during caerulein-induced pancreatitis
Pancreatitis was induced in plg sufficient and deficient mice by seven hourly intraperitoneal injections of 50 μg/kg caerulein. Mice were sacrificed seven hours after starting caerulein treatment (acute phase), and during recovery (two, four and seven days after caerulein treatment). We first analyzed whether protein levels of plg within the pancreas changed during the course of pancreatitis. As illustrated in Figure 1A, pancreatic plg levels were low in basal conditions in plg sufficient mice. However, plg content markedly increased during the acute phase of pancreatitis (7 h after caerulein) then declined progressively to almost basal values during the recovery phase. As expected, plg was not detected in pancreas from plg deficient mice.
Figure 1.

Plasminogen (plg) content and plasmin activity in pancreas following caerulein administration. Pancreatitis was induced in plg sufficient and deficient mice by seven hourly intraperitoneal injections of caerulelin (50 μg/kg). Saline treated mice were used as controls (-). Mice were sacrificed at the indicated times after the first caerulein injection. (A) Representative western blot showing plg expression in pancreas homogenates from plg sufficient and deficient mice (30 μg total protein/lane). Each lane represents an individual mouse; shown are one or two individual mouse per group and time point (n=4 mice per group and time point). GAPDH expression was measured as loading control. (B) Plasmin activity in pancreatic homogenates from plg sufficient mice was analyzed by chromogenic substrate assay as describe in Material and Methods. Saline treated animals were used as controls (-). Results represent mean ± SEM; six animals per group and time point. *P<0.05 vs. plg (+/-).
To assess plg activation into plasmin, we measured pancreatic plasmin activity using a chromogenic substrate with high selectivity for plasmin, as described in Material and Methods. As illustrated in Figure 1B, pancreatic plasmin activity followed a pattern similar to changes in pancreatic plg levels (Figure 1A), suggesting the existence of an efficient mechanism of plg activation during pancreatitis. At day 7, pancreatic plasmin activity remained significantly elevated whereas plg content returned to basal values. This may be accounted for by changes in levels and activity of plg activators as described in the next section).
Pancreatic levels of components of the plg activating system increase during caerulein-induced pancreatitis
Plg is converted into active plasmin by the proteolytic action of the serine proteases uPA and tPA. Both the expression levels and activity of these plg activators contribute to a tight regulation of plg activation. 10,15,46 To better understand plg activation during the course of pancreatitis, we examined the pancreatic levels and activity of uPA, its specific receptor uPAR and the uPA inhibitor PAI-1. We also measured the pancreatic content of vitronectin, an adhesive protein that stabilizes the active PAI-1 in the pericellular space. 47 These results are illustrated in Figure 2.
Figure 2.
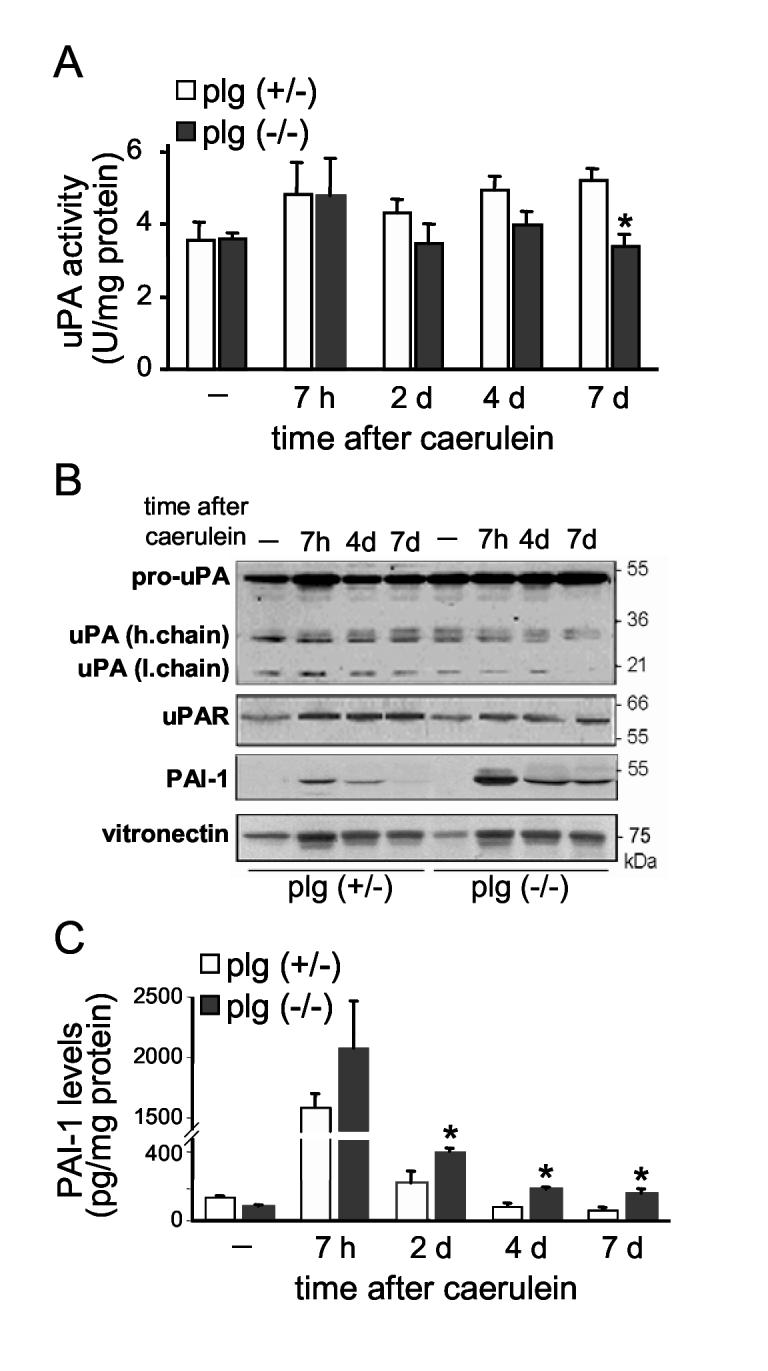
Plg activating system during the course of caerulein-induced pancreatitis. (A) uPA activity in pancreas homogenates from plg sufficient and deficient mice at the indicated times after caerulein administration. uPA activity was measured using a specific chromogenic substrate as described in Material and Methods. Results in graphs represent mean ± SEM of the values from five or six animals per group and time point. *P<0.05 vs plg (+/-). (B) Representative immunoblots for uPA, uPAR, PAI-1 and vitronectin in pancreas homogenates. The antibody against uPA recognizes the proenzyme (one chain form) and the active form (two-chain form) but not PAI-1-bound uPA. The antibody against PAI-1 recognizes the active and latent forms of PAI-1. Blots are representative of at least 3 mice per group and time point. (C) Quantification of total PAI-1 antigen content (active, latent and complexed forms) in pancreas homogenates by ELISA. Results in graphs represent mean ± SEM; five animals per group and time point. *P<0.05 vs plg (+/-).
In plg sufficient mice, pancreatic uPA activity augmented by 40 % after caerulein administration (acute phase) and remained at these higher than basal levels during recovery (Figure 2A). This increased uPA activity did not correlate with similar upregulation of uPA expression levels, as measured by Western blot analysis (Figure 2B). On the other hand, caerulein treatment increased pancreatic uPAR expression to a similar extent observed with uPA activity (Figure 2B). Since binding to uPAR promotes uPA activity, this increase in uPAR likely accounts for at least part of the increased uPA activity. Moreover, active plasmin or other proteases elevated during pancreatitis, such as trypsin or elastase, could promote the activation of uPA in a cascade of reciprocal zymogen activation. Overall, the observed increases in uPA activity levels (Figure 2A), as well as increased tPA levels (not shown), are consistent with a role in maintaining the high levels of plasmin activity associated with pancreatitis in plg sufficient mice.
We next examined pancreatic PAI-1 content to determine whether differences in levels of this inhibitor could also be related to changes in uPA activity. For these experiments, we used specific antibodies that recognized total PAI-1 antigen, i.e. all latent, active and bound (to uPA or tPA) forms. As expected, pancreatic PAI-1 levels were very low under basal conditions (Figures 2B and 2C). Upon caerulein administration, PAI-1 levels dramatically increased during the acute phase of pancreatitis, then decreased progressively, returning to basal values by day 4. Vitronectin content also increased after caerulein administration (Figure 2B), favoring the active conformation of PAI-1. The antibodies used in this study do not discriminate between active and latent PAI-1 conformations and thus, do not provide information as measure of the degree of uPA inhibition elicited by PAI-1. Nevertheless, we speculate that the high levels of PAI-1 present during the acute phase of pancreatitis limit the extent of uPA activation and plasmin activity despite the presence of elevated plg content and excessive protease activation.
As illustrated in Figure 2, basal components of the plg activating system were similar in plg deficient and sufficient mice. Pancreatic uPA activity, and PAI-1 and vitronectin levels were also elevated during the acute phase of pancreatitis in both plg deficient and sufficient mice. However, PAI-1 levels remained significantly higher during the recovery phase in plg deficient mice as compared with plg sufficient mice (Figures 2B and 2C). Associated with these augmented PAI-1 levels, pancreatic uPA activity decreased significantly in plg deficient mice during recovery (Figure 2A), supporting a role for PAI-1 in regulating uPA activity during pancreatitis.
Plg deficiency does not affect the severity of the acute phase of caerulein-induced pancreatitis
Data in Figure 1 showed that pancreatic plasmin activity is elevated during the acute phase of caerulein-induced pancreatitis. Since plasmin is a broad-spectrum protease with a trypsin-like activity, we asked whether plg activation aggravates the onset of caerulein-induced pancreatitis. To answer this question, we compared the severity of pancreatitis during the acute phase (7 h after the first caerulein injection) in plg sufficient and deficient mice. As illustrated in Figure 3, at this time point we found no differences between the two groups of mice in serum amylase levels, pancreatic trypsin activation or pancreas weight. In addition, histological examination of the pancreas showed similar degree of parenchymal edema, acinar cell vacuolization and necrosis, as well as density of inflammatory cell infiltration in both groups of mice (see Figure 5, panels b and e; Figure 6A and Figure 7). Thus, although levels and activity of plg/plasmin were increased at 7 h after caerulein, lack of plg did not affect the severity of pancreatis at this time point.
Figure 3.
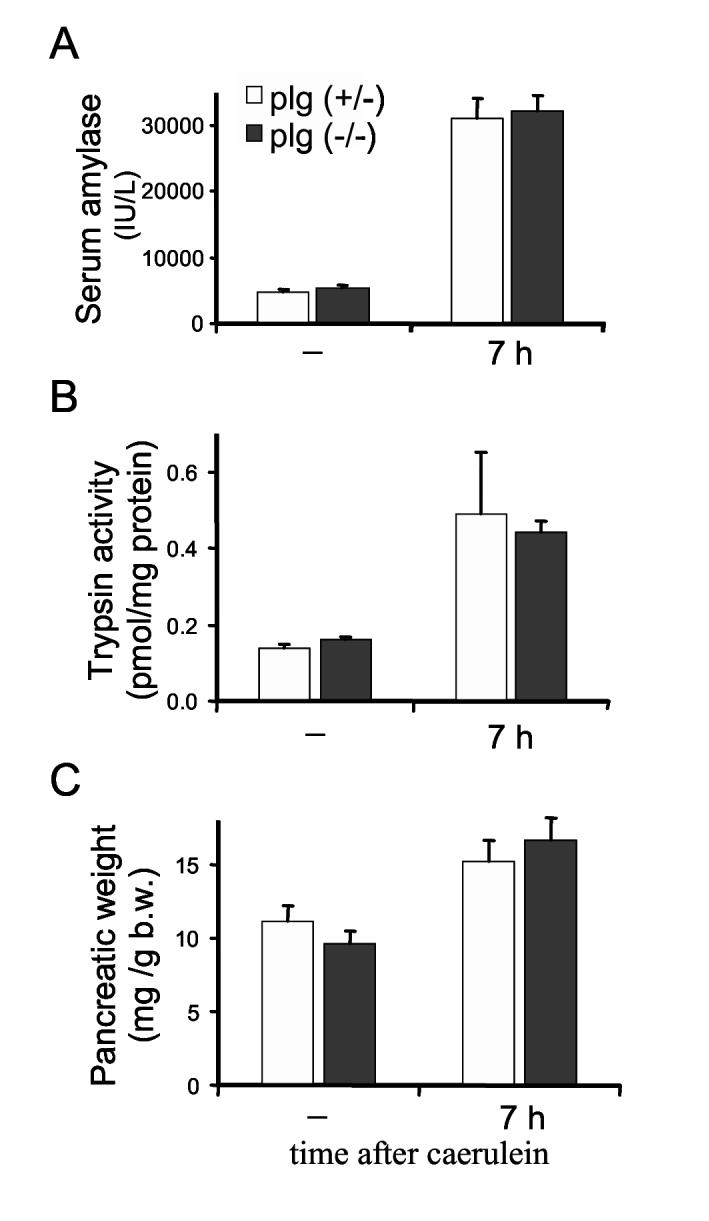
Severity of the acute phase of caerulein-induced pancreatitis in plg deficient and sufficient mice. Mice were sacrificed 7 hours following supramaximal caerulein administration (50 μg/kg, 7 houly ip injections). Saline treated mice were used as controls (-). Blood amylase activity (A), pancreatic trypsin activation (B) and pancreatic weight relative to total body weight (b.w.). (C) were measured as indicated in the Material and Method section. Results represent mean ± SEM of the values from of 5-7 mice per group and time point.
Figure 5.
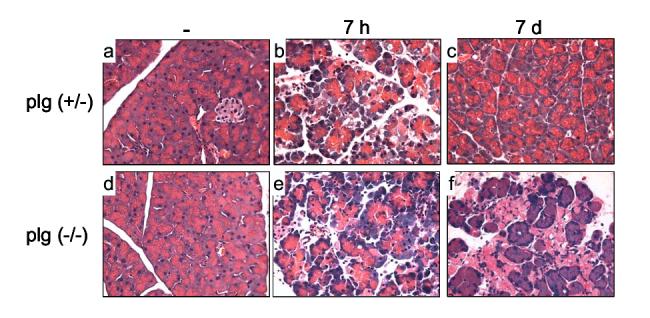
Pancreas morphology during the course of caerulein-induced pancreatitis. Panels show representative H&E-stained pancreatic sections from plg sufficient and deficient mice treated with saline (panels a and d); or 7 hours (panels b and e) and 7 days (panels c and f) after supramaximal caerulein administration. Note the morphologic alterations and abundant necrotic debris in pancreas from plg (-/-) mice at day 7 after caerulein (magnification 400X).
Figure 6.
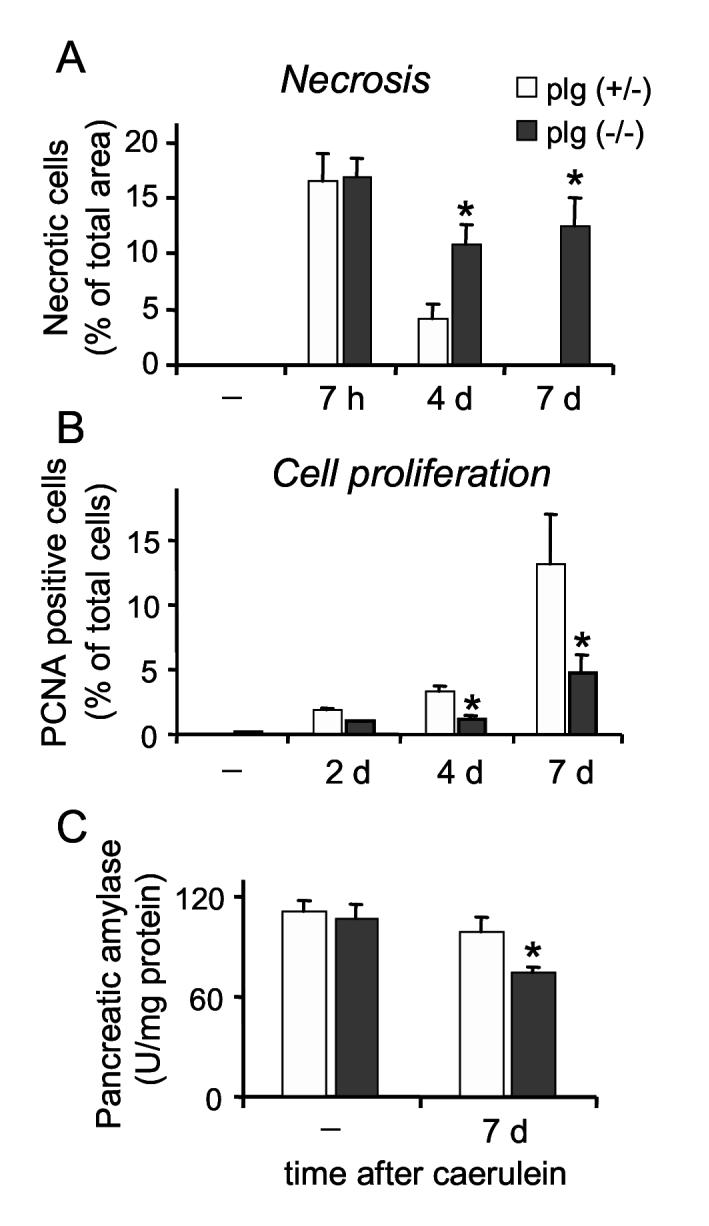
Cell necrosis and proliferation during the course of caerulein-induced pancreatitis in plg deficient and sufficient mice. Animals were sacrificed at several time points following supramaximal caerulein administration or saline (-). (A) Acinar cell necrosis was quantified in formalin-fixed pancreatic sections stained with H&E as indicated in the Material and Methods section, and expressed as percentage of acinar cell necrosis per total pancreatic area. (B) Acinar cell proliferation was assessed by immunostaining of formalin-fixed pancreatic sections against Proliferating Cell Nuclear Antigen (PCNA). The values measured were the number of positive cells per 100 acinar cells. (C) Amylase content in pancreas homogenates was determined using the Phadebas Amylase test. Graphs represent mean ± SEM of the values from at least 5 mice per group and time point. * P<0.05 compared to plg (+/-).
Figure 7.
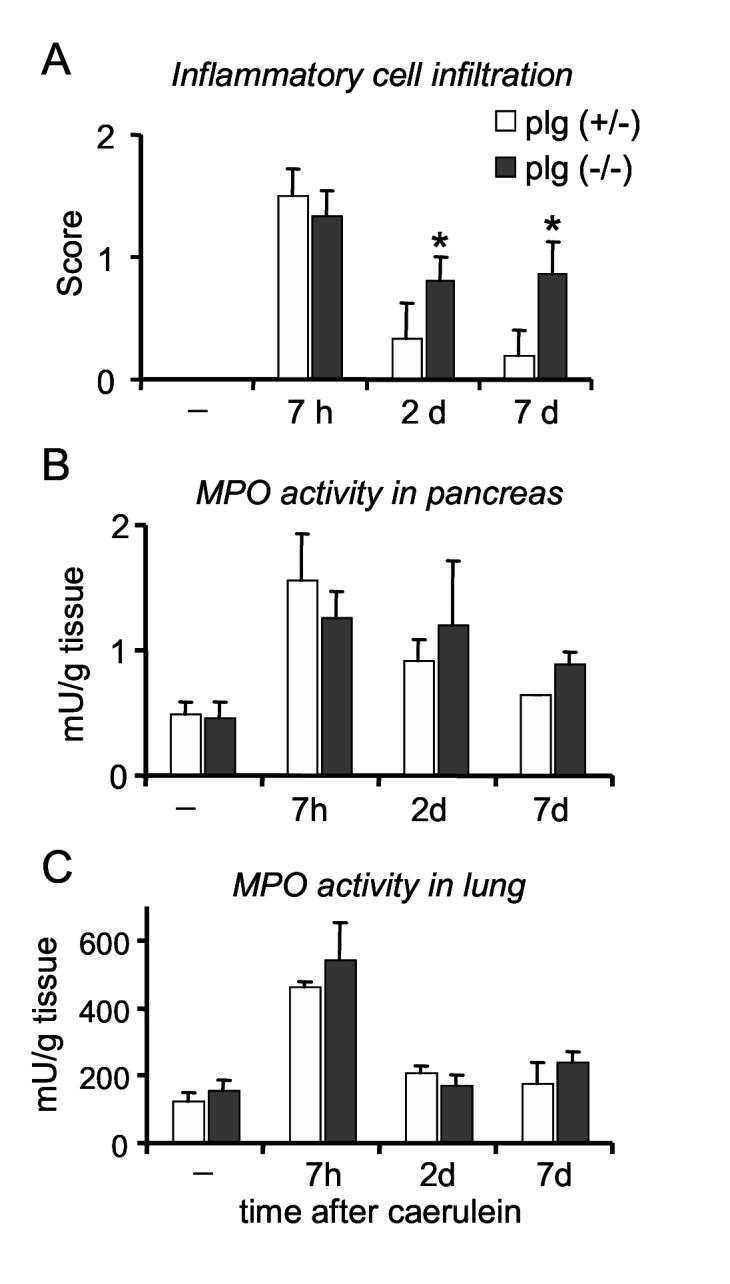
Inflammatory cell infiltration during the course of caerulein-induced pancreatitis in plg deficient and sufficient mice. (A) Quantification of inflammatory cell infiltration (neutrophils, monocytes/macrophages and lymphocytes) was performed in pancreatic tissue sections stained with H&E. Density of the total inflammatory infiltrate was scored as indicated in the Material and Methods section. Neutrophil infiltration within pancreas (B) or lungs (C) was assessed by measuring myeloperoxidase (MPO) activity in tissue homogenates and expressed as units of MPO activity per tissue weight. Results in graphs represent mean ± SEM of the values from at least 4 mice per group and time point. * P<0.05 compared to plg (+/-).
Plg does not induced acinar cell death in vitro
To further explore the potential deleterious effects of plg/plasmin on pancreatic acinar cells, we investigated whether plg affects CCK-induced acinar cell death in freshly isolated pancreatic acini. Pancreatic acini were isolated from plg sufficient mice and incubated for 4 h with supramaximal concentrations of CCK-8 (100 nmol/L), and with or without 2 μmol/L of plg, a concentration normally found in mouse blood. Acinar cell necrosis was determined by measuring lactate dehydrogenase (LDH) release into the incubation medium. Apoptosis was assessed by Western blot analysis of pro-caspase-3 (∼37 kDa) and active caspase-3 (∼17 kDa).
As illustrated in Figure 4A, supramaximal CCK-8 induced a two-fold increase in LDH release into the incubation medium. In contrast, plg administration did not affect either basal or CCK-stimulated LDH release. As we previously described 48, CCK-8 did not induce activation of caspase-3 in mouse acinar cells as measured by Western blot analysis shown in Figure 4B. Thus, plg alone or in combination with CCK-8 had no effect on procaspase-3 protein levels and did not induce cleavage of procaspase-3 to the active form. Plg activation by mouse pancreatic acini was confirmed by the appearance of plasmin activity in the conditioned medium (Figure 4C). Taken together, these data show that under the experimental conditions of our studies, acinar cell damage is associated with the deleterious effect of CCK-8 rather than the presence of activated plasmin.
Figure 4.
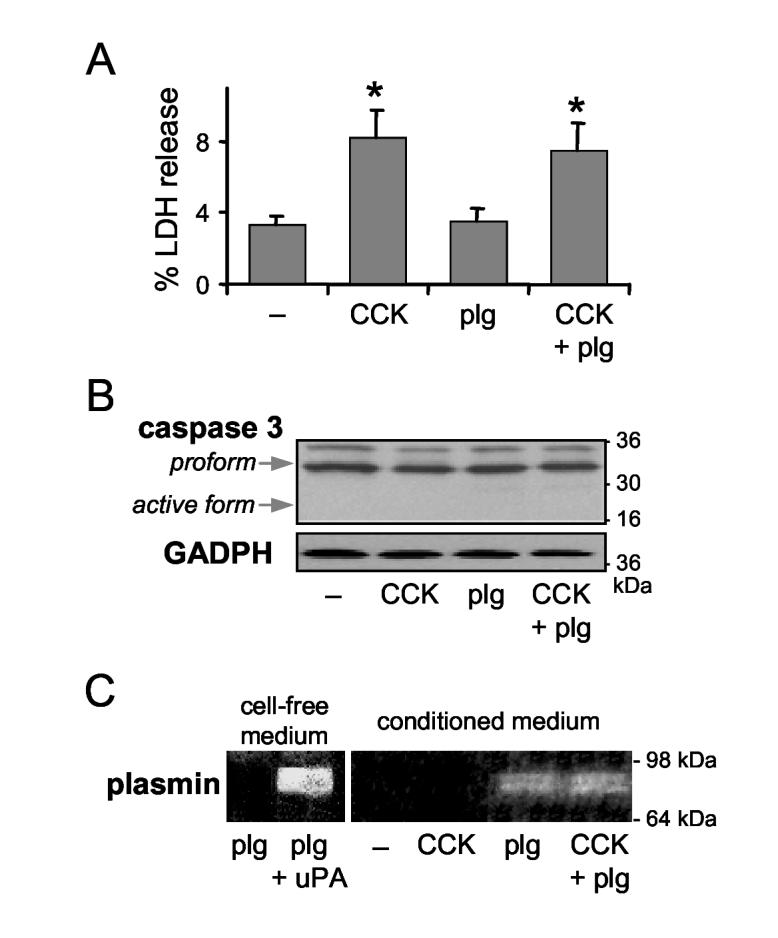
Effect of plg and CCK-8 on acinar cell death in vitro. Dispersed pancreatic acini were isolated from plg sufficient mice and incubated for 4 h without (-) and with supramaximal CCK-8 concentration (100 nmol/L), in the absence and presence of 2 μmol/L plg. (A) Cell necrosis was determined by measuring Lactate Dehydrogenase (LDH) release into the incubation medium as a percent compared with total intracellular content of LDH. Results are expressed as mean ± SEM of 3 independent cell preparations. (B) Protein expression of caspase-3 (procaspase 3, upper arrow and active caspase-3, lower arrow) was assessed by Western blot analysis. GAPDH expression was used as loading control. (C) Plasmin activity in the conditioned medium was analyzed by gelatin zymography. As internal control, left panel shows plasmin activity in cell-free medium after incubation for 30 min of 2 μmol/L plg with 1 mU/ml mouse uPA. Blots in panels (B) and (C) are representative of 3 independent cell preparations.
Plg deficiency impairs pancreas recovery following caerulein-induced pancreatitis
To explore the role of plg/plasmin on pancreas recovery following damage, we compared the course of caerulein-induced pancreatitis in plg deficient and sufficient mice. Animals were subjected to an episode of pancreatitis as indicated above, and sacrificed at 7 h, 2, 4 and 7 days after caerulein administration. Mice from both genotypes behaved similarly along the course of pancreatitis. No significant differences in body weight were found between the two groups of mice. Ratio of body weight at day 7 relative to the body weight previous to caerulein was 1.10 ± 0.01 for plg sufficient mice and 0.98 ± 0.01 for plg deficient mice (mean ± SEM). Systemic manifestations including piloerection and lethargy were mild in all caerulein-treated mice and occurred only within the first 24 h after caerulein administration. No mortality was observed in the two groups during the course of pancreatitis.
As has been extensively reported for this model of pancreatitis, pancreatic histology of plg sufficient mice recovered within seven days following caerulein administration. Histological analysis showed that 2 days after caerulein, the pancreatic parenchymal structure remained disorganized with extensive interstitial expansion, but the acinar vacuolization and edema observed during the acute phase (7 h) were completely reversed (not shown). Parenchyma structure gradually became reorganized in the following days and, by day 7 pancreas morphology was indistinguishable from saline treated mice (Figure 5, panel c).
In contrast to the results obtained with plg sufficient mice, pancreas recovery was severely impaired in plg deficient mice. The differences between the two groups of mice were manifested especially at 4 and 7 days after caerulein administration. At day 7, the predominant histological findings were the presence of areas of disorganized parenchyma structure with extensive acinar cell loss, abundant necrotic debris, and persistent presence of inflammatory cells, mainly lymphocytes and macrophages (Figure 5, panel f). These results suggest a central role for plg in pancreatic tissue repair.
Plg deficiency impairs removal of necrotic debris and acinar cell proliferation following caerulein-induced pancreatitis
We next examined in more detail acinar cell necrosis and proliferation during the course of pancreatitis. Necrosis was measured in H&E stained pancreatic sections as described in Material and Methods. Cell necrosis reflects the percentage of necrotic acinar cells and/or the percentage of the total area showing extensive necrotic cell loss and cell debris. As illustrated in Figure 6A, acinar cell necrosis was maximal during the acute phase of pancreatitis in both groups of mice. At this time point, necrotic acinar cells represent approximately 17 % of the total pancreatic area in both groups of mice. Thus, acinar cell death appears to be associated with administration of supramaximal caerulein rather than with intrapancreatic activation of plasmin. These results are in agreement with those found in isolated pancreatic acini (Figure 4).
In plg sufficient mice, the percentage of necrotic cells progressively declined during the recovery phase to values of 4.7 % at day 4 and 0 % at day 7 (Figure 6A). In contrast, pancreas from plg deficient mice exhibited persistent high values of necrosis during the recovery phase. For example, in plg deficient mice the percentage of necrotic cells during the acute phase (7 h) was 17 % of the total pancreatic area and 11 % at day 7 (Figures 6A). The persistent high necrotic values in plg deficient mice did not reflect an ongoing necrotic process but rather, to a loss of cellularity due to acinar drop out within the parenchyma and poor clearance of necrotic debris (Figure 5, panel f).
Histological analysis suggested that necrosis was the predominant mode of cell death during pancreatitis in both plg sufficient and deficient mice. Apoptotic cells, determined by TUNEL staining of formalin-fixed sections, were detected mainly at 7 hours and 2 days after caerulein, but the index of apoptosis was similarly low in plg deficient and sufficient mice. For example, during the acute phase the index of apoptosis was estimated as 4.15 ± 1.35 for plg sufficient mice and 4.5 ± 0.22 for plg deficient mice (number of apoptotic cells per 1000 cells; values represent mean ± SEM of 3 mice per group). Thus, plg deficiency did not change the pancreatic apoptotic response to caerulein administration.
In parallel with the observed loss of cellularity, plg deficient mice had an abnormal proliferative response as compared to control mice (Figure 6B). Cell proliferation was assessed in pancreatic tissue sections by immunohistochemistry using Proliferating Cell Nuclear Antigen (PCNA) as a proliferative marker. As illustrated in Figure 6B, in control mice acinar PCNA positive cells were evident at day 2, and showed maximal values of 15 % of the total acinar cells at day 7. In contrast, significant fewer PCNA-positive cells were found in plg deficient mice throughout the course of pancreatitis (Figure 6B). These low numbers of PCNA positive cells were found in areas of extensive necrosis as well as in well-preserved pancreatic sections.
In conclusion, plg deficient mice exhibited at day 7 after caerulein a reduction in functional parenchyma due to combined acinar cell loss and poor acinar cell proliferation. Accordingly, in these mice pancreatic amylase content was significantly reduced, to 76 % of basal (Figure 6C).
Plg deficiency leads to persistent inflammatory cell infiltration within the pancreas following caerulein-induced pancreatitis
To determine whether plg deficiency affects the inflammatory process during the course of caerulein-induced pancreatitis, we assessed the density of inflammatory cell (neutrophils, monocytes/macrophages and lymphocytes) infiltration by histological examination of pancreatic sections as indicated in Material and Methods. As illustrated in Figure 7A, the densities of the inflammatory infiltrate were maximal during the acute phase of pancreatitis in both groups of mice. At this time point, on the basis of histologic examination neutrophils represent the predominant inflammatory cells within the pancreas.
In control mice, the number of inflammatory cells declined rapidly during the recovery phase, to almost disappear by day 7. Only 1 out of 6 plg sufficient mice showed a mild presence of inflammatory cells at day 7. In contrast, pancreas from plg deficient mice exhibited persistent high number of inflammatory cells during recovery (Figures 7A). During this phase, lymphocytes and macrophages were the predominant inflammatory cells whereas neutrophils were rare (data not shown).
To substantiate data obtained by histologic measurements, we also monitored myeloperoxidase (MPO) activity in pancreatic tissue homogenates as an index of neutrophil infiltration. In agreement with the histologic observations, neutrophil infiltration peaked 7 h after caerulein administration in both groups of mice, to return to basal values at day 7 (Figure 7B). At day 7, MPO activity was slightly higher in plg deficient as compared with control mice but the differences did not reach statistical significance.
To determine whether plg deficiency affects the systemic inflammation associated with pancreatitis, we measured MPO activity in lung tissues. As illustrated in Figure 7C, MPO activity was similar in plg deficient and sufficient mice, suggesting that plg deficiency does not affect the systemic inflammation associated with caerulein-induced pancreatitis.
Plg deficiency leads to increased extracellular matrix deposition following caerulein-induced pancreatitis
Genetic plg deletion promotes fibrosis following experimental injury in several organs, supporting a central role for the plg system in fibrogenesis. We recently showed that inhibition of plasmin activity was associated with augmented ECM protein content in rat pancreas. 28 In the present study, we examined whether plasmin deficiency altered ECM protein deposition following pancreas damage.
Pancreatic collagen content was assessed by histologic examination of pancreatic sections stained with Masson’s Trichrome for total collagen. As illustrated in Figure 8A, pancreatic collagen levels were similar in non-treated plg sufficient and deficient mice, indicating that plg deficiency did not promote ECM deposition under basal conditions. Under these conditions, collagens were evident surrounding the pancreatic ducts and the blood vessels (Figure 8A, panels a and b) and represented, on the basis of morphometric analysis of trichrome staining, approximately 0.9% of the total pancreas area. In plg-sufficient mice at day 4, pancreatic recovery reached a maximum deposition of collagens (of approximately 1.6% of the total area) around the acini and in the interstitial areas, likely associated with tissue remodeling. This deposition was transient and the levels had subsided to a value near basal at day 7 (Figure 8A, panel c).
Figure 8.
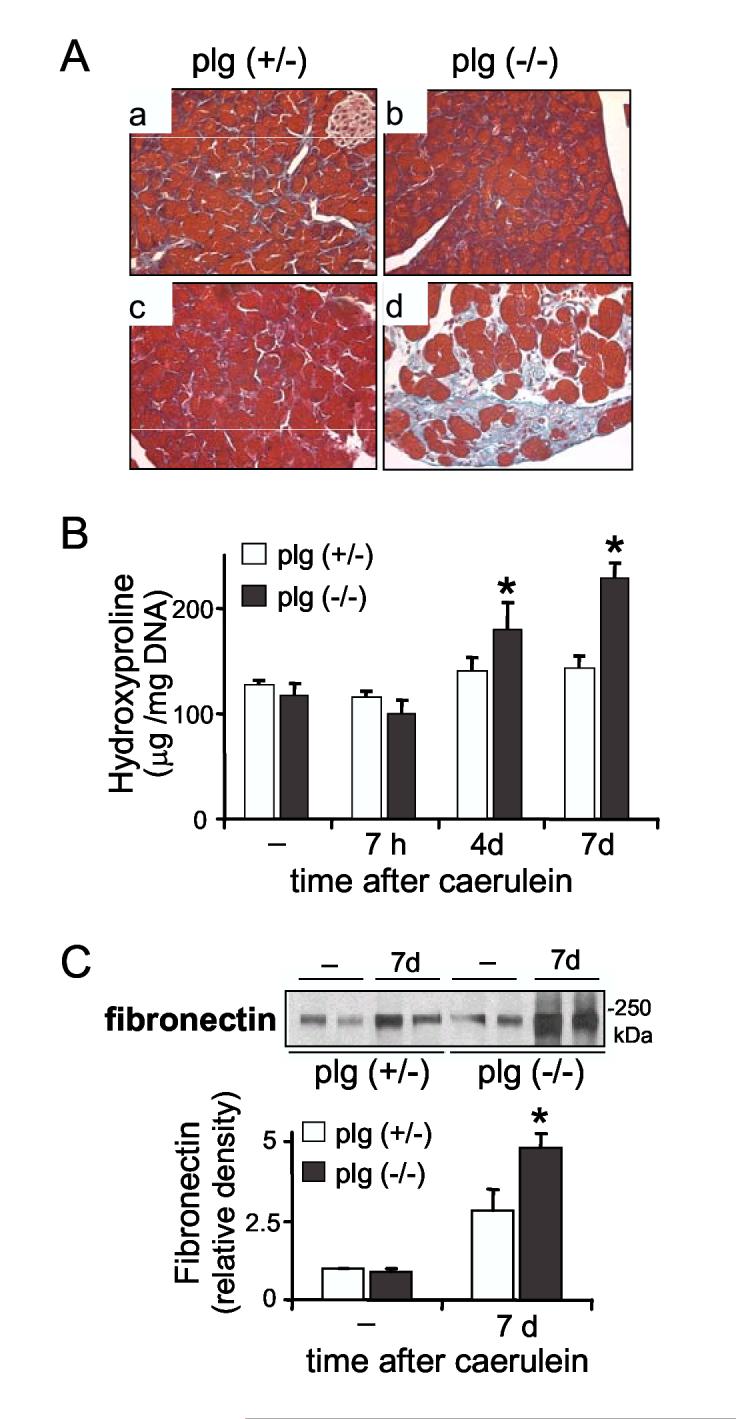
Deposition of extracellular matrix proteins in pancreas from plg deficient and sufficient mice during the course of cerulein-induced pancreatitis. (A) Panels show representative Masson’s trichrome staining in pancreatic sections from plg sufficient (a, c) and deficient mice (b, d) seven days after saline (a,b) or caerulein (c,d) administration. Collagen staining appears light blue. Magnification 400X. (B) Total collagen was determined by measuring hydroxyproline content in pancreatic homogenates (mean ± SEM, n=5-6). (C) Representative immunoblot of fibronectin expression in pancreas homogenates. Graph represents optical density of the fibronectin immunoblots relative to controls (mean ± SEM, n=6). *P<0.05 vs. plg (+/-).
In contrast with the transient deposition in control mice, collagen content progressively increased during the recovery phase in plg deficient mice (Figure 8A, panel d). Collagen fibers were accumulated mainly in necrotic, periacinar and interstitial areas. In some of these areas, collagen appeared to occupy up to 8% of the total area. Although the collagen types were not characterized in detail, reticulin staining confirmed that collagen type III was among the up-regulated collagens in plg deficient mice (data not shown).
To more uniformly quantitate the observed differences in collagen deposition between the two groups of mice, we measured hydroxyproline content in pancreatic tissue lysates. Consistent with the data shown in Figure 8A, basal levels in plg sufficient and deficient mice were similar (Figure 8B). Also shown in Figure 8B, hydroyproline measurements showed significant increases in collagen deposition during the recovery phase (up to greater than 2.4-fold by day 7) in the plg deficient mice. Taken together, these data indicate that a pronounced increase in collagen deposition occurs during recovery in the absence of plg.
Western blotting analysis of fibronectin levels indicated that, in addition to collagens, fibronectin levels were also significantly elevated in plg deficient mice as compared with control mice (Figure 8C). Thus, at day 7 fibronectin levels were augmented 5-fold over basal values in plg deficient mice but 2.6 times in control mice.
Pancreatic stellate cells were persistently activated in plg deficient mice after caerulein-induced pancreatitis
The increase in ECM deposition found in plg deficient mice following pancreas damage might reflect impaired ECM degradation associated with lack of plasmin activity and/or upregulation of ECM protein production. PSCs are considered the major ECM producing cells in pancreas 49,50. Previous studies have shown that PSCs are transiently activated in experimental models of pancreatitis in rodents and contribute to organ repair. 51,52 Therefore, we asked whether plg deficiency could modify the extent of PSC activation during the course of caerulein-induced pancreatitis.
To identify activated PSCs we performed immunostaining studies of pancreatic sections and Western blotting analysis using the cytoskeletal protein alpha-smooth muscle actin (α-SMA) as a marker. Immunostaining for α-SMA was confined mainly to the smooth muscle cells in blood vessel walls in the pancreas from saline-treated plg deficient or sufficient mice (not shown). Caerulein administration in control mice induced a transient activation of PSCs, as measured by transient increase in α-SMA (Figure 9). In these mice, scattered activated PSC could be seen at days 2 and 4 surrounding the pancreatic acini (data not shown). By day 7 α-SMA expression was reduced to a level comparable to saline-treated mice (Figure 9A, panel a, and Figure 9B). In contrast, plg deficient mice examined at day 4, and particularly at day 7, showed abundant PSCs surrounding the acini and in the interstitial areas (Figure 9A, panels b and c). These results were confirmed by Western blot analysis (Figure 9B). In sum, plg deficiency promoted persistent activation of PSCs following pancreatic injury, that presumably contributes to the fibrosing potential of the impaired ECM degradation due to plasmin deficiency.
Figure 9.

Activation of pancreatic stellate cells (PSCs) in plg sufficient and deficient mice during the course of caerulein-induced pancreatitis. Alpha-smooth muscle actin (α-SMA) was used as a marker for PSC activation. (A) Panels show representative immunohistochemistry for α-SMA (brown staining) in pancreatic sections from plg sufficient mice (a; magnification x400) and plg deficient mice (b and c; magnification x400 and x1000 respectively) at day 7 after caerulein administration. At day 7, α-SMA staining was located only around the blood vessels in plg sufficient mice (panel a), but in plg deficient mice was also observed around the acini and occasionally in the interstitial space (panels b and c). (B) α-SMA protein expression was analyzed by Western blotting. Each lane represents an individual mouse. Blot is representative of at least 4 mice per group and time point.
To examine the mechanisms leading to persistent activation of PSCs in plg deficient mice, we assessed the pancreatic levels of one of the main activators of PSC 50, the pro-fibrotic cytokine TGF-β1. Figure 10A shows levels of pancreatic active TGF-β1 determined by ELISA. Pancreatic TGF-β1 levels were comparable in basal conditions in plg sufficient and deficient mice. Early after caerulein administration (7 h), pancreatic TGF-β1 levels increased two times in both groups of mice. However, whereas TGF-β1 levels progressively decreased to basal levels in plg sufficient mice, they remained significantly elevated during the course of pancreatitis in plg deficient mice. Western blot analysis of pancreatic homogenates confirmed the results obtained for TGF-β1 by ELISA. As illustrated in Figure 10B, both active and latent forms of TGF-β1 were upregulated in pancreas from plg deficient mice at day 7. In these mice, immunostaining analysis showed TGF-β1 expression the cytoplasm and more strongly in the pericellular area of acinar cells surrounding the necrotic areas (data not shown).
Figure 10.

TGF-β1 content in pancreas from plg sufficient and deficient mice during the course of caerulein-induced pancreatitis. (A) Quantification of levels of active TGF-β1 in pancreatic homogenates by ELISA. Mice were sacrificed at the indicated times following caerulein administration. Results in graphs represent mean ± SEM of the values from five animals per group and time point. *P<0.05 vs plg (+/-). (B) Western blot analysis of TGF-β1 expression in pancreas homogenates from saline-treated (-) and caerulein-treated mice, seven days after treatment. Each lane represents an individual mouse, shown are two mice per group and treatment.
Plg deficiency promotes persistent upregulation of TIMP-1 during the recovery phase of caerulein-induced pancreatitis
Mechanisms of tissue repair involve extensive ECM remodeling that requires the participation of various families of proteases, the best known being the family of zinc-dependent matrix metalloproteinases (MMPs). Plasmin and other proteases including uPA have been associated with proteolytic activation of latent MMPs. 53,54 Therefore, we asked whether plasmin deficiency affects pancreatic levels of MMPs or their inhibitors (i.e. TIMP-1) during recovery from caerulein pancreatitis. To answer this question, we assessed levels of MMP-2 and MMP-9 by gelatin zymography. In addition, we analyzed the expression of TIMP-1 by Western blotting.
In control mice, MMP-9 was upregulated during the acute phase of pancreatitis whereas MMP-2 levels, pro- and active forms, increased later, at day 2-4 (Figure 11). Both MMP-2 and MMP-9 returned to almost basal values by day 7. In these mice, TIMP-1 expression peaked at day 4 to decrease dramatically by day 7 when the injury was resolved (Figure 11B). These results are consistent with previous reports demonstrating that TIMP-1 downregulation is critical for resolution of organ damage 55.
Figure 11.

MMP activities in pancreas from plg sufficient and deficient mice during the course of caerulein-induced pancreatitis. (A) MMP-2 and MMP-9 activities in pancreatic homogenates were analyzed by gelatin zymography (40 μg total protein/gel). Human recombinant MMP-2 and MMP-9 samples were run in the gels as positive controls. Shown is a representative zymogram from at least 4 mice per group and time point. (B) Representative Western blot analysis of TIMP-1 expression in pancreas homogenates from plg sufficient and plg deficient mice at the indicated times after caerulein (30 μg total protein/lane). GAPDH expression was measured as loading control.
Pancreatic levels of MMP-9 and MMP-2 followed in plg deficient mice the same pattern described for plg sufficient mice (Figure 11A), suggesting that plasmin is not required for MMP activation. Interestingly, pancreatic levels of MMP-2 and in less extent MMP-9 remained elevated at day 7 in plg deficient mice. In addition, TIMP-1 expression was still elevated at day 7 in these mice (Figure 11B). These higher levels of MMPs and TIMP-1 were likely associated with the persistent presence of inflammatory cells and activated PSCs at day 7. At this time point, the combine effect of plg deficiency, high levels of protease inhibitors such as PAI-1 and TIMP-1 and persistent activation of PSCs could result in an imbalance between ECM production and degradation that favors ECM accumulation.
DISCUSSION
The plasminogen (plg) system plays a critical role in ECM remodeling in numerous physiologic and pathologic processes. 39,44,56-61 Despite evidence supporting a role for the plg system in acute and chronic pancreatitis, no studies have specifically investigated whether the system participates in ECM turnover and parenchymal repair processes following pancreas injury. Here, we hypothesized that the proteolytic activity of plasmin modulates matrix turnover following pancreas injury and contributes to organ recovery. Possible mechanisms include catalytic degradation of basal membrane components and new formed ECM proteins that allows matrix remodeling and repair; removal of necrotic debris by direct protease activity or by regulation of inflammatory cell behavior; release of matrix-bound growth factors and activation of proteases and growth factors; and changes in cell-matrix interactions that affect cell behavior.
Several lines of evidence presented in this study support our hypothesis. First pancreatic plg/plasmin content and activity increase significantly during the acute phase of mouse caerulein-induced pancreatitis and remain over basal values during recovery. Second, pancreatic levels of regulatory components of the plg system-uPA, uPAR and PAI-1-also increase during acute pancreatitis. Finally and most importantly, mice deficient in plg exhibit impaired recovery following pancreatic injury. In particular, plg deficient mice presented at day 7 after caerulein administration a disorganized pancreatic parenchyma structure with areas showing abundant necrotic debris, reduced acinar cell proliferation, ECM accumulation and persistent activation of pancreatic stellate cells. All these features may result from impaired matrix degradation. 59,62,63.
Since most plg is synthesized in the liver and released to the circulation it is important to consider how it becomes activated within the pancreas during pancreatitis. Our data shows that in physiological conditions the levels of plg in pancreas are low. However, plg levels increased dramatically early after caerulein administration, remained elevated during the recovery phase of pancreatitis and returned to basal levels at day 7. Since pancreatic cells appear not produce plg, the increase in plg levels was likely due to changes in vascular permeability during acute pancreatitis. 32 Plasmin activity within the pancreas increased in a manner similar to that exhibited by plg and remained elevated above basal levels during the recovery phase. Previous reports have shown similar increases in plasmin activity during experimentally induced pancreatitis 32,33 and in acute pancreatitis in humans. 35 These data suggest that an effective plg activating system operates within the inflamed pancreas. In agreement with this, we found a significant increase in the pancreatic activity of the plg activator uPA and tPA during the entire course of pancreatitis.
In addition, we found that pancreatic levels of total PAI-1 dramatically increased during the acute phase of caerulein pancreatitis and likely limited the extent of plg activation. PAI-1 and uPA were found to form stable complexes in immunoprecipitation studies using pancreatic homogenates from acute pancreatitis mice (data not shown), supporting the concept that PAI-1 regulates uPA activation during pancreatitis and in turn, plg activation. As indicated in the Results section, our studies do not provide information as to the degree of uPA inhibition caused by PAI-1, and further studies are needed to address this question. Extensive research in other systems indicates that PAI-1 is a central regulator of the plg system during pathologic conditions. 16,64 Overexpression of PAI-1 is associated with disease progression, whereas a reduction in PAI-1 content within the injured organ is normally beneficial. 16,17 PAI-1 effects can be related to its anti-proteolytic activity, especially in those processes where plasmin or plg activators are involved. In our studies, decreases of PAI-1 in plg sufficient mice correspond with resolution of pancreatic damage whereas persistent elevation of PAI-1 in plg deficient mice correlates with decrease in uPA activation and accumulation of ECM proteins. In addition, not surprisingly, PAI-1 levels follow the same pattern of expression to that of the pro-fibrotic cytokine TGF-β1, a major activator of PAI-1 transcription. 17
In the present study, we did not explore the cell types mediating pancreatic plg activation. We previously showed that isolated rat acinar cells produce uPA and uPAR and retain pericellular plasmin activity during primary culture conditions. 28 Here, we demonstrate that isolated mouse acinar cells have also the capacity to activate plg. Friess et al reported that acinar and ductal cells produce high levels of uPA and PAI-1 during acute necrotizing pancreatitis in humans, especially those cells adjacent to necrotic areas. 37 On the basis of this localization, the authors concluded that the plg system could be involved in removal of necrotic debris. Besides parenchymal cells, endothelial cells, platelets, inflammatory cells and stellate cells are known to synthesize and secrete plg activators and PAI-1. 12,17 Therefore, each of these cell types has the potential to regulate plasmin activity at the pericellular space. The resulting plasmin activity may modulate pericellular matrix degradation, migration, proliferation and cell fate.
Our data support the notion that plg/plasmin is necessary for pancreatic recovery following caerulein-induced pancreatitis. We have not determined yet the specific mechanisms underlying the role of plasmin in the recovery process. Despite the high levels of plasmin activity found in control mice 7 h after caerulein, the severity of pancreatitis at this time point was comparable to that found in mice lacking plasmin. Histological analysis showed similar rates of necrosis and apoptosis between plg deficient and sufficient mice. In agreement with these results, plg did not affect death responses induced by CCK-8 in isolated mouse pancreatic acinar cells. In addition, although inflammatory cell recruitment is decreased in plg deficient mice in some experimental models of inflammation 53,61,65, we found no differences in the density of inflammatory infiltrate between plg deficient and sufficient mice during the acute phase of pancreatitis. Moreover, MPO activities in pancreas and lung were similar between both groups of mice. Taken together, our data suggest that plasmin activity has minor effects on the development of pancreatic injury. It was during recovery (4 and 7 days after caerulein) that we found major differences between plg deficient and sufficient mice.
Organ repair following injury requires extensive ECM remodeling with an adequate balance between ECM deposition and proteolytic clearance of ECM components. Hypothetically accumulation of matrix proteins during the initial phase of recovery should be followed by extensive matrix degradation during final recovery stages. 66 In this context, plasmin activity can be important for proteolytic clearance of necrotic debris and associated matrix components. In addition, plasmin activity can be critical for regulating the extension of the provisional matrices that form after tissue injury, either by its own ECM degrading activity or by activating other proteases. Besides a direct action on ECM protein degradation, the plg system can further modulate the fibrotic and inflammatory process by regulating growth factor and cytokine activation.
Our data indicate that plasmin is required for proper clearance of necrotic debris, a critical step in regeneration of parenchyma cells. Plg deficiency has been associated with defective removal of necrotic debris in experimental models of liver fibrosis and epithelial wound healing. 18,19,23,45,54 Although plasmin has a broad substrate specificity in vitro, its targeted substrates in vivo are not well defined. Fibrin deposition has been proposed as a critical feature in the pathologies associated with plg deficiency. 45 However, in our model fibrin deposition was negligible and did not account for the composition of the necrotic debris. Plasmin can participate in removal of necrotic debris by its own proteolytic activity. In addition, plasmin has been reported to regulate the function of neutrophils and macrophages involved in phagocytosis of necrotic debris. 67,68 In our study, we did not found differences in the recruitment of these inflammatory cells between plg sufficient and deficient mice. However, disappearance of monocytes/macrophages during recovery was impaired in plg deficient mice. Therefore, plg deficiency could affect the activity of these cells and prevent their normal function during recovery. Future studies need to examine in more detail the effects of the plg system on inflammatory cell function during pancreatitis.
Plg deficiency induced a dramatic increased in pancreatic ECM protein content with maximal values at day 7. Similar results have been reported in experimental models of damage in other organs. 18,59,60,69 ECM accumulation in plg deficient mice is likely related with reduction in ECM degradation associated with plasmin and/or with increase ECM production by persistent activated PSCs. Plasmin can participate directly in the degradation of the provisional matrices that form after tissue injury. Plasmin can degrade several ECM proteins including fibronectin and non-fibrillar collagens 11 Thus, a direct action of plasmin on ECM degradation cannot be excluded. In addition, plasmin can modulate ECM degradation by activating certain MMPs. In our study plg deficiency did not prevent the activation of MMP-2 and MMP-9, suggesting that plasmin does not contribute to the activation of these particular MMPs in caerulein-induced pancreatitis. Alternatively, it is possible that plasmin is normally involved in MMP activation but other proteases such as uPA, elastase or cathepsins could activate MMPs in the absence of plasmin.
Our results indicated that PSCs were activated in response to caerulein regardless of whether plg was present. However, whereas this activation was transient in plg sufficient mice, PSCs remained activated in plg deficient mice along the recovery phase. These results suggest that plg plays a role in the declining phase of stellate cell activation by favoring either apoptosis of PSCs or redifferentiation to a quiescent state, which is critical for organ repair. 2 Previous studies have shown that extensive ECM degradation is accompanied by apoptotic changes in activated stellate cells, as a result of either increased proapoptotic signaling or reduced survival signals from the matrix. 55,70 In this context, impaired extracellular proteolysis provides a likely explanation for the persistent PSC activation during the recovery phase of pancreatitis in plg deficient mice. Thus, our data suggests that plasmin alters the composition of the matrix or the rate of ECM degradation in the pericellular space to regulate the activation state of PSCs. Furthermore, levels of pancreatic PAI-1, TGF-β1 and TIMP-1, factors that promote stellate cell activation, 49,70 were persistently elevated in plg deficient mice but transiently in plg sufficient mice. Taken together, our results indicate that the plg system can affect stellate cell biology through multiple mechanisms. Studies in our laboratory show that cultured activated PSCs express components of the plg system and are able to activate plg at the cell surface (data not shown). We are currently examining in more detail the effects of plg/plasmin in PSC biology.
Taken together, the results of the present study demonstrate that the plg system plays a key role during the tissue repair process following pancreatic injury. Plg deficiency leads to a pathological condition of impaired pancreatic recovery where the damage tissue is locked into a state of persistent inflammation and high deposition of ECM proteins. Appropriate levels of proteolytic plasmin activity may be required during the phase when a provisional matrix is deposited within the injured parenchyma. At this step, a coordinated balance between ECM degradation and production is critical to restore organ architecture. Further, apropriate levels of plg activators and inhibitors i.e. PAI-1 are central to provide proper plg activation at the pericellular area of the target cells. A better understanding of the ECM-degrading proteolytic systems including the plg system during tissue repair processes and fibrogenesis is critical in the treatment and/or prevention of chronic pancreatitis.
Acknowledgments
We are grateful to Dr JL Degen for providing the initial breeding pairs of plasminogen knockout mice. This work was supported by the Department of Veterans Affairs and the Research Center for Alcoholic Liver and Pancreatic Diseases (P50-A11999) funded by the National Institute on Alcohol Abuse and Alcoholism and NIH grant AA015781 (to AL). We also acknowledge the Morphology Core facilities of the NIAAA-supported Research Center for Alcoholic Liver and Pancreatic Diseases (P50-A11999) for providing morphological analyses of pancreatic tissues.
Footnotes
- ECM
- extracellular matrix
- MMPs
- matrix metalloproteinases
- PAI-1
- plasminogen activator inhibitor 1
- plg
- plasminogen
- PSCs
- pancreatic stellate cells
- TIMP-1
- tissue inhibitor of metalloproteinases 1
- uPA
- urokinase-type plasminogen activator.
References
- 1.Etemad B, Whitcomb DC. Chronic pancreatitis: diagnosis, classification, and new genetic developments. Gastroenterology. 2001;120:682–707. doi: 10.1053/gast.2001.22586. [DOI] [PubMed] [Google Scholar]
- 2.Bataller R, Brenner DA. Liver fibrosis. J Clin Invest. 2005;115:209–218. doi: 10.1172/JCI24282. [DOI] [PMC free article] [PubMed] [Google Scholar]
- 3.Lieber CS. Biochemical mechanisms of alcohol-induced hepatic injury. Alcohol Alcohol Suppl. 1991;1:283–290. [PubMed] [Google Scholar]
- 4.Lieber CS. Ethanol metabolism, cirrhosis and alcoholism. Clin Chim Acta. 1997;257:59–84. doi: 10.1016/s0009-8981(96)06434-0. [DOI] [PubMed] [Google Scholar]
- 5.Neubauer K, Knittel T, Armbrust T, Ramadori G. Accumulation and cellular localization of fibrinogen/fibrin during short-term and long-term rat liver injury. Gastroenterology. 1995;108:1124–1135. doi: 10.1016/0016-5085(95)90211-2. [DOI] [PubMed] [Google Scholar]
- 6.Brenner DA, Waterboer T, Choi SK, Lindquist JN, Stefanovic B, Burchardt E, Yamauchi M, Gillan A, Rippe RA. New aspects of hepatic fibrosis. J Hepatol. 2000;32:32–38. doi: 10.1016/s0168-8278(00)80413-4. [DOI] [PubMed] [Google Scholar]
- 7.Stetler-Stevenson WG. Dynamics of matrix turnover during pathologic remodeling of the extracellular matrix. Am J Pathol. 1996;148:1345–1350. [PMC free article] [PubMed] [Google Scholar]
- 8.Parks WC. A confederacy of proteinases. J Clin Invest. 2002;110:613–614. doi: 10.1172/JCI16550. [DOI] [PMC free article] [PubMed] [Google Scholar]
- 9.Nagase H, Woessner JF., Jr. Matrix metalloproteinases. J Biol Chem. 1999;274:21491–21494. doi: 10.1074/jbc.274.31.21491. [DOI] [PubMed] [Google Scholar]
- 10.Collen D. The plasminogen (fibrinolytic) system. Thromb Haemost. 1999;82:259–270. [PubMed] [Google Scholar]
- 11.Plow EF, Hoover-Plow J. The functions of plasminogen in cardiovascular disease. Trends Cardiovasc Med. 2004;14:180–186. doi: 10.1016/j.tcm.2004.04.001. [DOI] [PubMed] [Google Scholar]
- 12.Blasi F. Proteolysis, cell adhesion, chemotaxis, and invasiveness are regulated by the u-PA-u-PAR-PAI-1 system. Thromb Haemost. 1999;82:298–304. [PubMed] [Google Scholar]
- 13.Takeuchi T, Harris JL, Huang W, Yan KW, Coughlin SR, Craik CS. Cellular localization of membrane-type serine protease 1 and identification of protease-activated receptor-2 and single-chain urokinase-type plasminogen activator as substrates. J Biol Chem. 2000;275:26333–26342. doi: 10.1074/jbc.M002941200. [DOI] [PubMed] [Google Scholar]
- 14.Mondino A, Blasi F. uPA and uPAR in fibrinolysis, immunity and pathology. Trends Immunol. 2004;25:450–455. doi: 10.1016/j.it.2004.06.004. [DOI] [PubMed] [Google Scholar]
- 15.Blasi F, Carmeliet P. uPAR: a versatile signalling orchestrator. Nat Rev Mol Cell Biol. 2002;3:932–943. doi: 10.1038/nrm977. [DOI] [PubMed] [Google Scholar]
- 16.Lijnen HR. Pleiotropic functions of plasminogen activator inhibitor-1. J Thromb Haemost. 2005;3:35–45. doi: 10.1111/j.1538-7836.2004.00827.x. [DOI] [PubMed] [Google Scholar]
- 17.Binder BR, Christ G, Gruber F, Grubic N, Hufnagl P, Krebs M, Mihaly J, Prager GW. Plasminogen activator inhibitor 1: physiological and pathophysiological roles. News Physiol Sci. 2002;17:56–61. doi: 10.1152/nips.01369.2001. [DOI] [PubMed] [Google Scholar]
- 18.Ng VL, Sabla GE, Melin-Aldana H, Kelley-Loughnane N, Degen JL, Bezerra JA. Plasminogen deficiency results in poor clearance of non-fibrin matrix and persistent activation of hepatic stellate cells after an acute injury. J Hepatol. 2001;35:781–789. doi: 10.1016/s0168-8278(01)00212-4. [DOI] [PubMed] [Google Scholar]
- 19.Pohl JF, Melin-Aldana H, Sabla G, Degen JL, Bezerra JA. Plasminogen deficiency leads to impaired lobular reorganization and matrix accumulation after chronic liver injury. Am J Pathol. 2001;159:2179–2186. doi: 10.1016/S0002-9440(10)63069-6. [DOI] [PMC free article] [PubMed] [Google Scholar]
- 20.Swaisgood CM, French EL, Noga C, Simon RH, Ploplis VA. The development of bleomycin-induced pulmonary fibrosis in mice deficient for components of the fibrinolytic system. Am J Pathol. 2000;157:177–187. doi: 10.1016/S0002-9440(10)64529-4. [DOI] [PMC free article] [PubMed] [Google Scholar]
- 21.Rakic JM, Lambert V, Munaut C, Bajou K, Peyrollier K, Alvarez-Gonzalez ML, Carmeliet P, Foidart JM, Noel A. Mice without uPA, tPA, or plasminogen genes are resistant to experimental choroidal neovascularization. Invest Ophthalmol Vis Sci. 2003;44:1732–1739. doi: 10.1167/iovs.02-0809. [DOI] [PubMed] [Google Scholar]
- 22.Ploplis VA, Carmeliet P, Vazirzadeh S, Van V I, Moons L, Plow EF, Collen D. Effects of disruption of the plasminogen gene on thrombosis, growth, and health in mice. Circulation. 1995;92:2585–2593. doi: 10.1161/01.cir.92.9.2585. [DOI] [PubMed] [Google Scholar]
- 23.Romer J, Bugge TH, Pyke C, Lund LR, Flick MJ, Degen JL, Dano K. Impaired wound healing in mice with a disrupted plasminogen gene. Nat Med. 1996;2:287–292. doi: 10.1038/nm0396-287. [DOI] [PubMed] [Google Scholar]
- 24.Hattori N, Degen JL, Sisson TH, Liu H, Moore BB, Pandrangi RG, Simon RH, Drew AF. Bleomycin-induced pulmonary fibrosis in fibrinogen-null mice. J Clin Invest. 2000;106:1341–1350. doi: 10.1172/JCI10531. [DOI] [PMC free article] [PubMed] [Google Scholar]
- 25.Yang J, Shultz RW, Mars WM, Wegner RE, Li Y, Dai C, Nejak K, Liu Y. Disruption of tissue-type plasminogen activator gene in mice reduces renal interstitial fibrosis in obstructive nephropathy. J Clin Invest. 2002;110:1525–1538. doi: 10.1172/JCI16219. [DOI] [PMC free article] [PubMed] [Google Scholar]
- 26.Lijnen HR. Extracellular proteolysis in the development and progression of atherosclerosis. Biochem Soc Trans. 2002;30:163–167. doi: 10.1042/. [DOI] [PubMed] [Google Scholar]
- 27.Paciucci R, Vila MR, Adell T, Diaz VM, Tora M, Nakamura T, Real FX. Activation of the urokinase plasminogen activator/urokinase plasminogen activator receptor system and redistribution of E-cadherin are associated with hepatocyte growth factor-induced motility of pancreas tumor cells overexpressing Met. Am J Pathol. 1998;153:201–212. doi: 10.1016/S0002-9440(10)65561-7. [DOI] [PMC free article] [PubMed] [Google Scholar]
- 28.Lugea A, Gukovsky I, Gukovskaya AS, Pandol SJ. Non-oxidative ethanol metabolites alter extracellular matrix protein content in rat pancreas. Gastroenterology. 2003:126. doi: 10.1053/j.gastro.2003.09.021. [DOI] [PubMed] [Google Scholar]
- 29.Paciucci R, Tora M, Diaz VM, Real FX. The plasminogen activator system in pancreas cancer: role of t-PA in the invasive potential in vitro. Oncogene. 1998;16:625–633. doi: 10.1038/sj.onc.1201564. [DOI] [PubMed] [Google Scholar]
- 30.Cantero D, Friess H, Deflorin J, Zimmermann A, Brundler MA, Riesle E, Korc M, Buchler MW. Enhanced expression of urokinase plasminogen activator and its receptor in pancreatic carcinoma. Br J Cancer. 1997;75:388–395. doi: 10.1038/bjc.1997.63. [DOI] [PMC free article] [PubMed] [Google Scholar]
- 31.Han H, Bearss DJ, Browne LW, Calaluce R, Nagle RB, Von Hoff DD. Identification of differentially expressed genes in pancreatic cancer cells using cDNA microarray. Cancer Res. 2002;62:2890–2896. [PubMed] [Google Scholar]
- 32.Chen HM, Sunamura M, Shibuya K, Yamauchi JI, Sakai Y, Fukuyama S, Mikami Y, Takeda K, Matsuno S. Early microcirculatory derangement in mild and severe pancreatitis models in mice. Surg Today. 2001;31:634–642. doi: 10.1007/s005950170098. [DOI] [PubMed] [Google Scholar]
- 33.Kruse P, Lasson A, Hage E. Proteases and protease inhibitors in cerulein-induced acute pancreatitis in rats. J Surg Res. 1999;85:294–300. doi: 10.1006/jsre.1999.5609. [DOI] [PubMed] [Google Scholar]
- 34.Lasson A, Ohlsson K. Disseminated intravascular coagulation and antiprotease activity in acute human pancreatitis. Scand J Gastroenterol Suppl. 1986;126:35–39. doi: 10.3109/00365528609091890. [DOI] [PubMed] [Google Scholar]
- 35.Segal I, Chaloner C, Douglas J, John KD, Zaidi A, Cotter L, Appelros S, Borgstrom A, Braganza JM. Acute pancreatitis in Soweto, South Africa: relationship between trypsinogen load, trypsinogen activation, and fibrinolysis. Am J Gastroenterol. 2002;97:883–892. doi: 10.1111/j.1572-0241.2002.05604.x. [DOI] [PubMed] [Google Scholar]
- 36.Ji B, Chen XQ, Misek DE, Kuick R, Hanash S, Ernst S, Najarian R, Logsdon CD. Pancreatic gene expression during the initiation of acute pancreatitis: identification of EGR-1 as a key regulator. Physiol Genomics. 2003;14:59–72. doi: 10.1152/physiolgenomics.00174.2002. [DOI] [PubMed] [Google Scholar]
- 37.Friess H, Duarte R, Kleeff J, Fukuda A, Tang WH, Graber H, Schilling M, Zimmermann A, Korc M, Buchler MW. The plasminogen activator/plasmin system is up-regulated after acute necrotizing pancreatitis in human beings. Surgery. 1998;124:79–86. [PubMed] [Google Scholar]
- 38.Friess H, Cantero D, Graber H, Tang WH, Guo X, Kashiwagi M, Zimmermann A, Gold L, Korc M, Buchler MW. Enhanced urokinase plasminogen activation in chronic pancreatitis suggests a role in its pathogenesis. Gastroenterology. 1997;113:904–913. doi: 10.1016/s0016-5085(97)70186-0. [DOI] [PubMed] [Google Scholar]
- 39.Bugge TH, Flick MJ, Daugherty CC, Degen JL. Plasminogen deficiency causes severe thrombosis but is compatible with development and reproduction. Genes Dev. 1995;9:794–807. doi: 10.1101/gad.9.7.794. [DOI] [PubMed] [Google Scholar]
- 40.Vasseur S, Folch-Puy E, Hlouschek V, Garcia S, Fiedler F, Lerch MM, Dagorn JC, Closa D, Iovanna JL. p8 improves pancreatic response to acute pancreatitis by enhancing the expression of the anti-inflammatory protein pancreatitis-associated protein I. J Biol Chem. 2004;279:7199–7207. doi: 10.1074/jbc.M309152200. [DOI] [PubMed] [Google Scholar]
- 41.Vaquero E, Gukovsky I, Zaninovic V, Gukovskaya AS, Pandol SJ. Localized pancreatic NF-kappaB activation and inflammatory response in taurocholate-induced pancreatitis. Am J Physiol Gastrointest Liver Physiol. 2001;280:G1197–G1208. doi: 10.1152/ajpgi.2001.280.6.G1197. [DOI] [PubMed] [Google Scholar]
- 42.Folch E, Closa D, Prats N, Gelpi E, Rosello-Catafau J. Leukotriene generation and neutrophil infiltration after experimental acute pancreatitis. Inflammation. 1998;22:83–93. doi: 10.1023/a:1022399824880. [DOI] [PubMed] [Google Scholar]
- 43.Labarca C, Paigen K. A simple, rapid, and sensitive DNA assay procedure. Anal Biochem. 1980;102:344–352. doi: 10.1016/0003-2697(80)90165-7. [DOI] [PubMed] [Google Scholar]
- 44.Goguen JD, Bugge T, Degen JL. Role of the pleiotropic effects of plasminogen deficiency in infection experiments with plasminogen-deficient mice. Methods. 2000;21:179–183. doi: 10.1006/meth.2000.0989. [DOI] [PubMed] [Google Scholar]
- 45.Bugge TH, Kombrinck KW, Flick MJ, Daugherty CC, Danton MJ, Degen JL. Loss of fibrinogen rescues mice from the pleiotropic effects of plasminogen deficiency. Cell. 1996;87:709–719. doi: 10.1016/s0092-8674(00)81390-2. [DOI] [PubMed] [Google Scholar]
- 46.Lahteenmaki K, Kuusela P, Korhonen TK. Bacterial plasminogen activators and receptors. FEMS Microbiol Rev. 2001;25:531–552. doi: 10.1111/j.1574-6976.2001.tb00590.x. [DOI] [PubMed] [Google Scholar]
- 47.Zhou A, Huntington JA, Pannu NS, Carrell RW, Read RJ. How vitronectin binds PAI-1 to modulate fibrinolysis and cell migration. Nat Struct Biol. 2003;10:541–544. doi: 10.1038/nsb943. [DOI] [PubMed] [Google Scholar]
- 48.Mareninova OA, Sung KF, Hong P, Lugea A, Pandol SJ, Gukovsky I, Gukovskaya AS. Cell death in pancreatitis: caspases protect from necrotizing pancreatitis. J Biol Chem. 2006;281:3370–3381. doi: 10.1074/jbc.M511276200. [DOI] [PubMed] [Google Scholar]
- 49.Apte MV, Haber PS, Darby SJ, Rodgers SC, McCaughan GW, Korsten MA, Pirola RC, Wilson JS. Pancreatic stellate cells are activated by proinflammatory cytokines: implications for pancreatic fibrogenesis. Gut. 1999;44:534–541. doi: 10.1136/gut.44.4.534. [DOI] [PMC free article] [PubMed] [Google Scholar]
- 50.Schneider E, Schmid-Kotsas A, Zhao J, Weidenbach H, Schmid RM, Menke A, Adler G, Waltenberger J, Grunert A, Bachem MG. Identification of mediators stimulating proliferation and matrix synthesis of rat pancreatic stellate cells. Am J Physiol Cell Physiol. 2001;281:C532–C543. doi: 10.1152/ajpcell.2001.281.2.C532. [DOI] [PubMed] [Google Scholar]
- 51.Yokota T, Denham W, Murayama K, Pelham C, Joehl R, Bell RH., Jr. Pancreatic stellate cell activation and MMP production in experimental pancreatic fibrosis. J Surg Res. 2002;104:106–111. doi: 10.1006/jsre.2002.6403. [DOI] [PubMed] [Google Scholar]
- 52.Zimmermann A, Gloor B, Kappeler A, Uhl W, Friess H, Buchler MW. Pancreatic stellate cells contribute to regeneration early after acute necrotising pancreatitis in humans. Gut. 2002;51:574–578. doi: 10.1136/gut.51.4.574. [DOI] [PMC free article] [PubMed] [Google Scholar]
- 53.Liu Z, Li N, Diaz LA, Shipley M, Senior RM, Werb Z. Synergy between a plasminogen cascade and MMP-9 in autoimmune disease. J Clin Invest. 2005;115:879–887. doi: 10.1172/JCI23977. [DOI] [PMC free article] [PubMed] [Google Scholar]
- 54.Solberg H, Rinkenberger J, Dano K, Werb Z, Lund LR. A functional overlap of plasminogen and MMPs regulates vascularization during placental development. Development. 2003;130:4439–4450. doi: 10.1242/dev.00642. [DOI] [PMC free article] [PubMed] [Google Scholar]
- 55.Benyon RC, Arthur MJ. Extracellular matrix degradation and the role of hepatic stellate cells. Semin Liver Dis. 2001;21:373–384. doi: 10.1055/s-2001-17552. [DOI] [PubMed] [Google Scholar]
- 56.Carmeliet P, Schoonjans L, Kieckens L, Ream B, Degen J, Bronson R, De Vos R, van den Oord JJ, Collen D, Mulligan RC. Physiological consequences of loss of plasminogen activator gene function in mice. Nature. 1994;368:419–424. doi: 10.1038/368419a0. [DOI] [PubMed] [Google Scholar]
- 57.Kao WW, Kao CW, Kaufman AH, Kombrinck KW, Converse RL, Good WV, Bugge TH, Degen JL. Healing of corneal epithelial defects in plasminogen- and fibrinogen-deficient mice. Invest Ophthalmol Vis Sci. 1998;39:502–508. [PubMed] [Google Scholar]
- 58.Nagai N, De Mol M, Lijnen HR, Carmeliet P, Collen D. Role of plasminogen system components in focal cerebral ischemic infarction: a gene targeting and gene transfer study in mice. Circulation. 1999;99:2440–2444. doi: 10.1161/01.cir.99.18.2440. [DOI] [PubMed] [Google Scholar]
- 59.Bezerra JA, Bugge TH, Melin-Aldana H, Sabla G, Kombrinck KW, Witte DP, Degen JL. Plasminogen deficiency leads to impaired remodeling after a toxic injury to the liver. Proc Natl Acad Sci U S A. 1999;96:15143–15148. doi: 10.1073/pnas.96.26.15143. [DOI] [PMC free article] [PubMed] [Google Scholar]
- 60.Bezerra JA, Currier AR, Melin-Aldana H, Sabla G, Bugge TH, Kombrinck KW, Degen JL. Plasminogen activators direct reorganization of the liver lobule after acute injury. Am J Pathol. 2001;158:921–929. doi: 10.1016/S0002-9440(10)64039-4. [DOI] [PMC free article] [PubMed] [Google Scholar]
- 61.Ploplis VA, French EL, Carmeliet P, Collen D, Plow EF. Plasminogen deficiency differentially affects recruitment of inflammatory cell populations in mice. Blood. 1998;91:2005–2009. [PubMed] [Google Scholar]
- 62.Arthur MJ. Fibrosis and altered matrix degradation. Digestion. 1998;59:376–380. doi: 10.1159/000007492. [DOI] [PubMed] [Google Scholar]
- 63.Bentrem DJ, Joehl RJ. Pancreas: healing response in critical illness. Crit Care Med. 2003;31:S582–S589. doi: 10.1097/01.CCM.0000081428.35729.73. [DOI] [PubMed] [Google Scholar]
- 64.Hertig A, Rondeau E. Plasminogen activator inhibitor type 1: the two faces of the same coin. Curr Opin Nephrol Hypertens. 2004;13:39–44. doi: 10.1097/00041552-200401000-00006. [DOI] [PubMed] [Google Scholar]
- 65.Edgtton KL, Gow RM, Kelly DJ, Carmeliet P, Kitching AR. Plasmin is not protective in experimental renal interstitial fibrosis. Kidney Int. 2004;66:68–76. doi: 10.1111/j.1523-1755.2004.00707.x. [DOI] [PubMed] [Google Scholar]
- 66.Duffield JS, Forbes SJ, Constandinou CM, Clay S, Partolina M, Vuthoori S, Wu S, Lang R, Iredale JP. Selective depletion of macrophages reveals distinct, opposing roles during liver injury and repair. J Clin Invest. 2005;115:56–65. doi: 10.1172/JCI22675. [DOI] [PMC free article] [PubMed] [Google Scholar]
- 67.Gyetko MR, Aizenberg D, Mayo-Bond L. Urokinase-deficient and urokinase receptor-deficient mice have impaired neutrophil antimicrobial activation in vitro. J Leukoc Biol. 2004;76:648–656. doi: 10.1189/jlb.0104023. [DOI] [PubMed] [Google Scholar]
- 68.Syrovets T, Jendrach M, Rohwedder A, Schule A, Simmet T. Plasmin-induced expression of cytokines and tissue factor in human monocytes involves AP-1 and IKKbeta-mediated NF-kappaB activation. Blood. 2001;97:3941–3950. doi: 10.1182/blood.v97.12.3941. [DOI] [PubMed] [Google Scholar]
- 69.Kaikita K, Fogo AB, Ma L, Schoenhard JA, Brown NJ, Vaughan DE. Plasminogen activator inhibitor-1 deficiency prevents hypertension and vascular fibrosis in response to long-term nitric oxide synthase inhibition. Circulation. 2001;104:839–844. doi: 10.1161/hc3301.092803. [DOI] [PubMed] [Google Scholar]
- 70.Issa R, Zhou X, Constandinou CM, Fallowfield J, Millward-Sadler H, Gaca MD, Sands E, Suliman I, Trim N, Knorr A, Arthur MJ, Benyon RC, Iredale JP. Spontaneous recovery from micronodular cirrhosis: evidence for incomplete resolution associated with matrix cross-linking. Gastroenterology. 2004;126:1795–1808. doi: 10.1053/j.gastro.2004.03.009. [DOI] [PubMed] [Google Scholar]