

Abstract
Circadian singularity behavior (also called suppression of circadian rhythms) is a phenomenon characterized by the abolishment of circadian rhythmicities by a critical stimulus. Here we demonstrate that both temperature step up and light pulse, stimuli that activate the expression of the Neurospora circadian clock gene frequency (frq), can trigger singularity behavior in this organism. The arrhythmicity is transient and is followed by the resumption of rhythm in randomly distributed phases. In addition, we show that induction of FRQ expression alone can trigger singularity behavior, indicating that FRQ is a state variable of the Neurospora circadian oscillator. Furthermore, mutations of frq lead to changes in the amplitude of FRQ oscillation, which determines the sensitivity of the clock to phase-resetting cues. Our results further suggest that the singularity behavior is due to the loss of rhythm in all cells. Together, these data suggest that the singularity behavior is due to a circadian negative feedback loop driven to a steady state after the critical treatment. After the initial arrhythmicity, cell populations are then desynchronized.
Keywords: entrainment, feedback loop, frequency, singularity, temperature
Introduction
One of the most mysterious phenomena of circadian rhythms is that robust rhythmicities can be abolished after a phase-resetting stimulus, such as light and drug exposures, when given at an appropriate time with the right dosage. This phenomenon is called singularity behavior, also known as suppression of circadian rhythms. Since its discovery in Drosophila pseudoobscura by Winfree more than 35 years ago (Winfree, 1970), singularity behavior has been shown in algae, insects, plants and mammals (Engelmann et al, 1978; Winfree, 1980; Taylor et al, 1982; Jewett et al, 1991; Johnson and Kondo, 1992; Honma and Honma, 1999; Covington et al, 2001), suggesting that it is a shared phenomenon among all circadian clocks. However, the molecular clock mechanism for singularity behavior is not known.
Attempts to explain the phase-resetting and singularity behavior in circadian clocks utilizing limit cycle-based mathematical models have been made (Petersen, 1980; Winfree, 1980; Lakin-Thomas, 1995; Johnson, 1999; Leloup et al, 1999; Leloup and Goldbeter, 2001; Johnson et al, 2003). Similarly, the singularity behavior strongly suggests that the circadian oscillators are limit cycle-based. In a simplified limit cycle model with two state variables, the circadian oscillator cycles with its preferred amplitude in constant conditions and the values of the two variables determine the phase (isochron) of the oscillation (Figure 1A) (Johnson, 1999; Johnson et al, 2003). The center point where all the isochrons intersect is the singularity point, which is regarded as phaseless. A strong stimulus (upper arrow in Figure 1A) can change the state variable(s) across the singularity point, leading to strong (type 0) phase resetting, while a weak stimulus (lower arrow in Figure 1A) results in weak type 1 phase resetting. However, if the stimulus is applied at an appropriate time with the right strength (the center arrow in Figure 1A), the clock can then be sent to the singularity point, where the clock becomes phaseless and arrhythmic. Despite our current understanding of circadian clocks, the molecular mechanism for singularity behavior is not known. Furthermore, it is not known whether the arrhythmic behavior after the critical stimulus is caused by the desynchronization of the cell population, or due to the loss of rhythm in all cells (Winfree, 1980; Leloup and Goldbeter, 2001).
Figure 1.
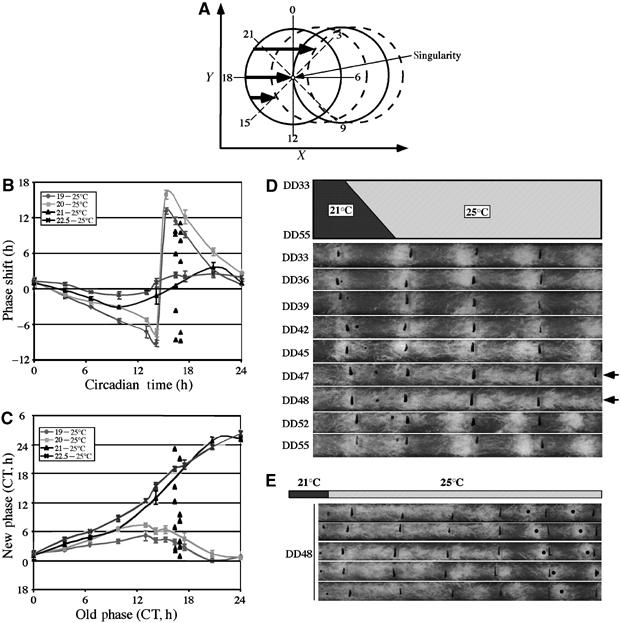
Singularity behavior of the Neurospora circadian conidiation rhythms induced by a temperature step up. (A) A limit cycle model explaining clock resetting behavior. The circle in the middle represent a hypothetical limit cycle of the oscillator in constant condition, whereas other circles indicate the clock resetting curves after stimuli of different strength at different time points. Bold arrows indicate stimuli of different strength that can increase of the level of state variable X. The CT, the shape of the limit cycle and the time point when singularity behavior occurs in this model are hypothetical and not based on experimental data. (B, C) PRCs (B) and PTCs (C) for different temperature step ups. For 21–25°C temperature step up, the phase shifts (B) or the new phases (C) of individual race tubes for DD47 and DD48 are shown. A wild-type Neurospora strain was used in these experiments. (D) Race tube assays showing that a 21–25°C temperature step up induced arrhythmicity at around DD48. The black lines on race tubes mark the growth fronts of Neurospora every 24 h. (E) Race tube assays showing the random distribution of phases after the singularity behavior.
The eukaryotic circadian oscillators are thought to be based on autoregulatory circadian negative feedback loops (Dunlap, 1999; Young and Kay, 2001). In the filamentous fungus Neurospora crassa, the core circadian oscillator consists of a circadian negative feedback loop in which two known protein complexes function as the positive and the negative elements of the loop (Dunlap, 2006; Heintzen and Liu, 2006; Liu and Bell-Pedersen, 2006). In constant darkness (DD), WHITE COLLAR-1 (WC-1) and WC-2 form heterodimeric complexes (WCC) which in turn activate the transcription of the frequency (FRQ) gene through the binding of its promoter (Crosthwaite et al, 1997; Cheng et al, 2001; Froehlich et al, 2003). In turn, FRQ and FRH, a FRQ-interacting RNA helicase, form a complex (FFC) that is able to inhibit the WCC activity by promoting the phosphorylation of WC proteins mediated by CKI and CKII (Aronson et al, 1994a; Cheng et al, 2005; He and Liu, 2005; He et al, 2005, 2006; Schafmeier et al, 2005). FRQ is the limiting factor in the FFC, indicating that the level of FRQ determines the amounts of FFC in cells. Several delays exist in this negative feedback loop, including frq transcription and translation, inhibition of WCC activity by FFC as well as the phosphorylation-dependent FRQ degradation process (Liu et al, 2000; Yang et al, 2002; He et al, 2003). These delays temporally separate different processes in the feedback loop, allowing robust circadian rhythm of frq expression and circadian rhythmicities to persist in DD (Aronson et al, 1994a; Garceau et al, 1997). As a result, the levels of FRQ and its phosphorylation profiles determine the time of the day in a circadian cycle. Light and temperature, two of the most important time cues for circadian clocks, are able to change FRQ expression and reset the Neurospora clock (Crosthwaite et al, 1995; Liu et al, 1998; Liu, 2003). Despite the importance of frq in the circadian clock, it is still debated whether it is a central component of the Neurospora circadian clock (Heintzen and Liu, 2006).
Results
A temperature step up can trigger singularity behavior
A previous study using temperature treatments has suggested the existence of circadian singular behavior in Neurospora (Gooch et al, 1994). To demonstrate clear circadian singularity behavior in a wild-type Neurospora strain, we performed a series of temperature step up experiments by shifting cultures to different temperatures at various time points during an entire circadian cycle using race tube assays (Figure 1). Temperature step up within the ambient temperature range has been shown to reliably phase shift the Neurospora circadian clock and induce the expression of FRQ (Gooch et al, 1994; Liu et al, 1998). Wild-type cultures grown on race tubes at one temperature in DD were transferred to another temperature at different time points. As shown in Figure 1B (phase response curve, PRC) and Figure 1C (phase transition curve, PTC), both 19–25°C and 20–25°C temperature changes resulted in strong type 0 phase resetting of the circadian conidiation rhythms. On the other hand, 22.5–25°C step up only led to weak type 1 phase resetting. The break point of phase delay to advance of these PRCs are around circadian time (CT)16. Thus, singularity behavior, if it exists in Neurospora, should be observed at around this time using a 2.5–5°C temperature step.
When temperature step up from 21°C to 25°C was performed, arrhythmic conidiation was consistently observed at around DD47–48 (∼CT17) following the treatment (Figure 1D). Importantly, whereas robust conidiation rhythms were observed for all other time points after the step up, arrhythmicity was only seen within a 1–2 h window around this phase, indicating the singularity behavior of the Neurospora circadian clock. Also as expected, the PRC and PTC of the 21–25°C temperature step up for other time points are between those of type 0 and type 1 resetting (Figure 1B and C). Singularity behavior was also observed at around CT17 for the same treatment given one circadian cycle earlier (DD25–26) or later (∼DD70) (data not shown), indicating that this is a clock-specific phenomenon and not due to some developmental event. We should note that the observation of singularity behavior is very sensitive to the time of the treatment and the size of the temperature step up, so that small changes in time or temperature could result in our failure to observe the phenomenon.
The arrhythmicity following the temperature step up for the singularity time points is transient (lasts 2–4 days) and robust conidiation rhythms typically could be detected 4–5 days after the temperature perturbation (Figure 1E). However, the phases of the rhythms following the arrhythmicity became randomly distributed across all possible phases of a circadian cycle and were not limited to phases after a type 1 or type 0 resetting stimuli (Figure 1B–E). This result can be predicted from the circadian limit cycle model (Petersen, 1980; Winfree, 1980; Lakin-Thomas, 1995), in which the point of singularity is also regarded as a point of all phases. Once the clock reaches the singularity point, any minor change in the clock state variables potentially can send the clock into unpredictable phases. Together, these data suggest that the Neuropsora circadian clock is governed by a limit cycle.
Singularity behavior can be triggered by a brief light pulse
It is known that light can rapidly induce frq expression and reset the Neurospora clock (Crosthwaite et al, 1995). If FRQ is a state variable in the Neurospora limit cycle-based oscillator, we would expect that a light pulse of a given intensity at a critical phase can also trigger the singular behavior. After performing experiments using different light intensities and durations around the phase of break point for light pulses (CT 15–20), we found that 15 s of light pulse (100 lux) at ∼CT19 (∼DD29) can consistently induce either the arrhythmic conidiation (Figure 2A) or low-amplitude conidiation rhythms. In contrast, light pulses of 5 or 30 s at this phase did not trigger such behavior and resulted in small or big phase shift of the rhythms, respectively (Figure 2B and C). The singularity behavior triggered by a critical light pulse, similar to the temperature step up, is transient and followed by the resumption of robust rhythms with randomly distributed phases after several days (Figure 2A and C). Thus, light can trigger singularity behavior in Neurospora. The slight delay of the critical phase for the light pulse compared to temperature treatment may be due to the rapid response kinetics of light (Crosthwaite et al, 1995). If assuming different stimuli result in identical change in the level of a state variable, the limit cycle model would predict that a stimulus with a faster response kinetics will cause singularity behavior at a later time point than a stimulus with a slower response kinetics.
Figure 2.
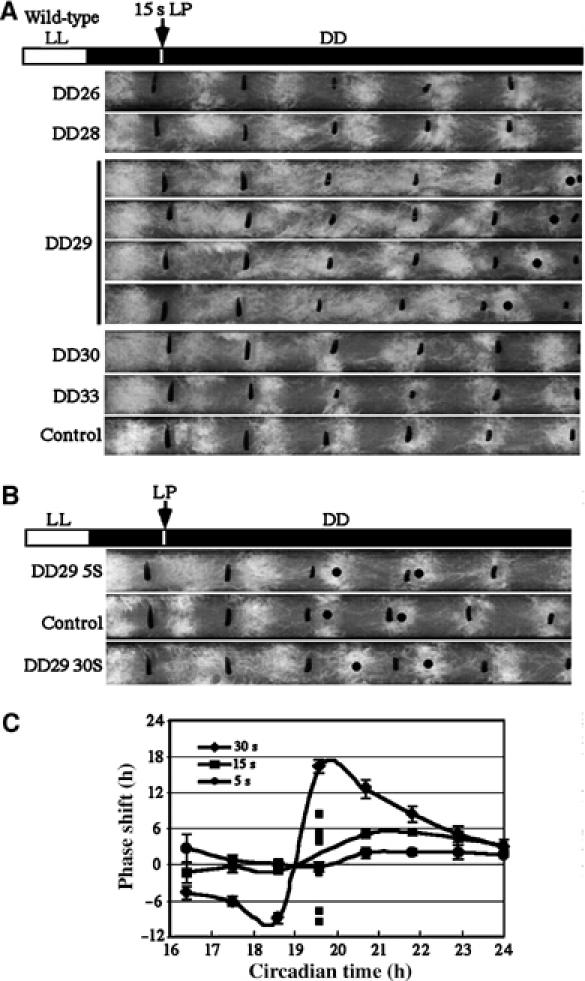
(A) Race tube assays showing the singularity behavior at around DD29 after a 15 s light pulse. Wild-type Neurospora cultures grown on race tube in DD were subjected to a light pulse at the indicated time points. (B) Race tube assays showing the phase-resetting behavior at DD29 after a 5 or 30 s light pulse. (C) PRC for 5, 15 or 30 s light pulse. For the 15 s light pulse, the phase shifts of individual race tubes for DD29 are shown.
Induction of frq alone is sufficient to phase shift the clock and trigger singularity behavior
Since temperature step up and light exposure can lead to induction of frq expression as well as triggering the singularity behavior, these data suggest that FRQ is a state variable of the Neurospora limit cycle-based circadian clock. Consistent with this, it has been previously shown that step change of FRQ levels resets the phase of the clock (Aronson et al, 1994a). To further examine this hypothesis and exclude the possibility that phase shifts and singularity behavior are due to other light- and temperature-inducible events, we examined whether a pulsatile induction of frq alone is sufficient to reset the Neurospora clock. Liquid cultures of the wt,qaFRQ strain, a wild-type strain containing a construct in which frq expression is under the control of the quinic acid (QA)-inducible promoter (Aronson et al, 1994a), was treated with QA (1 × 10⁻³ M) for 3 h. Afterwards, QA was washed off and cultures inoculated onto race tubes. As shown in Figure 3A, the QA treatment resulted in significant phase shifts of the circadian conidiation rhythms. In contrast, the same QA treatment has no effect on the rhythms of the wild-type strain (Figure 3C and data not shown). Thus, the induction of frq expression alone is sufficient to reset of the clock.
Figure 3.
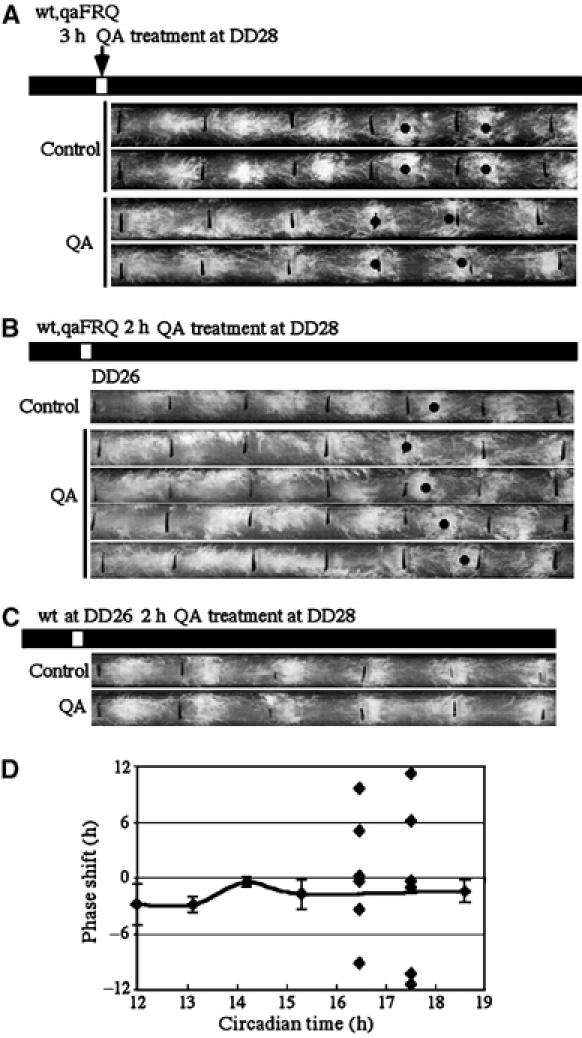
Induction of FRQ alone is sufficient to phase shift the clock and to trigger singularity behavior. (A) Race tube assays showing the phase shift of the circadian conidiation rhythm after a 3 h treatment of QA at DD28. A wild-type strain containing a qaFRQ construct was used in the experiments. (B) Race tube assays showing the singularity behavior after the QA treatment at DD26. At indicated time points, QA was added to the cultures for 2 h before the cultures were washed and inoculated onto race tubes. (C) Race tube assays showing that the QA treatment at DD26 did not phase shift the rhythm for a wild-type strain without the qaFRQ construct. (D) PRC of a 2 h QA treatment for the wt,qaFRQ strain. The phase shifts of individual race tubes for DD26 and DD27 are shown.
We then examined whether pulsatile induction of FRQ in the wt,qaFRQ strain can result in singularity behavior of the clock. After testing with different duration of QA treatments at different time points, we found that QA treatment of 2 h at around DD26–27 led to singularity-like behavior of the conidiation rhythms (Figure 3B). After the QA treatment, arrhythmic or low-amplitude rhythms of conidiation were seen for 3–4 days and the rhythms re-emerged afterwards with randomly distributed phased (Figure 3B and D). In contrast, the same QA treatment has no effect on the rhythms of a wild-type strain (Figure 3C). Thus, proper induction of FRQ expression alone at a phase when FRQ is declining is sufficient to trigger the singularity behavior, strongly suggesting that FRQ is a phase determining state variable of the Neurospora circadian clock.
Molecular arrhythmicity after the critical temperature step up
Both FRQ expression level and its phosphorylation state oscillate robustly in constant darkness (Garceau et al, 1997). Thus, we should expect that FRQ expression becomes arrhythmic after a critical treatment at the singularity time point. To examine this possibility, 21–25°C temperature shifting experiments were performed in wild-type liquid cultures. We performed the temperature shifting experiments at different time points ranging from DD20 to DD30 (∼CT10–21). We found that following the temperature step up around DD22–24 (∼CT14), arrhythmic or low-amplitude oscillations of FRQ expression were observed: FRQ levels were constant and stayed at an intermediate level in the extensive phosphorylated state (Figure 4). In contrast, the same treatment reset the clock with robust FRQ oscillations at other time points. Race tube assays of the same liquid cultures further confirmed that the singularity behavior occurred at around DD22–24 after the treatment (data not shown). In addition, larger temperature shifts during this time window did not result in arrhythmic FRQ expression (data not shown). Compared to the experiments performed on race tubes (Figure 1), the phase for the singularity behavior in these experiments is slightly earlier. This is probably due to the use of different growth conditions, which could lead to changes of gene expression as well as response kinetics to the temperature treatment. These data indicate that the 21–25°C temperature step up at a critical time point also leads to singular behavior at the molecular level.
Figure 4.
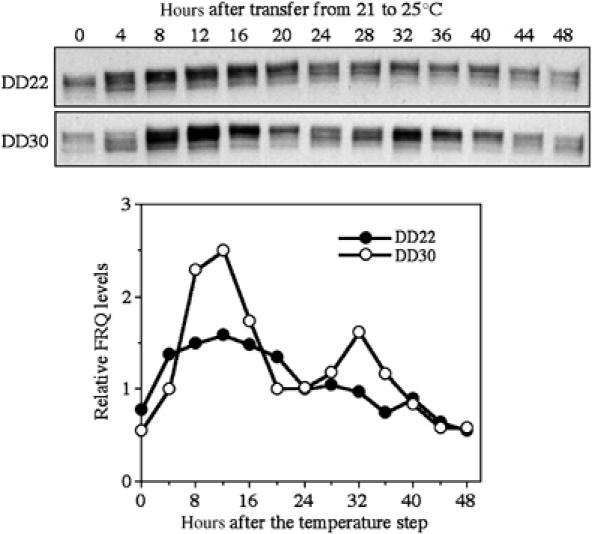
Western blot analysis of FRQ expression showing the molecular arrhythmicity after the 21–25°C temperature step up. Wild-type Neurospora cultures grown in liquid medium were transferred from 21°C to 25°C at DD22 or DD30. The cultures were harvested at the indicated time points after the temperature step. The densitometric analysis of the data is shown below.
Mutations of frq alter the amplitude of the clock, which determines the strength of the critical stimulus for singularity behavior
The limit cycle model predicts that the strength of the stimuli triggering singularity behavior is determined by the amplitude of the oscillator. In other words, a higher amplitude oscillator requires a stronger stimulus to cause phase shifts and the singularity behavior. To test this prediction, we examined the amplitude of FRQ oscillations in different Neurospora clock mutants with the rationale that, since FRQ is a state variable of the Neurospora clock, the amplitude of its oscillation should reflect the amplitude of the oscillator. frq1 and frq7 are two single missense point mutation mutants with respective periods of 16 and 29 h (Aronson et al, 1994b). The period differences of these strains are probably partly due to their difference in FRQ degradation rate (Ruoff et al, 2005). As shown in Figure 5A, in addition to their period differences, the amplitude of FRQ rhythms (distance from trough to peak) are different in these three strains. Compared to the wild-type strain, the amplitude of FRQ oscillation in DD is lower in the frq1 mutant, while it is significantly higher in the frq7 mutant. Thus, the function of FRQ not only determines the period of the clock but also the amplitude of its own oscillation.
Figure 5.
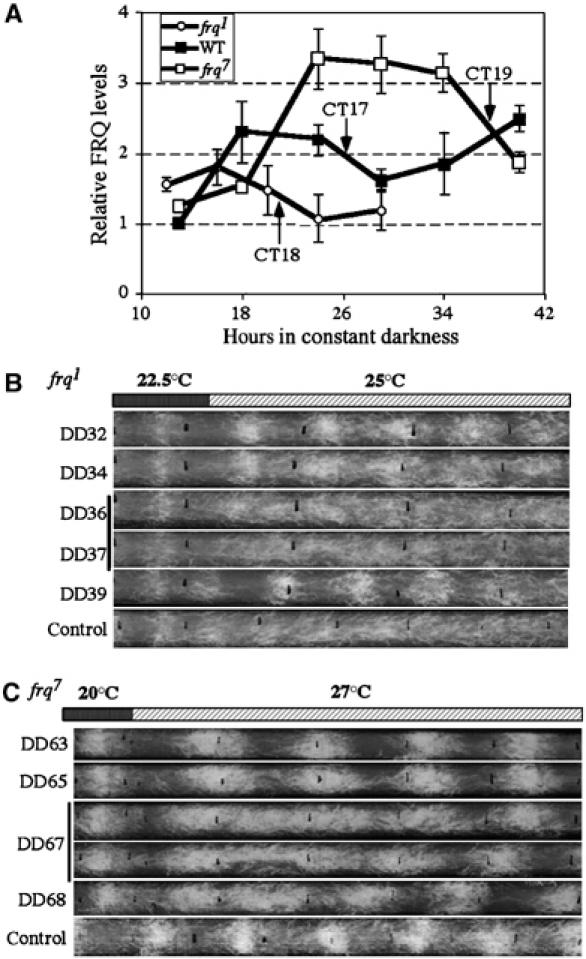
Size of the temperature step up that triggers singularity behavior is determined by the amplitude of FRQ oscillation. (A) The densitometric analysis showing FRQ oscillations in different Neurospora strains. The results were calculated from four independent experiments. To compare the FRQ levels in different strains, experiments for the wild-type, frq1 and frq7 strains were performed at the same time and SDS–PAGE gels of different samples were transferred to the same membrane for Western blot analysis. The arrows indicate the approximate CT time for each strain when singularity occurs. (B) Race tube assays showing the singularity behavior of frq1 strain after the 22.5–25°C step up. (C) Race tube assays showing the singularity behavior of frq7 strain after the 20–27°C step up. The control race tubes in (B) and (C) show different growth rates from the experimental race tubes because they were not subjected to a temperature step up.
Since FRQ is a state variable, the circadian clocks of these two mutants should oscillate with different amplitudes from the wild-type strain. Thus, we would predict that a weaker than wild-type stimulus is needed to trigger singularity behavior in the frq1 mutant and a stronger stimulus is needed for the frq7 mutant. These expected results were observed. While singularity behavior of the wild-type strain was achieved by a 21–25°C temperature shift (Figure 1), a 22.5–25°C treatment of frq1 mutant triggered arrhythmicity during DD36–37 (CT18; Figure 5B). On the other hand, we observed that a 7°C temperature shift (20–27°C) is required to trigger singularity behavior at DD67 (CT19) in the frq7 mutant. Importantly, although the DD hours of the singularity time points for these strains differ significantly, they appear to be mainly due to their period differences. The singularity points of the three strains all occur at around the same circadian time (CT17–19), a time point at which FRQ level is declining (Figure 5A). These results further indicate that FRQ is a state variable of the Neurospora limit cycle-based circadian oscillator as well as indicating that the strength of the critical stimuli can be used as a gauge for the amplitude of the circadian oscillator. Furthermore, these results are consistent with a previously proposed amplitude model, thereby providing a molecular explanation for the different clock-resetting behaviors of the frq1, wild-type and frq7 strains after light and drug treatments (Dunlap and Feldman, 1988; Lakin-Thomas et al, 1991).
Singularity behavior is due to the loss of rhythm in all cells
Two alternative models can explain the arrhythmic behavior after the critical stimuli at the singularity time point (Figure 6A). In the first model, the arrhythmicity behavior is due to the desynchronization of the individual oscillators in a population (Winfree, 1970; Honma and Honma, 1999). Because the critical stimuli can send the state variables close to the singularity point on the limit cycle, it is likely that subtle variations of the treatment to individual cells can cause some but not other cells to cross the singularity point (type 0 resetting), leading to the desynchronization of individual oscillators. Based on this first model, one would predict that the mixing of cells from different phases or cells subjected to type 1 or type 0 stimuli treatment should result in arrhythmicity of the population. To test this model, we mixed Neurospora cultures (grown in agar or liquid media) from two to four different phases. Neurospora mycelia have the ability to fuse to form heterokaryotic cultures, in which several nuclei can exist in the same cytoplasm. Similar to an earlier study (Nakashima and Hastings, 1989a), we found that the resulting mixed cultures always exhibited robust conidiation rhythms from the start with phases close to the average of the parental phases (data not shown). In addition, when we mixed the cultures that were treated separately with a 19–25°C temperature shift (type 0 resetting) or a 22.5–25°C step up (type 1 resetting) around CT17, robust rhythmicity was observed immediately afterwards and no singularity-like behavior was seen. Thus, based on these data, it is unlikely that the singularity behavior in Neurospora is solely caused by desynchronization of the population of oscillators. However, desynchronization may be responsible for the random distribution of phases after the initial arrhythmicity (see Discussion below).
Figure 6.
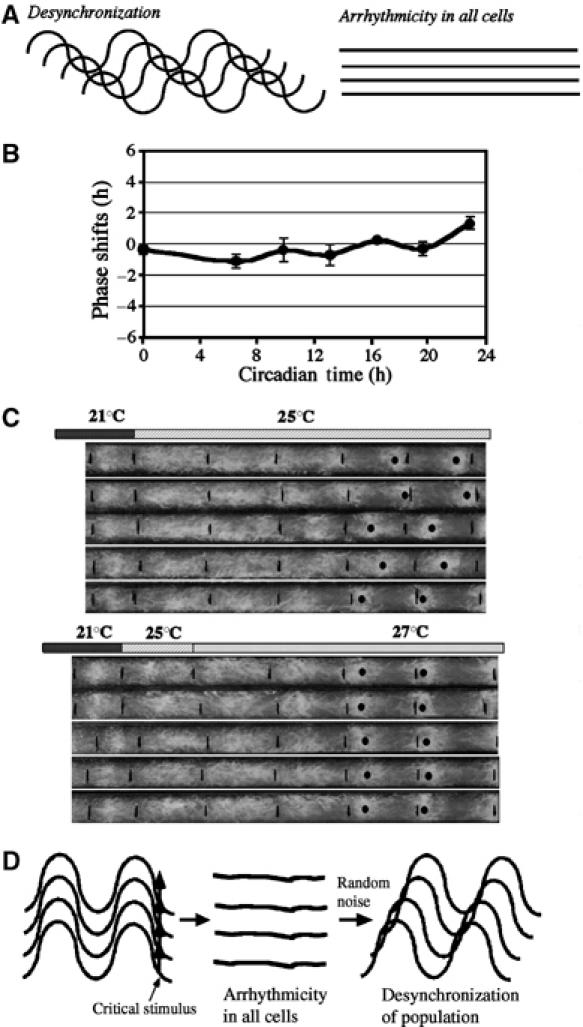
Singularity behavior is due to the loss of rhythms in all cells and is a two-step process. (A) Graphic depiction of two alternative models explaining the singularity behavior. (B) PRC showing that the 25–27°C temperature step up is a weak phase-resetting stimulus. (C) Two-step experiments showing the strong resetting of the Neurospora circadian conidiation rhythms by the 25–27°C temperature step up for cultures with singularity behavior. Wild-type Neurospora cultures grown on race tubes were first transferred from 21 to 25°C at DD48 to trigger singularity behavior. After 1 day, half of the cultures were shifted to 27°C in DD. (D) A graphic model depicting that the singularity behavior is a two-step process. Each curve symbolizes an individual cell in a cell population. After a critical stimulus that changes the level(s) of a clock state variable(s), all cells becomes arrhythmic (clock amplitude is close to zero). Afterwards, due to random noises in the system, clock oscillation can resume in individual cells at different times, resulting in desynchronization of the cell population. For an organism, in which cells cannot be communicate and self-synchronize, this will results in long-term arrhythmicity. For Neurospora, because cells can fuse and achieve a common phase with each other, it results in transient arrhythmicity with randomly distributed phases.
In the second model, the singularity behavior after the critical stimulus is due to the lack of circadian rhythmicity in all pacemaker cells (Figure 6A) (Leloup and Goldbeter, 2001). This model predicts that after the critical stimulus, the clock is at or close to a steady state and the amplitude of clock oscillation is close to zero. If this is true, one would expect that after the critical stimulus, while the cells are in the singularity, a weak type 1 stimulus would result in strong phase resetting to the cells, leading to the resynchronization of the entire population to a defined phase. Alternatively, if the singularity is due to the desynchronization of cells, a weak stimulus should not cause type 0 resetting and the resulting phase will still be random.
The PRC in Figure 6B shows that the 25–27°C temperature step up is a weak type 1 stimulus for the wild-type strain and is only capable of causing small or no phase shifts at all phases. To distinguish between these two models, we performed the experiment by shifting cultures to 27°C 1 day after the wild-type race tube cultures were subjected a 21–25°C temperature shift at DD48 (resulting in singularity behavior). In contrast to the random distribution of phases following arrhythmicity in the control cultures (Figure 6C, upper panel), the phases of the cultures were synchronized to a defined phase after the second temperature step (Figure 6C, lower panel), indicating that the 25–27°C temperature step up can lead to strong phase resetting for cultures in singularity. Similar results were obtained in several independently performed experiments. These results suggest that the singularity behavior in Neurospora is due to the clock being driven to a steady state, which in turn leads to the loss of or low-amplitude oscillation in all cells.
Discussion
In this study, we demonstrated that, when applied at a critical phase and with appropriate strength, both temperature step up and light pulse stimuli that activate frq expression trigger singularity behavior of the Neurospora clock at the physiological and molecular levels. Furthermore, we showed that induction of FRQ alone is sufficient to trigger singularity behavior. In addition, we demonstrate that the strength of the stimulus for the singularity behavior is determined by the amplitude of the FRQ oscillation. These data demonstrate that FRQ is a state variable of the Neurospora limit cycle-based circadian clock and that the amplitude of FRQ rhythm reflects the amplitude of the clock. Finally, our results suggest that the singularity behavior in Neurospora is mainly due to the loss of clock function in all cells.
A molecular explanation for circadian singularity behavior
Our data provide a molecular explanation for the singularity behavior of the clock. At the core of the Neurospora circadian oscillator lies the frq-wc-based circadian negative feedback loop. In constant darkness, due to the time delays in the negative feedback loop, the processes of frq activation and the inhibition of WCC are always out of phase from each other. Similarly, the synthesis of FRQ and its degradation are also temporally separated, so that FRQ expression oscillates persistently with a certain amplitude in DD. For such a negative feedback loop to reach a steady state and stop oscillation, FRQ synthesis should equal to its degradation and the activation of frq expression by WCC and the inhibition of WCC by FCC should reach an equilibrium. In most circumstances, the changes of FRQ level by phase-resetting stimuli, such as light or temperature treatment, advance or delay the phase of FRQ oscillation, resulting in phase shifts of the clock. However, if a critical stimulus given at an appropriate time in the circadian cycle changes the level of FRQ to an appropriate level, so that the synthesis of FRQ is equal to its degradation, and if this induction of FRQ also occurs at a time when the processes of FRQ activation by WCC and WCC inhibition by FFC are at an equilibrium, the circadian negative feedback loop is short-circuited and reaches a steady state, after which FRQ stays constant at an intermediate level and the clock is no longer functioning in all cells.
Supporting this interpretation, we showed that FRQ levels are arrhythmic at an intermediate level following the critical treatment. In addition, the singularity behavior in Neurospora was observed when FRQ levels are induced by a temperature shift or light pulse or using a QA-inducible system around CT 16–19. At this phase, FRQ level is decreasing (there is more degradation than synthesis) and WCC activity is increasing, thus it is likely that the inhibition of WCC by FFC may reach a balance with the activation of frq by WCC. Therefore, proper activation of FRQ at this time, which can bring the FRQ synthesis and degradation to equilibrium, will send the circadian negative feedback loop to a steady state and abolish the rhythmicity in all cells. In this aspect, the circadian clock may be similar to an oscillating pendulum: the oscillation of the pendulum can be completely stopped by applying appropriate kinetic energy (equal to that of the pendulum bob) to the pendulum bob in the opposite direction of its movement (so that the velocity becomes zero) only when the pendulum is at its lowest point on its trajectory. At this time point, the sum of the force on bob is zero (gravity=tension).
Obviously, the biochemical model proposed above for singularity behavior in circadian clocks is a simplification of the process; nevertheless, it provides a general conceptual framework to explain the phenomenon. Based on this model, we would predict that an appropriate treatment that results in the decrease of FRQ expression, such as temperature shift or the inhibition of protein synthesis, can trigger singularity behavior at a phase when FRQ level is rising. However, we should note that the exact time point at which the singularity can be triggered is influenced by several factors, including growth conditions, expression level(s) of the clock state variable(s), the response kinetics and the type and strength of the stimulus. In addition, the stimulus may not only change FRQ expression, it could also affect the WC expression and activity as well as other clock component(s). This latter effect was known for light in Neurospora (He and Liu, 2005).
Transient versus long-term suppression of circadian rhythms after a critical stimulus: singularity behavior is a two-step process
Different from the singularity behavior reported in other organisms, the arrhythmicity after the critical treatment is transient in Neurospora and robust rhythmicity with a randomly distributed phase resumes after several days. Although it is possible that the transient suppression of rhythms we observed in Neurospora is due to the use of stimuli that are close to but not at the critical strength needed for long suppression, we feel this is unlikely since several stimuli were tested extensively and long-term suppression was never observed. In addition, the random distribution of phases after arrhythmicity, a phenomenon not reported before, suggests the uniqueness of the Neurospora system and provides new insight into the cause of long-term suppression in other circadian systems.
One key difference between Neurospora and other circadian systems tested for singularity behavior is that the mycelia of Neurospora can fuse to form heterokaryotic cultures, so that the cytoplasmic contents of the different cells can be mixed. Because of this ability, mixtures of cells from different phases can quickly achieve a common phase and arrhythmicity of the population does not occur (Nakashima and Hastings (1989b) and this study). The results of this study suggest that the singularity of the clock in Neurospora is due to the circadian negative feedback loop reaching a steady state during the singularity. In other words, the clock oscillates with an amplitude close to zero after a critical stimulus (Figure 6D). Because, as we have demonstrated in this study, the amplitude of the clock determines the sensitivity of the clock to changes in its state variables, small changes (occurring randomly) in FRQ or WCC during this time in DD could send the clock back to its preferred limit cycle after a few days, resulting in a random distribution of phases. Although individual cells in a population may come out of the singularity at different phases, the heterokaryotic nature of the population will eventually achieve a common phase for all cells, resulting in the resumption of robust rhythmicity. Therefore, if the Neurospora cells cannot fuse to form heterokaryons, a critical stimulus will result in the long-term suppression of rhythms as observed in other organisms.
The model proposed above delineates the circadian singularity behavior into two distinct processes: the initial arrhythmicity followed by the desynchronization of cell populations (Figure 6D). Based on this model, we propose that the long-term suppression of circadian rhythms in other organisms, which cells cannot fuse or communicate to achieve a common phase, is due to desynchronization of cell populations after initial arrhythmicities. This prediction can be directly tested if rhythms of individual cells can be monitored. On the other hand, it is also possible that the existence of FRQ-less oscillators in Neurospora can also contribute to the desynchronization of cell populations after the initial arrhythmicity (dePaula et al, 2006).
Amplitude of the clock determines its sensitivity to phase-resetting stimulus
frq1 and frq7 mutants were long known to exhibit different phase-resetting behavior from the wild-type strain: light results in stronger phase resetting in the frq1 mutant compared to the wild-type strain, while the frq7 mutant is resistant to both the light and cycloheximide-induced phase resetting (Dunlap and Feldman, 1988; Lakin-Thomas et al, 1990). As we showed in this study, the different amplitudes of FRQ oscillations in these strains provide a molecular explanation for their differential phase-resetting behavior. In addition, our data present experimental support for a previously proposed limit cycle-based amplitude model (Lakin-Thomas et al, 1990, 1991). In the frq1 mutant, due to its low FRQ level and low amplitude of FRQ oscillation, it is more sensitive to light than a wild-type strain. On the other hand, the high FRQ level and high-amplitude FRQ oscillation in the frq7 mutant make it less sensitive to FRQ changes resulting from light and cycloheximide treatments. These data also indicate that the amplitude of the clock oscillation is an important determining factor for clock's sensitivity to its zeitgebers.
Because of the similarity between the Neurospora circadian feedback loop and those of higher eukaryotic organisms, similar mechanisms as we proposed here for Neurospora may be applied to other clock systems. In fact, mathematic models have predicted that singularity behavior in Drosophila melanogaster and mouse can be achieved by a light pulse applied at a phase when TIM (and PER) protein is increasing (light triggers degradation of TIM in Drosophila) or when mPER protein is declining (light activates mPer transcription in mammals), respectively (Leloup and Goldbeter, 2001). In addition, our observation of the reduction of oscillator amplitude after the critical stimuli is consistent with the model proposed to explain the strong human phase response to multiple light exposures (Strogatz, 1990; Jewett et al, 1991).
Materials and methods
bd a, bd qaFRQ, bd frq1 and bd frq7 strains were used in this study. Race tube assay medium contained 1 × Vogel's, 0.1% glucose, 0.17% arginine, 50 ng/ml biotin and 1.5% agar. For light-resetting experiments, race tubes containing acetate-casamino acid medium were used (1 × Vogel's, 1.2% sodium acetate, 0.05% casamino acid hydrozylate and 1.5% agar). For experiments using the wt,qaFRQ strain, mycelia mats were grown in Petri dishes containing minimal medium (1 × Vogel's, 2% glucose and 50 ng/ml biotin) for 2 days before they were transferred into DD. At the different DD time points, the mycelia discs were cut and cultured in low glucose medium (1 × Vogel's, 0.1% glucose, 0.17% arginine and 50 ng/ml biotin) with/without QA (1 × 10⁻³ M) for 1/2 to 6 h. Afterwards, the discs were washed and excess medium on the discs was removed by blotting on filter paper before they were inoculated on the race tubes (1 × Vogel's, 0.1% glucose, 0.17% arginine, 50 ng/ml biotin and 1.5% agar) in DD. Period of the race tube results was analyzed by Chrono II, which was used to calculate the CT for different strains (Roenneberg and Taylor, 2000). The phase shifts were calculated manually using the center of the conidiation bands. One CT hour is 1/24 of the endogenous period of the clock and the light/dark transition is regarded as CT12. For cultures with singular behavior, their phases after the critical stimulus were determined by extrapolating back to the time of the treatment based on the position of the robust conidiation bands after the singularity behavior. For all race tube experiments, multiple independent experiments were performed and similar results were obtained. Representative results are shown in the figures. Protein extraction and Western blot analysis were performed as described previously (Garceau et al, 1997).
Acknowledgments
We thank Ping Cheng, Liz Li and Qun He for assistance during the early stage of this study. We thank Lily Li for critical reading of this manuscript and Carl Johnson for discussions. This work was supported by grants from National Institutes of Health (GM068496 and GM062591) and Welch Foundation to Yi Liu. Y Liu is the Louise W Kahn endowed scholar in Biomedical Research at University of Texas Southwestern Medical Center.
References
- Aronson B, Johnson K, Loros JJ, Dunlap JC (1994a) Negative feedback defining a circadian clock: autoregulation in the clock gene frequency. Science 263: 1578–1584 [DOI] [PubMed] [Google Scholar]
- Aronson BD, Johnson KA, Dunlap JC (1994b) The circadian clock locus frequency: a single ORF defines period length and temperature compensation. Proc Natl Acad Sci USA 91: 7683–7687 [DOI] [PMC free article] [PubMed] [Google Scholar]
- Cheng P, He Q, He Q, Wang L, Liu Y (2005) Regulation of the Neurospora circadian clock by an RNA helicase. Genes Dev 19: 234–241 [DOI] [PMC free article] [PubMed] [Google Scholar]
- Cheng P, Yang Y, Liu Y (2001) Interlocked feedback loops contribute to the robustness of the Neurospora circadian clock. Proc Natl Acad Sci USA 98: 7408–7413 [DOI] [PMC free article] [PubMed] [Google Scholar]
- Covington MF, Panda S, Liu XL, Strayer CA, Wagner DR, Kay SA (2001) ELF3 modulates resetting of the circadian clock in Arabidopsis. Plant Cell 13: 1305–1315 [DOI] [PMC free article] [PubMed] [Google Scholar]
- Crosthwaite SK, Dunlap JC, Loros JJ (1997) Neurospora wc-1 and wc-2: transcription, photoresponses, and the origins of circadian rhythmicity. Science 276: 763–769 [DOI] [PubMed] [Google Scholar]
- Crosthwaite SK, Loros JJ, Dunlap JC (1995) Light-induced resetting of a circadian clock is mediated by a rapid increase in frequency transcript. Cell 81: 1003–1012 [DOI] [PubMed] [Google Scholar]
- dePaula R, Lewis ZA, Greene AV, Seo KS, Morgan LW, Vitalini MW, Bennett L, Gomer RH, Bell-Pedersen D (2006) Two circadian timing circuits in Neurospora crassa cells share components and regulate distinct rhythmic processes. J Biol Rhythm 21: 159–168 [DOI] [PubMed] [Google Scholar]
- Dunlap JC (1999) Molecular bases for circadian clocks. Cell 96: 271–290 [DOI] [PubMed] [Google Scholar]
- Dunlap JC (2006) Proteins in the Neurospora circadian clockworks. J Biol Chem 281: 28489–28493 [DOI] [PubMed] [Google Scholar]
- Dunlap JC, Feldman JF (1988) On the role of protein synthesis in the circadian clock of Neurospora crassa. Proc Natl Acad Sci USA 85: 1096–1100 [DOI] [PMC free article] [PubMed] [Google Scholar]
- Engelmann W, Johnsson A, Kobler HG, Schimmel M (1978) Attenuation of the petal movement rhythm in Kalanchoe with light pulses. Plysiol Plant 43: 68–76 [Google Scholar]
- Froehlich AC, Loros JJ, Dunlap JC (2003) Rhythmic binding of a WHITE COLLAR-containing complex to the frequency promoter is inhibited by FREQUENCY. Proc Natl Acad Sci USA 100: 5914–5919 [DOI] [PMC free article] [PubMed] [Google Scholar]
- Garceau N, Liu Y, Loros JJ, Dunlap JC (1997) Alternative initiation of translation and time-specific phosphorylation yield multiple forms of the essential clock protein FREQUENCY. Cell 89: 469–476 [DOI] [PubMed] [Google Scholar]
- Gooch VD, Wehseler RA, Gross CG (1994) Temperature effects on the resetting of the phase of the Neurospora circadian rhythm. J Biol Rhythms 9: 83–94 [DOI] [PubMed] [Google Scholar]
- He Q, Cha J, He Q, Lee H, Yang Y, Liu Y (2006) CKI and CKII mediate the FREQUENCY-dependent phosphorylation of the WHITE COLLAR complex to close the Neurospora circadian negative feedback loop. Genes Dev 20: 2552–2565 [DOI] [PMC free article] [PubMed] [Google Scholar]
- He Q, Cheng P, Yang Y, He Q, Yu H, Liu Y (2003) FWD1-mediated degradation of FREQUENCY in Neurospora establishes a conserved mechanism for circadian clock regulation. EMBO J 22: 4421–4430 [DOI] [PMC free article] [PubMed] [Google Scholar]
- He Q, Liu Y (2005) Molecular mechanism of light responses in Neurospora: from light-induced transcription to photoadaptation. Genes Dev 19: 2888–2899 [DOI] [PMC free article] [PubMed] [Google Scholar]
- He Q, Shu H, Cheng P, Chen S, Wang L, Liu Y (2005) Light-independent phosphorylation of WHITE COLLAR-1 regulates its function in the Neurospora circadian negative feedback loop. J Biol Chem 280: 17526–17532 [DOI] [PubMed] [Google Scholar]
- Heintzen C, Liu Y (2006) The Neurospora circadian clock. Adv Genet (in press) [DOI] [PubMed] [Google Scholar]
- Honma S, Honma K (1999) Light-induced uncoupling of multioscillatory circadian system in a diurnal rodent, Asian chipmunk. Am J Physiol 276: R1390–R1396 [DOI] [PubMed] [Google Scholar]
- Jewett ME, Kronauer RE, Czeisler CA (1991) Light-induced suppression of endogenous circadian amplitude in humans. Nature 350: 59–62 [DOI] [PubMed] [Google Scholar]
- Johnson CH (1999) Forty years of PRCs—what have we learned? Chronobiol Int 16: 711–743 [DOI] [PubMed] [Google Scholar]
- Johnson CH, Elliott JA, Foster R (2003) Entrainment of circadian programs. Chronobiol Int 20: 741–774 [DOI] [PubMed] [Google Scholar]
- Johnson CH, Kondo T (1992) Light pulses induce ‘singular' behavior and shorten the period of the circadian phototaxis rhythm in the CW15 strain of Chlamydomonas. J Biol Rhythms 7: 313–327 [DOI] [PubMed] [Google Scholar]
- Lakin-Thomas P, Coté G, Brody S (1990) Circadian rhythms in Neurospora: biochemistry and genetics. Crit Rev Micro 17: 365–416 [DOI] [PubMed] [Google Scholar]
- Lakin-Thomas PL (1995) A beginner's guide to limit cycles, their uses and abuses. Biol Rhythm Res 26: 216–232 [Google Scholar]
- Lakin-Thomas PL, Brody S, Coté GG (1991) Amplitude model for the effects of mutations and temperature on period and phase resetting of the Neurospora circadian oscillator. J Biol Rhythms 6: 281–297 [DOI] [PubMed] [Google Scholar]
- Leloup JC, Goldbeter A (2001) A molecular explanation for the long-term suppression of circadian rhythms by a single light pulse. Am J Physiol Regul Integr Comp Physiol 280: R1206–R1212 [DOI] [PubMed] [Google Scholar]
- Leloup JC, Gonze D, Goldbeter A (1999) Limit cycle models for circadian rhythms based on transcriptional regulation in Drosophila and Neurospora. J Biol Rhythms 14: 433–448 [DOI] [PubMed] [Google Scholar]
- Liu Y (2003) Molecular mechanisms of entrainment in the Neurospra circadian clock. J Biol Rhythms 18: 195–205 [DOI] [PubMed] [Google Scholar]
- Liu Y, Bell-Pedersen D (2006) Circadian rhythms in Neurospora crassa and other filamentous fungi. Eukaryot Cell 5: 1184–1193 [DOI] [PMC free article] [PubMed] [Google Scholar]
- Liu Y, Loros J, Dunlap JC (2000) Phosphorylation of the Neurospora clock protein FREQUENCY determines its degradation rate and strongly influences the period length of the circadian clock. Proc Natl Acad Sci USA 97: 234–239 [DOI] [PMC free article] [PubMed] [Google Scholar]
- Liu Y, Merrow MM, Loros JJ, Dunlap JC (1998) How temperature changes reset a circadian oscillator. Science 281: 825–829 [DOI] [PubMed] [Google Scholar]
- Nakashima H, Hastings JW (1989a) Phase determination of the circadian rhythm of conidiation in heterocaryons between two out-of-phase mycelia in Neurospora crassa. J Biol Rhythms 4: 377–387 [DOI] [PubMed] [Google Scholar]
- Nakashima H, Hastings JW (1989b) Phase determination of the circadian rhythm of conidiation in heterocaryons between two out-of-phase mycelia in Neurospora crassa. J Biol Rhythms 4: 377–387 [DOI] [PubMed] [Google Scholar]
- Petersen EL (1980) A limit cycle interpretation of the mosquito circadian oscillator. J Theor Biol 84: 281–310 [DOI] [PubMed] [Google Scholar]
- Roenneberg T, Taylor W (2000) Automated recordings of bioluminescence with special reference to the analysis of circadian rhythms. Methods Enzymol 305: 104–119 [DOI] [PubMed] [Google Scholar]
- Ruoff P, Loros JJ, Dunlap JC (2005) The relationship between FRQ-protein stability and temperature compensation in the Neurospora circadian clock. Proc Natl Acad Sci USA 102: 17681–17686 [DOI] [PMC free article] [PubMed] [Google Scholar]
- Schafmeier T, Haase A, Kaldi K, Scholz J, Fuchs M, Brunner M (2005) Transcriptional feedback of Neurospora circadian clock gene by phosphorylation-dependent inactivation of its transcription factor. Cell 122: 235–246 [DOI] [PubMed] [Google Scholar]
- Strogatz SH (1990) Interpreting the human phase response curve to multiple bright-light exposures. J Biol Rhythms 5: 169–174 [DOI] [PubMed] [Google Scholar]
- Taylor W, Krasnow R, Dunlap JC, Broda H, Hastings JW (1982) Critical pulses of anisomycin drive the circadian oscillator in Ganyaulax towards its singularity. J Comp Physiol 148: 11–25 [Google Scholar]
- Winfree AT (1970) Integrated view of resetting a circadian clock. J Theor Biol 28: 327–374 [DOI] [PubMed] [Google Scholar]
- Winfree AT (1980) The Geometry of Biological Time. New York: Springer-Verlag [Google Scholar]
- Yang Y, Cheng P, Liu Y (2002) Regulation of the Neurospora circadian clock by casein kinase II. Genes Dev 16: 994–1006 [DOI] [PMC free article] [PubMed] [Google Scholar]
- Young MW, Kay SA (2001) Time zones: a comparative genetics of circadian clocks. Nat Rev Genet 2: 702–715 [DOI] [PubMed] [Google Scholar]