Abstract
Compromised immunoregulation contributes to obesity and complications in metabolic pathogenesis. Here, we demonstrate that the nuclear factor of activated T cell (NFAT) group of transcription factors contributes to glucose and insulin homeostasis. Expression of two members of the NFAT family (NFATc2 and NFATc4) is induced upon adipogenesis and in obese mice. Mice with the Nfatc2−/− Nfatc4−/− compound disruption exhibit defects in fat accumulation and are lean. Nfatc2−/− Nfatc4−/− mice are also protected from diet-induced obesity. Ablation of NFATc2 and NFATc4 increases insulin sensitivity, in part, by sustained activation of the insulin signaling pathway. Nfatc2−/− Nfatc4−/− mice also exhibit an altered adipokine profile, with reduced resistin and leptin levels. Mechanistically, NFAT is recruited to the transcription loci and regulates resistin gene expression upon insulin stimulation. Together, these results establish a role for NFAT in glucose/insulin homeostasis and expand the repertoire of NFAT function to metabolic pathogenesis and adipokine gene transcription.
Obesity is a causal contributor to type II diabetes and is emerging as an epidemic crisis in the United States and in many other countries (11). Obesity is a consequence of an energy imbalance. An increase in adipocyte cell number (by proliferation and differentiation) and/or cell size (by hypertrophy) is correlated with an elevated lipid accumulation. In addition to its obvious role as major depots for excess energy storage, recent advances have indicated that a variety of secretory proteins (also termed adipokines) are released from adipose tissue (28, 41). These secretory proteins regulate energy balance, appetite, and insulin sensitivity (26, 46, 51, 55). Further understanding of the regulations of adipokine are, therefore, important to combat the emerging epidemic global crisis of obesity and its consequences in type II diabetes, heart failure, and certain types of cancers (27, 35).
Obesity is also correlated with various degrees of inflammation (21, 53). In addition to the proposed role in insulin and glucose homeostasis, a variety of adipocyte-secreted proteins, such as leptin, adiponectin, and resistin, also play a role in the inflammatory response. For example, infiltration of macrophage into adipose tissue is correlated with the level of inflammatory cytokines in the obese state. Thus, signaling cascades and transcription effectors that contribute to immune function can modulate obesity.
The NFAT group of transcription factors was first identified as a critical component in cytokine gene expression upon T-cell activation (7, 19). Subsequent studies demonstrate that NFAT also plays an important role in nonimmune cells. In addition to its established role in immune cells (38, 39, 43, 45, 48, 52, 57), targeted disruption of the calcineurin-regulated NFAT members has further illuminated the role of NFAT in multiple biological processes, including cardiac morphogenesis (5, 8, 34) and neural pathfinding (14). Whether NFAT contributes to obesity, however, has yet to be established.
Recent studies have indicated that NFAT also plays a role in adipocyte differentiation (16, 58, 60, 61). NFAT interacts with transcription factor CCAAT/enhancer binding protein (C/EBP) to form a composite element to regulate the peroxisome proliferator-activated receptor γ2 (PPARγ2) gene. Given that NFAT regulates cytokine gene expression in immune cells, NFAT may also modulate adipokine gene expression and contribute to glucose and insulin homeostasis.
The purpose of this study was to examine the role of NFAT in glucose homeostasis and insulin sensitivity. We find that expression of NFATc2 and NFATc4 is induced upon adipogenesis and in obesity. In addition, aged Nfatc2−/− Nfatc4−/− mice exhibit a defect in fat accumulation and remain lean. Nfatc2−/− Nfatc4−/− mice are also resistant to diet-induced obesity. Ablation of NFATc2 and NFATc4 increases insulin sensitivity, in part, by sustained activation of the insulin signaling pathway. Analogous to its role in cytokine gene expression in immune cells, NFAT regulates resistin adipokine gene transcription. Together, these results demonstrate that NFAT contributes to glucose and insulin homeostasis.
MATERIALS AND METHODS
Mice.
Animal experiments were performed in accordance with guidelines of Albert Einstein College of Medicine Institute of Animal Studies. Nfatc2−/− Nfatc4−/− mice were generated as described previously (12, 14). Mice were fed ad libitum with regular chow (10% of calories derived from fat) or a high-fat diet (59% of calories derived from fat; Research Diets, Inc.). Tissues harvested were fixed in formalin and sectioned. Representative sections were hematoxylin and eosin stained and examined under a microscope. Magnetic resonance imaging of anesthetized mice was performed using a GE Omega 9.4-T vertical bore MR system (Fremont, CA) equipped with an S50 shielded gradient microimaging accessory and a custom-built coil designed specifically for mice (9, 47).
Reagents.
The resistin promoter was amplified from mouse genomic DNA and subcloned into the pGL3-luciferase reporter plasmid using NheI and XhoI restriction sites. Antibody for NFATc1, (sc7294), NFATc2 (sc7296), NFATc3 (sc8321), NFATc4 (sc13036), PPARγ (sc7273), C/EBPα (sc61), insulin receptor (IR) (sc711), Akt (sc1618), extracellular signal-regulated kinase (ERK) (sc1647), S6K (sc230), phospho-Akt (P-Akt; sc16646r), and phospho-ERK (P-ERK; sc7383) were obtained from Santa Cruz Biotech, while phospho-Akt (P-Akt) (no. 9271), phospho-S6K (P-S6K) (no. 9204 and no. 9205), AMP-dependent protein kinase (AMPK) (no. 2532), and phospho-AMPK (P-AMPK) (no. 2535) were obtained from Cell Signaling. Antibody for fatty acid binding protein aP2 is from Abcam (Ab654). Monoclonal β-actin antibody, triglyceride determination kit, and 2-deoxy-d-[1,2-3H]glucose (2-DOG) were purchased from Sigma. Cholesterol and free fatty acid (FFA) determination kits were obtained from WAKO and Roche, respectively. Phospho-Tyr monoclonal antibody 4G-10 and anti-acetyl histone H3 (no. 06-599) were obtained from Upstate Biotech. The adipokine level in serum was determined by using the Lincoplex assay kit. The level of adiponectin and insulin in serum was determined by radioimmunoassay (LINCO).
Cell culture.
3T3/L1, HepG2, and COS cells were cultured in Dulbecco modified Eagle medium. BHK cells were cultured in minimal essential medium. All media were supplemented with 10% fetal calf serum, 2 mM l-glutamine, penicillin (100 U/ml), and streptomycin (100 μg/ml) (Invitrogen). Cells were transfected by using Lipofectamine (Invitrogen). 3T3/L1 cells were differentiated into lipid-laden adipocytes as described previously (60) using an insulin (5 μg/ml), dexamethasone (1 μM), and phosphodiesterase inhibitor isobutylmethylxanthine (0.5 mM) cocktail. Primary hepatocytes were isolated by collagenase digestion, cultured in Dulbecco modified Eagle medium, and used within 48 h after isolation (36). Thioglycolate-elicited peritoneal macrophages were cultured in RPMI 1640 and stimulated within 24 h after isolation.
Metabolic analyses.
A bolus of glucose (2.5 g/kg of body weight) or insulin (0.75 unit/kg) was administered orally or by intraperitoneal injection, respectively, into mice. Serum glucose was monitored from the tail vein using a glucometer (TrueTrack Smart System) at various times. Insulin collected at the various times was measured by radioimmunoassay. To determine oxygen consumption (VO2), carbon dioxide production (VCO2), heat release, and locomotor activity, mice were individually housed in respiratory chambers and were allowed to acclimate to the respiratory chambers for 1 day before the gas exchange measurements began (37). Data on gas exchanges were recorded for 2 to 3 days. Indirect calorimetry was performed with a computer-controlled open-circuit calorimetry system (Oxymax; Columbus Instruments) composed of four respiratory chambers. Oxygen consumption, CO2 production, heat release, and locomotor activity were measured for each mouse at 15- or 20-min intervals and presented.
Signaling analysis.
Tissues from insulin-injected mice were collected at the times indicated. Tissue extracts prepared were immunoprecipitated with insulin receptor antibody and probed with the phospho-Tyr antibody 4G-10 to assay insulin receptor activation. Activation of insulin receptor downstream signaling components, such as the Akt protein kinase and ribosomal S6K protein kinase, was determined by phospho-specific antibodies. Activation of AMPK in epididymal fat in vivo was determined after overnight fasting. Activation of AMPK in vitro was elicited by administration of AICAR (500 μM) or sorbitol (500 mM) and assayed by using phospho-specific antibodies.
Gel mobility shift assays.
Nuclear extracts were prepared from cultured cells as described previously (60). Double-stranded oligonucleotides for gel mobility shift assays were labeled with [α-32P]dCTP. Sequences for the resistin NFAT elements are as follows: −700 bp, 5′-TGTTGAGAAAGAGGGATTTCCAAAGGGACA-3′; −2,000 bp, 5′-GATTTTATGATAATATTTCCATAACTTTCCTTT-3′). The binding reactions were carried out at room temperature in gel shift buffer [1 mM CaCl2, 1 mM MgCl2, 10 mM HEPES (pH 7.9), 50 mM NaCl, 15 mM β-mercaptoethanol, 10% glycerol, 0.1 mg/ml bovine serum albumin, and 1 mg/ml poly(dI:dC)] for 30 min. The protein:DNA complexes were separated in 5% nondenaturing polyacrylamide gels in Tris-glycine-EDTA buffer (25 mM Tris, 200 mM glycine, and 1 mM EDTA) and were visualized by autoradiography.
Chromatin immunoprecipitations.
Nuclear factors that were associated with chromatin in differentiated and undifferentiated 3T3/L1 cells were cross-linked to DNA using formaldehyde (1%). The Epididymal fat depot of control mice was stimulated or not with insulin for 60 min, isolated, and minced, and nuclear factors were cross-linked to DNA using 1% formaldehyde. Cross-linked chromatin was sheared by sonication, and isolated cell lysate was immunoprecipitated using NFAT or isotype-matching immunoglobulin G (IgG) antibodies. After reversed cross-linking and proteinase K digestion, DNA present in the immunoprecipitated chromatin was isolated and PCR was performed to examine the presence of the resistin gene promoter (5′-TGTCCCTTTGGAAATCCCTCTTTC-3′ and 5′-TGCTGAAGAGGAAAGAGACAAATCTT-GCAC-3′). The presence of the glyceraldehyde phosphate-3-dehydrogenase (GAPDH) promoter (5′-GGCTCTCTGCTCCTCCCTGTTCC-3′ and 5′-TCAATGAAGGGGTCGTTGATGGC-3′) was also examined.
Semiquantitative RT-PCR.
Total RNA was isolated from epididymal fat using TRIZOL reagents (Invitrogen). Isolated RNA (1 μg) was reverse transcribed with Superscript II reverse transcriptase (Invitrogen), and cDNA prepared was amplified by PCR, separated, and visualized by agarose gel electrophoresis. At least two amplifications with different cycles were performed. Primers for PCR amplification are the following: PPARγ, 5′-CACAGGCCGAGAAGGAGAAGC-3′ and 5′-AGGGAGGCCAGCATCGTGTAG-3′; NFATc1, 5′-GGGTCAGTGTGACCGAAGAT-3′ and 5′-GGAAGTCAGAAGTGGGTGGA-3′; NFATc2, 5′-CTGCTCATTATTCCCCCAGA-3′ and 5′-GCATCCATGAGAACAGCAGA-3′; NFATc3, 5′-TGGATCTCAGTATCCTTTAA-3′ and 5′-CACACGAAATACAAGTCGGA-3′; NFATc4, 5′-ACCCTCCGGTACAGAGGACT-3′ and 5′-GGCTGCCCTCAGTCTCATAG-3′; GAPDH, 5′-CTGACGTGCCGCCTGGAGAAA-3′ and 5′-TTGGGGGCCGAGTTGGGATAG-3′.
Glucose uptake assays.
In vivo glucose uptake in various tissues were determined during a glucose tolerance test (3). In brief, overnight-fasted mice were injected intraperitoneally with a glucose solution (2.5g/kg) containing 2-DOG (0.2 μCi/g). After 60 min, mice were sacrificed and tissues harvested were homogenized in water. Ice-cold perchloric acid (7%) was added to the homogenate (1:1 [vol:vol]) and centrifuged to remove precipitates. The homogenate was further neutralized with 2.2 mol/liter of KHCO3 and centrifuged, and the 3H remaining in the supernatant was determined by a scintillation counter. The amount of radioactivity was normalized to the total protein concentration and presented.
RESULTS
Expression of NFAT upon adipocyte differentiation, in obesity, and in Nfatc2−/− Nfatc4−/− mice.
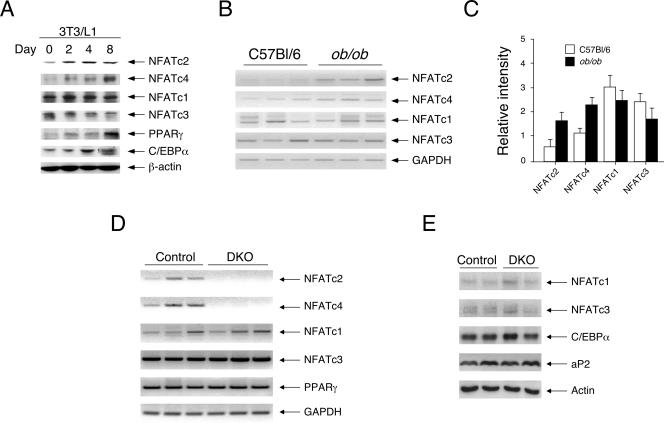
To investigate the role of NFAT in glucose and insulin homeostasis, we determined the expression of members of the NFAT family during adipogenesis. 3T3/L1 preadipocytes were subjected to differentiation in the presence of insulin, dexamethasone, and the phosphodiesterase inhibitor isobutylmethylxanthine, and cell extracts at different stages of differentiation were prepared for immunoblot analysis. Expression of NFATc2 and NFATc4 was induced upon adipocyte differentiation (Fig. 1A). The expression of NFATc2 was induced by day 2 and maintained at a similar level throughout the 8-day adipocyte differentiation. The expression of NFATc4 was induced at day 2 and accumulated to a higher level by day 8 of adipocyte differentiation. Expression of NFATc1 and NFATc3, however, was similar throughout the 8-day adipocyte differentiation. Induction of PPARγ and C/EBPα during adipocyte differentiation was used as a control. Expression of β-actin was used as a loading control. These data indicate that expression of NFATc2 and NFATc4 is induced upon adipocyte differentiation.
FIG. 1.
Expression of NFAT upon adipocyte differentiation, in obesity, and in Nfatc2−/− Nfatc4−/− mice. Expression of NFATc2 and NFATc4 were determined upon adipocyte differentiation using 3T3/L1 cells (A) and with a genetic model of obesity using ob/ob mice (B). Cell extracts from different stages of adipocyte differentiation were examined by immunoblotting analysis to assess the expression of NFAT and C/EBP members (A). The expression of PPARγ and β-actin is also indicated. Semiquantitative RT-PCR was performed to assess the expression level of NFAT messages in epididymal fat depots of 8-week-old control and ob/ob mice (B). Relative intensity of NFAT messages was normalized to the expression of GAPDH and presented (C). The level of NFAT members in epididymal fat depots of Nfatc2−/− Nfatc4−/− mice (DKO) and control Nfatc2−/+ Nfatc4−/+ mice was determined by RT-PCR (D) and immunoblotting analysis (E). The expression level of adipocyte markers (PPARγ, C/EBPα, and fatty acid binding protein aP2) in Nfatc2−/− Nfatc4−/− mice (DKO) or control Nfatc2−/+ Nfatc4−/+ mice was also shown (D and E).
Next, we examined the expression of NFAT with a genetic model of obesity using ob/ob mice. Expression of NFAT in the epididymal fat depot of ob/ob mice fed ad libitum with regular chow was examined by semiquantitative reverse transcription-PCR (RT-PCR) (Fig. 1B and C). Expression of NFATc2 and NFATc4 was induced in ob/ob mice. Neither NFATc1 nor NFATc3 expression was altered in ob/ob mice. The control indicated similar expression of GAPDH in the epididymal fat depot. Together, these data demonstrate that expression of NFATc2 and that of NFATc4 are increased upon adipocyte differentiation and in obesity.
Recent gene targeting studies have revealed important roles of NFAT members in immune and nonimmune systems. For example, disruption of the NFATc1 gene causes early embryonic lethality that is associated with impaired development of heart valves and septa (8, 44). Mice deficient in expression of the NFATc2 and/or NFATc3 gene are viable and appear to have dysregulated adaptive immune responses (17, 52, 57). Although disruption of the NFATc4 gene has been reported, no readily obvious phenotypes are detected (12). NFATc4 is primarily expressed in nonimmune tissues (e.g., muscle, fat, brain) (18), and the lack of a phenotype for NFATc4 null mice suggests that other NFAT members are likely compensating for the loss. Recent studies confirmed the redundancy of the NFATc3 and NFATc4 genes, and the combined null alleles cause embryonic lethality due to vasculature defects (4, 12). Since the expression of NFATc2 and NFATc4 was induced upon adipocyte differentiation and in obese mice, combined disruption of these NFAT members may affect glucose and insulin homeostasis.
We first determined the expression level of NFAT in adipose tissues of Nfatc2−/− Nfatc4−/− mice to ascertain whether there would be compensation by the remaining NFATc1 and NFATc3 members (Fig. 1D and E). Expression of NFATc2 and NFATc4 was only found in Nfatc2−/+ Nfatc4−/+ control mice. The expression level of NFATc1 and NFATc3 was similar in Nfatc2−/+ Nfatc4−/+ control mice and Nfatc2−/− Nfatc4−/− mice. The expression level of adipocyte markers, including PPARγ, C/EBPα, and fatty acid binding protein aP2, in Nfatc2−/+ Nfatc4−/+ control mice and Nfatc2−/− Nfatc4−/− mice was also similar. The lack of compensation by NFATc1 or NFATc3 was corroborated by our previous finding that similar levels of NFATc1 and NFATc3 were found in primary fibroblasts prepared from Nfatc2−/− Nfatc4−/− mice (61). Together, these data indicate that Nfatc2−/− Nfatc4−/− mice provide an in vivo model for examining the role of NFAT in glucose homeostasis and insulin sensitivity.
Nfatc2−/− Nfatc4−/− mice are resistant to high-fat-diet-induced obesity.
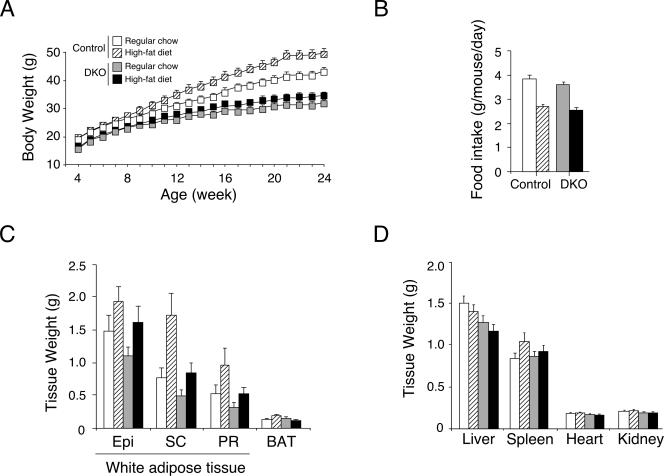
Next, we investigated the physiological consequence of targeted disruption of NFATc2 and NFATc4. Age-matched Nfatc2−/− Nfatc4−/− mice and Nfatc2−/+ Nfatc4−/+ control mice were fed ad libitum with regular chow or a high-fat diet for 20 weeks. Control mice fed a high-fat diet exhibited an increase in body weight gain compared to their littermates fed with regular chow (Fig. 2A). Nfatc2−/− Nfatc4−/− mice, however, exhibited similar body weight gains in both diets. The food intake of Nfatc2−/− Nfatc4−/− mice and that of control mice were similar (Fig. 2B). Increased body weight in control mice was, in part, due to increased adipose content in both white and brown adipose depots, whereas Nfatc2−/− Nfatc4−/− mice exhibited only modest changes (Fig. 2C). Sizes of liver, spleen, heart, and kidney, however, were similar in Nfatc2−/− Nfatc4−/− mice and control mice (Fig. 2D). These data demonstrate that Nfatc2−/− Nfatc4−/− mice are resistant to high-fat-diet-induced obesity.
FIG. 2.
Nfatc2−/− Nfatc4−/− mice are resistant to high-fat-diet-induced obesity. Four-week-old Nfatc2−/− Nfatc4−/− mice (DKO) and control Nfatc2−/+ Nfatc4−/+ mice (n ≥ 15 mice per group) were fed ad libitum with regular chow (10% fat content) or a high-fat diet (59% fat content). Body weight was measured once a week for 20 weeks (panel A). Food intake (panel B) was measured for 12-week-old mice, and weights of various adipose depots (panel C) and tissue organs (panel D) harvested from 24-week-old mice were also shown. Epi, epididymal fat; SC, subcutaneous fat; PR, perirenal fat; BAT, brown adipose tissue.
Nfatc2−/− Nfatc4−/− mice exhibit reduced adiposity.
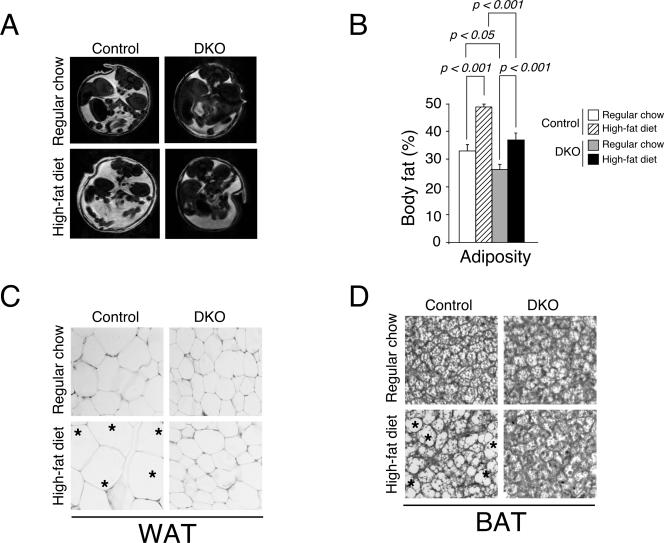
We further confirmed the increase in adipose content by magnetic resonance imaging, which allows assessment of adiposity in vivo (Fig. 3A and B). Cross-sectional image analysis revealed an increase in adiposity in control mice upon high-fat diet challenge. Nfatc2−/− Nfatc4−/− mice, however, exhibited a lesser extent of adiposity with both regular chow and a high-fat diet. These data support that Nfatc2−/− Nfatc4−/− mice are lean and are resistant to diet-induced obesity.
FIG. 3.
Nfatc2−/− Nfatc4−/− mice exhibit reduced adiposity. Cross-sectional image of 12-week-old Nfatc2−/− Nfatc4−/− mice (DKO) and control Nfatc2−/+ Nfatc4−/+ mice by magnetic resonance imaging (A). The measured in vivo adiposity was also shown (B). Pathohistological analysis of white (WAT) (C) or brown (BAT) (D) adipose tissues of DKO and control mice was also shown. Effect of high-fat-diet-elicited obesity was indicated. Asterisks illustrate enlarged adipocytes.
Increase in the cell size of adipocytes, a hallmark of the obese state, is correlated with insulin insensitivity (1, 32). We performed histological analysis to examine adipose tissue of Nfatc2−/− Nfatc4−/− mice and control mice. Increased cell size was found in white and brown adipose tissues of control mice fed with a high-fat diet (Fig. 3C and D). Nfatc2−/− Nfatc4−/− mice fed with a high-fat diet, however, displayed no marked increase in size in adipocytes. The size of adipocytes, indeed, was smaller for Nfatc2−/− Nfatc4−/− mice than for control mice. These data confirm that Nfatc2−/− Nfatc4−/− mice are resistant to diet-induced obesity.
Altered metabolic parameters in Nfatc2−/− Nfatc4−/− mice.
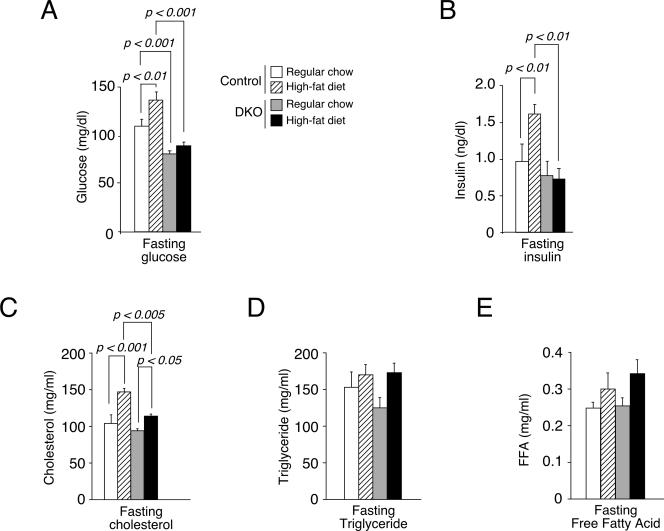
After overnight fasting, the levels of glucose and insulin for Nfatc2−/− Nfatc4−/− mice were lower than those for control mice (Fig. 4A and B). Control mice fed with a high-fat diet exhibited an increased level of glucose and insulin at the fasting state. Nfatc2−/− Nfatc4−/− mice, however, showed minimal changes. The levels of cholesterol, triglyceride, and FFA, however, were affected to a similar extent in both Nfatc2−/− Nfatc4−/− and control mice fed with normal chow (Fig. 4C to E). These data suggest that Nfatc2−/− Nfatc4−/− mice may have altered metabolic parameters.
FIG. 4.
Altered fasting insulin and glucose levels in Nfatc2−/− Nfatc4−/− mice. Glucose and insulin levels of 16-h-fasted Nfatc2−/− Nfatc4−/− (DKO) or control mice were measured (A and B). Levels of cholesterol, triglycerol, and FFA in Nfatc2−/− Nfatc4−/− (DKO) and control mice were also shown (C, D, and E).
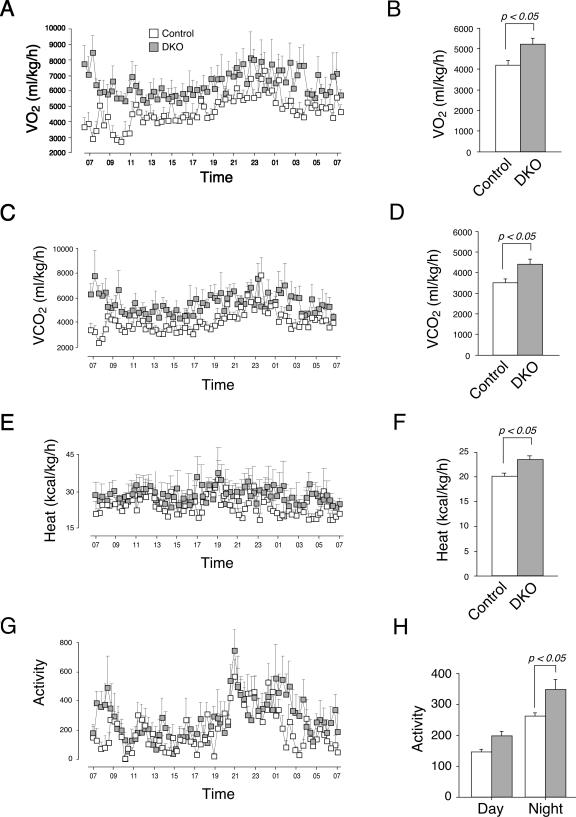
Next, we determined the metabolic rate of the Nfatc2−/− Nfatc4−/− mice and control mice fed ad libitum with regular chow. Oxygen consumption (VO2) of Nfatc2−/− Nfatc4−/− mice was significantly elevated over that of control mice (Fig. 5A and B). Carbon dioxide production (VCO2) of Nfatc2−/− Nfatc4−/− mice was also significantly higher than that of the control mice (Fig. 5C and D). The respiratory quotient (VCO2/VO2), however, was similar (data not shown), suggesting that energy partitioning and utilization of fatty acid and carbohydrate were not affected. In addition, heat production and locomotor activity of Nfatc2−/− Nfatc4−/− mice were significantly higher than those of control mice (Fig. 5E to 5H). Together, these data demonstrate that Nfatc2−/− Nfatc4−/− mice exhibit a higher metabolic rate and heat production, in part, due to increased locomotor activity.
FIG. 5.
Altered metabolic rate in Nfatc2−/− Nfatc4−/− mice. Oxygen consumption (VO2) (A and B), carbon dioxide production (VCO2) (C and D), heat production (E and F), and locomotor activity (G and H) of Nfatc2−/− Nfatc4−/− (DKO) and control mice (n = 8) were measured using an indirect open-circuit calorimeter system.
Increased insulin sensitivity and heightened glucose handling in Nfatc2−/− Nfatc4−/− mice.
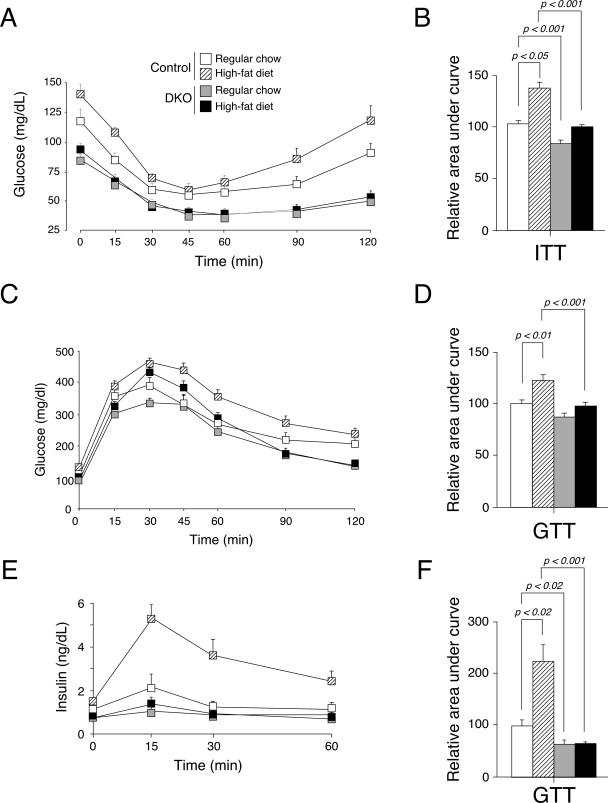
In addition to increased locomotor activity, reduced levels of glucose and insulin in the fasting state suggested that Nfatc2−/− Nfatc4−/− mice might be insulin hypersensitive. We investigated this hypothesis by performing an insulin tolerance test. Intraperitoneal injection of a bolus of insulin decreased the glucose levels of Nfatc2−/− Nfatc4−/− mice and control mice (Fig. 6A). The level of glucose in Nfatc2−/− Nfatc4−/− mice, however, remained low, while the glucose level of control mice recovered. The area under the curve further supported significant changes between control and Nfatc2−/− Nfatc4−/− mice in the insulin tolerance test (Fig. 6B). These data demonstrate that Nfatc2−/− Nfatc4−/− mice are insulin hypersensitive.
FIG. 6.
Increased insulin sensitivity and heightened glucose handling in Nfatc2−/− Nfatc4−/− mice. Nfatc2−/− Nfatc4−/− mice (DKO) and control Nfatc2−/+ Nfatc4−/+ mice fed ad libitum with regular chow or a high-fat diet for 20 weeks (n ≥ 15 mice per group) were subjected to an insulin tolerance test (ITT) (A) and glucose tolerance test (GTT) (C and E). Glucose (A and C) and insulin (E) levels were measured at indicated times and are presented. The area under the curve was also determined (B, D, and F).
We also examined the glucose handling of Nfatc2−/− Nfatc4−/− mice. Oral injection of a bolus of glucose increased serum glucose levels to similar extents in Nfatc2−/− Nfatc4−/− mice and control mice, although mice fed a high-fat diet exhibited markedly elevated glucose levels (Fig. 6C). Time course analysis indicated that the glucose level of control mice dropped and leveled off, whereas the glucose level of Nfatc2−/− Nfatc4−/− mice continued to decline. The area under the curve further supported significant changes between control and Nfatc2−/− Nfatc4−/− mice in the glucose tolerance test (Fig. 6D). Unexpectedly, the insulin level in the serum of Nfatc2−/− Nfatc4−/− mice was minimal compared to that for the control mice upon glucose challenge (Fig. 6E and F). The reduced level of insulin in Nfatc2−/− Nfatc4−/− mice, however, is sufficient to handle the glucose challenge (Fig. 6C). A marked increase in the insulin level was found in control mice fed a high-fat diet, demonstrating impairment in glucose handling in obese mice. Together, these data demonstrate increased insulin sensitivity and heightened glucose handling in Nfatc2−/− Nfatc4−/− mice.
Increased glucose uptake in Nfatc2−/− Nfatc4−/− mice.
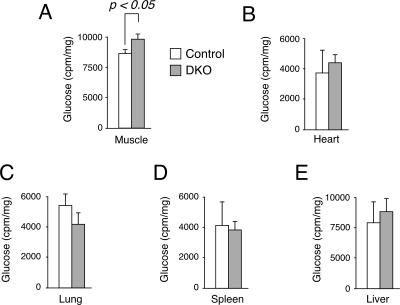
We also performed glucose uptake assays to ascertain the increase in glucose handling in Nfatc2−/− Nfatc4−/− mice (Fig. 7). 2-DOG was used as a nonhydrolyzable tracer and coinjected with a glucose solution during the glucose tolerance test to determine glucose uptake in vivo. In addition to that in skeletal muscle, the extent of glucose uptake in the heart, liver, lung, and spleen was also determined. The amount of 2-DOG accumulated in the skeletal muscle of Nfatc2−/− Nfatc4−/− mice was significantly elevated over that for control mice (Fig. 7A). The amount of 2-DOG accumulated in the heart, liver, lung, or spleen, however, was similar (Fig. 7B to 7E). These data demonstrate that heightened glucose handling in Nfatc2−/− Nfatc4−/− mice can be attributed, in part, to the increased glucose uptake in skeletal muscle.
FIG. 7.
Increased glucose uptake in Nfatc2−/− Nfatc4−/− mice. In vivo glucose uptake was determined by using 2-DOG during the glucose tolerance test. The amounts of [3H]glucose in various tissues were determined by scintillation counter and normalized to protein content and are presented.
Sustained activation of insulin signaling in Nfatc2−/− Nfatc4−/− mice.
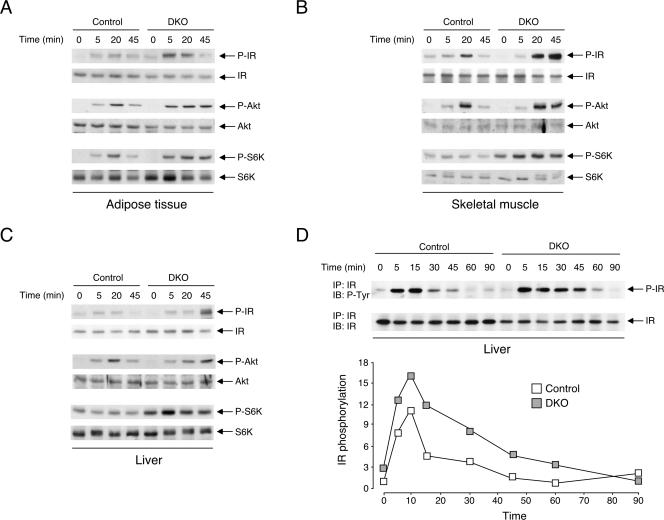
The difference in the glucose tolerance test, insulin tolerance test, and glucose uptake assays suggested that insulin signaling might be altered in Nfatc2−/− Nfatc4−/− mice. We assessed activation of insulin receptor in adipose tissue, skeletal muscle, and liver by immunoprecipitation and subsequent immunoblotting analysis with phospho-Tyr antibody (Fig. 8A to C). Intraperitoneal injection of insulin increased Tyr phosphorylation of insulin receptor of Nfatc2−/− Nfatc4−/− mice and control mice. Time course analysis indicated that Tyr phosphorylation of insulin receptor of Nfatc2−/− Nfatc4−/− mice remained elevated even when insulin receptor activation of control mice subsided. Sustained activation of insulin receptor downstream effectors, such as Akt kinase and ribosomal S6K kinase, was also found in the adipose tissue, skeletal muscle, and liver of Nfatc2−/− Nfatc4−/− mice (Fig. 8A to C). Tyr phosphorylation of insulin receptor of Nfatc2−/− Nfatc4−/− mice finally subsided by 90 min after the initial challenge, compared to 60 min for control mice (Fig. 8D). These data demonstrate that ablation of NFATc2 and NFATc4 increases insulin sensitivity and glucose tolerance, in part, by sustained activation of the insulin signaling pathway.
FIG. 8.
Sustained activation of insulin signaling in Nfatc2−/− Nfatc4−/− mice. Activation of insulin receptor (IR) in adipose tissue (A), skeletal muscle (B), and liver (C) of 8-week-old Nfatc2−/− Nfatc4−/− (DKO) and control mice fed ad libitum with regular chow was determined at times indicated after insulin challenge (0.75 U/kg). Activation of insulin receptor downstream effectors, such as Akt protein kinase and ribosomal S6 kinase (S6K), was also determined by using phospho-Akt (P-Akt) and phospho-S6K (P-S6K) antibodies. Activation of IR was assessed by immunoprecipitation (IP) and subsequent immunoblotting (IB) analysis using phospho-Tyr antibody (P-Tyr). Time course analysis of insulin receptor activation and quantitation of insulin receptor phosphorylation were also illustrated (D).
Sustained activation of insulin signaling in Nfatc2−/− Nfatc4−/− mice is not cell autonomous.
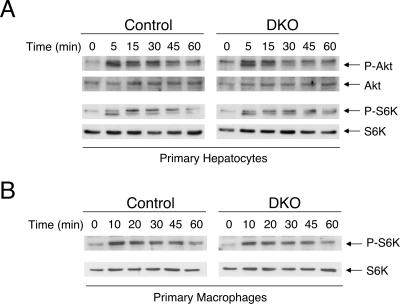
Sustained activation of the insulin signaling pathway may be cell autonomous. For example, dysregulation in the negative feedback loop mediated by Tyr phosphatase (e.g., PTP1B and SHP2) to remove phospho-Tyr at the insulin receptor may cause sustained activation of the insulin receptor. Alternatively, the lack of Ser/Thr phosphorylation on insulin receptor substrate proteins can also lead to sustained activation of the insulin receptor. We tested whether sustained activation of insulin receptor found in Nfatc2−/− Nfatc4−/− mice is cell autonomous by challenging primary hepatocytes with insulin in vitro. If there were dysregulation in the negative feedback loop of the insulin signaling pathway, challenging primary hepatocytes isolated from the Nfatc2−/− Nfatc4−/− mice with insulin in vitro would also result in sustained insulin receptor activation. Unlike the case with insulin administration to Nfatc2−/− Nfatc4−/− mice in vivo, sustained insulin signaling was not found in Nfatc2−/− Nfatc4−/− hepatocytes upon insulin challenge (Fig. 9A). Similarly, primary macrophages isolated from Nfatc2−/− Nfatc4−/− mice did not exhibit sustained activation of the insulin signaling pathway upon challenge (Fig. 9B). Activation of insulin signaling in mouse embryonic fibroblasts prepared from Nfatc2−/− Nfatc4−/− mice and control mice was also indistinguishable (data not shown). Together, these data suggest that a non-cell-autonomous mechanism is involved for the increased insulin sensitivity in the Nfatc2−/− Nfatc4−/− mice.
FIG. 9.
Sustained activation in insulin signaling in Nfatc2−/− Nfatc4−/− mice is not cell autonomous. Primary hepatocytes isolated from Nfatc2−/− Nfatc4−/− (DKO) and control mice were challenged with insulin in vitro for times indicated (A). Cell extracts prepared were used to determine activation of insulin downstream effectors, including Akt and S6K protein kinases, by immunoblotting analysis using phospho-Akt (P-Akt) and phospho-S6K (P-S6K) antibodies. Expression of total Akt and S6K was used as the control. Activation of insulin signaling in primary macrophages isolated from peritoneal cavities of Nfatc2−/− Nfatc4−/− (DKO) or control mice was also determined (B).
Dysregulation in AMPK signaling in Nfatc2−/− Nfatc4−/− mice is also not cell autonomous.
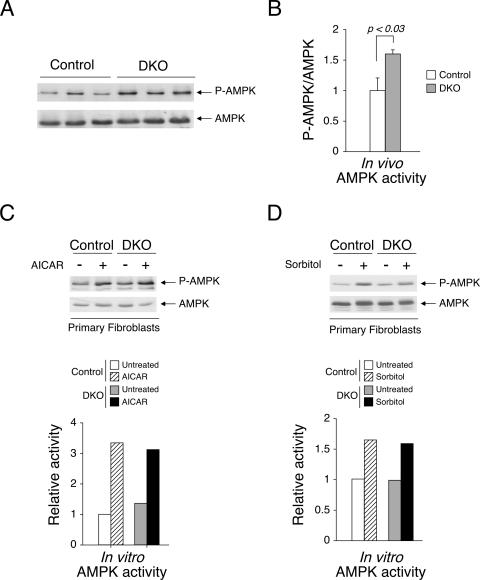
In addition to the insulin signaling pathway, signal transduction mediated by AMPK acts as an energy sensor and reflects a status of insulin sensitivity and glucose handling (23, 31). After an overnight fast, the level of AMPK activation in vivo was elevated for Nfatc2−/− Nfatc4−/− mice over that for control mice (Fig. 10A). Normalizaton of P-AMPK to the level of AMPK expression further supported significant changes between Nfatc2−/− Nfatc4−/− mice and control mice (Fig. 10B). Activation of the AMPK signaling pathway in primary fibroblasts in vitro, however, was similar (Fig. 10C and D). AICAR and sorbitol, which differentially activates different upstream AMPK activators, elicited phosphorylation of AMPK to similar extents in vitro. These data further support that Nfatc2−/− Nfatc4−/− mice exhibit improved insulin/glucose homeostasis by a non-cell-autonomous mechanism.
FIG. 10.
Dysregulation in AMPK signaling in Nfatc2−/− Nfatc4−/− mice is also not cell autonomous. Tissue extracts prepared from adipose depots of overnight-fasted Nfatc2−/− Nfatc4−/− (DKO) and control mice were examined by immunoblotting analysis using phospho-AMPK (P-AMPK) and AMPK antibodies (A). Normalization of P-AMPK/AMPK was also presented (B). In vitro activation of AMPK in primary fibroblasts of Nfatc2−/− Nfatc4−/− (DKO) and control mice using AICAR (500 μM) and sorbitol (500 mM) is also shown (C and D).
Altered adipokine profile in Nfatc2−/− Nfatc4−/− mice.
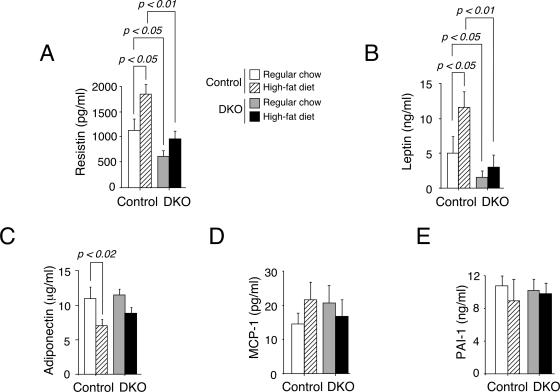
Altered expression of adipokines might account for the dysregulated insulin receptor signal transduction and AMPK activation by a cross talk mechanism. In a manner analogous to its role in cytokine expression in immune cells (7, 19, 20, 33), NFAT may regulate adipokine expression. Next, we determined the level of adipokine in the serum of Nfatc2−/− Nfatc4−/− mice and control mice fed regular chow or a high-fat diet. Lincoplex analysis revealed that insulin insensitivity upon being fed a high-fat diet for control mice correlated with increased resistin and leptin levels and decreased adiponectin level in the serum (Fig. 11). The levels of resistin and leptin in the Nfatc2−/− Nfatc4−/− mice, compared to those in the control mice, were reduced with both regular chow and a high-fat diet (Fig. 11A and B). Similar levels of MCP-1, PAI-1, and adiponectin, however, were found in Nfatc2−/− Nfatc4−/− mice and in control mice (Fig. 11C to E). These data demonstrate changes in the adipokine profile in Nfatc2−/− Nfatc4−/− mice.
FIG. 11.
Altered adipokine profile in Nfatc2−/− Nfatc4−/− mice. Blood from Nfatc2−/− Nfatc4−/− mice (DKO) and control Nfatc2−/+ Nfatc4−/+ mice fed ad libitum with regular chow or a high-fat diet for 20 weeks was harvested by cardiac puncture. Adipokine levels in serum of Nfatc2−/− Nfatc4−/− (DKO) and control mice (n ≥ 8 mice per group) were determined by Lincoplex analysis.
NFAT regulates resistin adipokine gene expression.
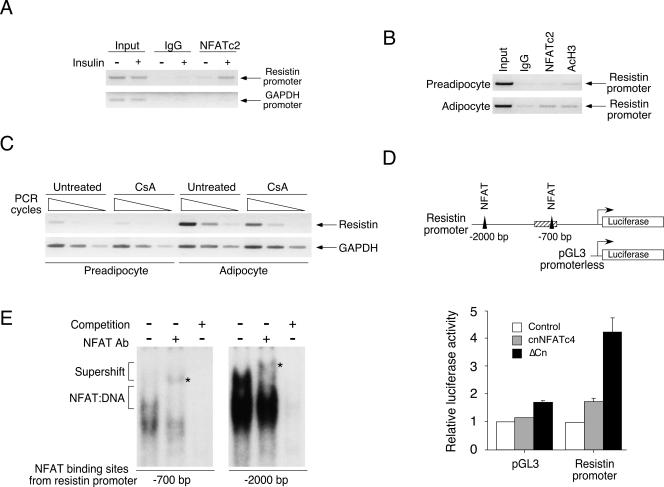
Next, we asked whether NFAT directly regulates adipokine gene transcription. Since previous studies have established that targeted disruption of resistin increases insulin sensitivity (55, 56), we focused on examining whether NFAT directly regulates resistin gene transcription. Sequence analysis indicated that putative NFAT binding elements were located upstream of the resistin promoter. These putative NFAT binding elements were located at −700 and −2,000 bp upstream of the resistin promoter. We performed chromatin immunoprecipitation assays to determine in vivo binding of NFAT to the resistin promoter upon insulin challenge. Mice fed with regular chow were challenged with insulin for 1 h, and adipose depot was harvested, minced, fixed in formaldehyde, and processed for chromatin immunoprecipitation analysis. Chromatin immunoprecipitation analysis demonstrated that NFATc2 was recruited to the resistin promoter upon insulin stimulation (Fig. 12A). Isotype-matching IgG and amplification of the GAPDH loci were used as controls.
FIG. 12.
NFAT regulates resistin adipokine gene expression. Chromatin immunoprecipitation assays were performed to determine binding of NFAT to resistin transcription loci in the epididymal fat depot upon insulin challenge (A; see hatched box in panel D for region investigated). Recruitment of NFAT to the resistin transcription loci upon adipocyte differentiation was also shown (B). Isotype-matching IgG and/or amplification of the GAPDH loci were used as controls. Regulation of resistin gene transcription by NFAT upon adipocyte differentiation was also assessed by RT-PCR analysis (C). Effect of NFAT activation, using constitutive nuclear NFATc4 (cnNFATc4; shaded bars) or constitutive active calcineurin (ΔCn; filled bars), on the resistin promoter (−1 to −2000) and promoterless pGL3 plasmid was determined (D). Luciferase activity was normalized to β-galactosidase activity and presented. Resistin loci investigated by chromatin immunoprecipitation were illustrated as a hatched box, and filled triangles represent NFAT binding elements on the resistin promoter (D). Formation of NFAT-DNA complex at the −700-bp and −2,000-bp NFAT binding elements of the resistin promoter was assessed by gel mobility shift assays (E). Specificity of the NFAT:DNA complex was assessed by supershift analysis using antibody against NFAT (see asterisk for supershifted complex) and competition using excess amounts of unlabeled NFAT oligonucleotides.
Previous studies indicated that resistin gene transcription is markedly increased upon adipocyte differentiation (15, 25). We further confirmed recruitment of NFATc2 to the resistin gene promoter using undifferentiated and differentiated 3T3/L1 cells. Chromatin immunoprecipitation assays demonstrated that NFATc2 bound to the resistin promoter in differentiated adipocytes but not in undifferentiated preadipocytes (Fig. 12B). Association of acetylated histone H3 with the resistin loci was used as a control. Together, these data demonstrate that NFAT is recruited to the resistin loci in adipocytes.
Recruitment of NFAT to the resistin loci suggested that NFAT might regulate resistin gene transcription. We tested this hypothesis by examining expression of resistin mRNA using the immunosuppressant drug cyclosporine A, which inhibits calcineurin phosphatase and blocks NFAT activation. Expression of resistin mRNA in adipocytes was reduced upon cyclosporine A treatment (Fig. 12C). In addition, luciferase reporter assays indicated that the resistin promoter was regulated upon NFAT activation (Fig. 12D). Expression of constitutive nuclear NFAT or constitutive active calcineurin increased resistin promoter activity. Importantly, oligonucleotides encoding NFAT binding elements from the resistin promoter (at −700 and −2,000 bp) bound NFAT in gel mobility shift assays (Fig. 12E). Specificity of the NFAT:DNA complex was assessed by supershift analysis using antibody against NFAT and competition assays with excess amounts of unlabeled NFAT binding oligonucleotides. Together, these data demonstrate that NFAT directly regulates resistin gene transcription.
Serum of Nfatc2−/− Nfatc4−/− mice elicits increased activation in insulin signaling.
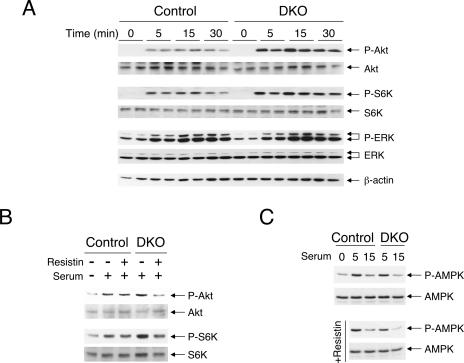
Changes in the adipokine profile in Nfatc2−/− Nfatc4−/− mice, such as reduced resistin expression, might provide a cross talk mechanism for modulation of insulin signaling. We asked whether serum isolated from Nfatc2−/− Nfatc4−/− mice would confer increased activation of the insulin signaling cascade in HepG2 cells. Serum from Nfatc2−/− Nfatc4−/− mice potentiated Akt and S6K activation compared to control serum (Fig. 13A). ERK mitogen-activated kinase, however, was activated to similar extents by control serum and Nfatc2−/− Nfatc4−/− serum. Similar expression levels of Akt, S6K, ERK, and β-actin were used as controls. These data indicate that serum from Nfatc2−/− Nfatc4−/− mice confers sustained activation of insulin signaling.
FIG. 13.
Serum of Nfatc2−/− Nfatc4−/− mice elicits increased activation in insulin signaling. HepG2 cells were challenged with serum isolated from Nfatc2−/− Nfatc4−/− mice (DKO) and control Nfatc2−/+ Nfatc4−/+ mice for the time indicated (A). Activation of Akt and S6K was determined by immunoblotting analysis using phospho-Akt (P-Akt) and phospho-S6K (P-S6K) antibodies. The extent of ERK phosphorylation was also shown. Similar amounts of Akt, S6K, ERK, and β-actin were used as controls. The effect of recombinant resistin on Akt and S6K phosphorylation (B) and AMPK activation (C) elicited by the serum of Nfatc2−/− Nfatc4−/− mice (DKO) and control mice was also shown.
Since NFAT regulates resistin gene transcription and the level of resistin is reduced in Nfatc2−/− Nfatc4−/− serum, we asked whether exogenous resistin would be sufficient to rescue and attenuate the sustained activation of the insulin signaling cascade (Fig. 13B). Administration of recombinant resistin dampened activation of Akt and S6K elicited by serum isolated from Nfatc2−/− Nfatc4−/− mice. A lesser extent of reduction in Akt and S6K activation by recombinant resistin was found in control serum. Similarly, recombinant resistin reduced AMPK activation elicited by serum isolated from Nfatc2−/− Nfatc4−/− mice (Fig. 13C). These data demonstrate that a reduced resistin level, in part, contributes to a non-cell-autonomous mechanism in insulin activation, which in turn improves insulin/glucose homeostasis of Nfatc2−/− Nfatc4−/− mice.
DISCUSSION
Role of NFAT in metabolic regulation.
In this report, we have demonstrated that Nfatc2−/− Nfatc4−/− mice are lean and resistant to diet-induced obesity. These data extend the role of NFAT to metabolic homeostasis, in addition to its role in immunoregulation, cardiac pathogenesis, and neural function. Involvement of NFAT in multiple aspects of physiological function supports the wide distribution of NFAT in different tissues. Since NFAT is vertebrate specific (13), the NFAT group's unique expression in evolution may signify its contribution to complex metabolic regulation in higher eukaryotes.
Obesity has been correlated with various degrees of inflammation. Unlike the intense, acute response upon bacterial infection, obesity is associated with a sustained, low-grade inflammatory stress. We have recently demonstrated a role of NFATc2 in response to inflammatory cytokines, such as interleukin-1 (IL-1) or tumor necrosis factor alpha, in hepatocytes (59). Specifically, expression of NFATc2, but not the other three NFAT isoforms, is up-regulated by inflammatory cytokines. Thus, NFAT may be a critical contributor in inflammatory stress.
Mechanistically, induction of NFATc2 by IL-1 is mediated by transcription factor C/EBP (59). Members of the C/EBP family play a critical role in acute-phase response and in adipocyte differentiation and in obesity (40, 42, 49, 51). Thus, it is tempting to speculate that similar C/EBP-mediated regulation is responsible for NFATc2 induction upon adipocyte differentiation and in the obese state.
Induction of NFATc4, however, may be C/EBP independent. Indeed, recent studies indicate that, similar to NFATc1, induction of NFATc4 is NFAT dependent (2). It is plausible that NFATc2, which is induced at early adipocyte differentiation, may promote expression of NFATc4 to sustain NFAT activation. Hence, in a manner analogous to the induction of C/EBPα by other C/EBP members (C/EBPβ and C/EBPδ), sustained expression of NFAT (NFATc2 and NFATc4) is required during adipocyte differentiation.
Previously, we have demonstrated that NFAT regulates PPARγ2 gene transcription and thus adipocyte differentiation (58-61). PPARγ is proposed as the master regulator of adipogenesis (10, 50, 54). Here, we demonstrate that ablation of NFATc2 and NFATc4 leads to reduced adiposity, supporting a positive contribution of NFAT in adipogenesis. The level of PPARγ2 in Nfatc2−/− Nfatc4−/− mice, however, is similar. Given the critical role of PPARγ2 in adipocyte differentiation, the remaining NFATc1 and NFATc3 may be sufficient to mediate its transcription. Indeed, we have identified a group of targets that are regulated by NFAT in a dose-dependent manner (unpublished data). Since a low level of NFAT activation is sufficient for gene transcription, we surmise that these dose-dependently regulated targets are likely essential genes. Possibly, PPARγ, a master regulator in adipogenesis, may also be dose-dependently regulated by NFAT.
Role of NFAT in adipokine and insulin gene transcription.
In this report, we have demonstrated that compound disruption of NFATc2 and NFATc4 alters the adipokine profile. In a manner analogous to its role in cytokine expression in immune cells, NFAT regulates resistin adipokine gene transcription. Previous studies have established that targeted disruption of resistin increases insulin sensitivity (55, 56). Hence, NFAT may contribute to glucose and insulin homeostasis, in part, by regulating resistin gene expression.
In addition to the resistin gene, NFAT may also regulate other adipokine gene transcription, such as that for adiponectin. In contrast to the case with resistin, expression of adiponectin is positively correlated with insulin sensitivity. Since ablation of NFATc2 and NFATc4 increases insulin sensitivity, it is likely that NFAT may act as a negative regulator and modulate adiponectin gene transcription. Indeed, the fact that the level of adiponectin for Nfatc2−/− Nfatc4−/− mice is similar to that for control mice, albeit with reduced adiposity in Nfatc2−/− Nfatc4−/− mice, supports this notion. Notably, recent studies demonstrated that NFATc4 and ATF3 inhibit adiponectin gene transcription (24). Future differential analysis of Nfatc2−/− Nfatc4−/− mice and control mice to identify additional adipokines is warranted.
How does NFAT contribute to both positive regulation for the resistin gene and negative regulation for the adiponectin gene? The NFAT regulatory element is composed of cytoplasmic (NFATc) and nuclear (NFATn) (reviewed in references 6, 7, and 19). NFATc was identified as calcineurin-regulated NFAT proteins (NFATc1 to NFATc4). NFATn of the IL-2 gene was identified as the AP1 (Fos plus cJun) complex (22). Optimal NFAT-mediated IL-2 gene transcription requires cooperation of NFATc and NFATn. Distinct NFATn has been identified in different NFAT targets. For example, we have demonstrated that NFAT cooperates with C/EBP to mediated PPARγ gene transcription (58). It is possible that a differential NFAT partner influences activation versus repression.
Interestingly, many of the identified NFAT partners are in the bZIP group of transcription factors, such as cJun, Fos, C/EBP, ATF, and Maf. The bZIP group of transcription factors has many members within each subgroup. In addition, members of each subgroup exhibit multiple isoforms generated by alternatively splicing and/or translational initiation. For example, the C/EBP group of bZIP proteins includes C/EBPα, C/EBPβ, C/EBPδ, and C/EBPγ. In the C/EBPα subgroup, different variants have been identified (e.g., LIP and LAP proteins) for positive or negative regulation of gene transcription. Thus, distinct bZIP members/isoforms may influence activation versus repression in NFAT-mediated gene transcription.
In response to an increase in the glucose level, pancreatic beta cells secrete insulin to maintain glucose homeostasis by promoting glucose uptake and by inhibiting glucose output from the liver. In vitro studies have demonstrated that the NFAT signaling pathway cooperates with members of the Maf transcription factor family to regulate insulin promoter activity upon acute glucose stimulation (29, 30). Our in vivo findings support the importance of the NFAT transcription factor in insulin gene regulation. Nfatc2−/− Nfatc4−/− mice exhibit reduced insulin levels at the fasting state. In addition, the Nfatc2−/− Nfatc4−/− mice are glucose and insulin hypersensitive. Insulin hypersensitivity of the Nfatc2−/− Nfatc4−/− mice may be a compensatory response due to the lack of insulin production and subsequent secretion. Alternatively, reduced insulin production/secretion is a consequence of the increased insulin sensitivity of the Nfatc2−/− Nfatc4−/− mice, which may arise from changes in adipokine signaling (such as resistin and adiponectin) and insulin receptor signaling pathway activation. Since a non-cell-autonomous mechanism is suggested for the increased insulin sensitivity in Nfatc2−/− Nfatc4−/− mice, further understanding of the cross talk between adipokines and their role in insulin activation will provide new insights on the treatment of obesity and diabetes.
Conclusions.
In conclusion, we have demonstrated that NFAT contributes to insulin and glucose homeostasis. NFAT also regulates resistin adipokine gene transcription. These results expand the repertoire of NFAT function to metabolic pathogenesis and adipokine gene transcription.
Acknowledgments
We thank members of our laboratories for their critical reading of the manuscript. We also thank the Diabetes Research Training Center and the Marion Bessin Liver Research Center at AECOM for their support.
H.Y.S. is a trainee sponsored by 5T32 GM07491. This research was supported, in part, by grants from the National Institutes of Health (C.-W.C., G.R.C., L.A.J., L.R., and P.E.S.), Howard Hughes Medical Institute (G.R.C.), American Diabetes Association (C.-W.C. and P.E.S.), and American Heart Association (C.-W.C.).
Footnotes
Published ahead of print on 14 August 2006.
REFERENCES
- 1.Ailhaud, G., M. Teboul, and F. Massiera. 2002. Angiotensinogen, adipocyte differentiation and fat mass enlargement. Curr. Opin. Clin. Nutr. Metab. Care 5:385-389. [DOI] [PubMed] [Google Scholar]
- 2.Arron, J. R., M. M. Winslow, A. Polleri, C. P. Chang, H. Wu, X. Gao, J. R. Neilson, L. Chen, J. J. Heit, S. K. Kim, N. Yamasaki, T. Miyakawa, U. Francke, I. A. Graef, and G. R. Crabtree. 2006. NFAT dysregulation by increased dosage of DSCR1 and DYRK1A on chromosome 21. Nature 441:595-600. [DOI] [PubMed] [Google Scholar]
- 3.Boini, K. M., A. M. Hennige, D. Y. Huang, B. Friedrich, M. Palmada, C. Boehmer, F. Grahammer, F. Artunc, S. Ullrich, D. Avram, H. Osswald, P. Wulff, D. Kuhl, V. Vallon, H. U. Haring, and F. Lang. 2006. Serum- and glucocorticoid-inducible kinase 1 mediates salt sensitivity of glucose tolerance. Diabetes 55:2059-2066. [DOI] [PubMed] [Google Scholar]
- 4.Bushdid, P. B., H. Osinska, R. R. Waclaw, J. D. Molkentin, and K. E. Yutzey. 2003. NFATc3 and NFATc4 are required for cardiac development and mitochondrial function. Circ. Res. 92:1305-1313. [DOI] [PubMed] [Google Scholar]
- 5.Chang, C. P., J. R. Neilson, J. H. Bayle, J. E. Gestwicki, A. Kuo, K. Stankunas, I. A. Graef, and G. R. Crabtree. 2004. A field of myocardial-endocardial NFAT signaling underlies heart valve morphogenesis. Cell 118:649-663. [DOI] [PubMed] [Google Scholar]
- 6.Crabtree, G. R. 2001. Calcium, calcineurin, and the control of transcription. J. Biol. Chem. 276:2313-2316. [DOI] [PubMed] [Google Scholar]
- 7.Crabtree, G. R., and E. N. Olson. 2002. NFAT signaling: choreographing the social lives of cells. Cell 109(Suppl.):S67-S79. [DOI] [PubMed] [Google Scholar]
- 8.de la Pompa, J. L., L. A. Timmerman, H. Takimoto, H. Yoshida, A. J. Elia, E. Samper, J. Potter, A. Wakeham, L. Marengere, B. L. Langille, G. R. Crabtree, and T. W. Mak. 1998. Role of the NF-ATc transcription factor in morphogenesis of cardiac valves and septum. Nature 392:182-186. [DOI] [PubMed] [Google Scholar]
- 9.De Souza, A. P., A. W. Cohen, D. S. Park, S. E. Woodman, B. Tang, D. E. Gutstein, S. M. Factor, H. B. Tanowitz, M. P. Lisanti, and L. A. Jelicks. 2005. MR imaging of caveolin gene-specific alterations in right ventricular wall thickness. Magn. Reson. Imaging 23:61-68. [DOI] [PubMed] [Google Scholar]
- 10.Fajas, L., M. B. Debril, and J. Auwerx. 2001. Peroxisome proliferator-activated receptor-gamma: from adipogenesis to carcinogenesis. J. Mol. Endocrinol. 27:1-9. [DOI] [PubMed] [Google Scholar]
- 11.Flegal, K. M., M. D. Carroll, C. L. Ogden, and C. L. Johnson. 2002. Prevalence and trends in obesity among US adults, 1999-2000. JAMA 288:1723-1727. [DOI] [PubMed] [Google Scholar]
- 12.Graef, I. A., F. Chen, L. Chen, A. Kuo, and G. R. Crabtree. 2001. Signals transduced by Ca2+/calcineurin and NFATc3/c4 pattern the developing vasculature. Cell 105:863-875. [DOI] [PubMed] [Google Scholar]
- 13.Graef, I. A., J. M. Gastier, U. Francke, and G. R. Crabtree. 2001. Evolutionary relationships among Rel domains indicate functional diversification by recombination. Proc. Natl. Acad. Sci. USA 98:5740-5745. [DOI] [PMC free article] [PubMed] [Google Scholar]
- 14.Graef, I. A., F. Wang, F. Charron, L. Chen, J. Neilson, M. Tessier-Lavigne, and G. R. Crabtree. 2003. Neurotrophins and netrins require calcineurin/NFAT signaling to stimulate outgrowth of embryonic axons. Cell 113:657-670. [DOI] [PubMed] [Google Scholar]
- 15.Hartman, H. B., X. Hu, K. X. Tyler, C. K. Dalal, and M. A. Lazar. 2002. Mechanisms regulating adipocyte expression of resistin. J. Biol. Chem. 277:19754-19761. [DOI] [PubMed] [Google Scholar]
- 16.Ho, I. C., J. H. Kim, J. W. Rooney, B. M. Spiegelman, and L. H. Glimcher. 1998. A potential role for the nuclear factor of activated T cells family of transcriptional regulatory proteins in adipogenesis. Proc. Natl. Acad. Sci. USA 95:15537-15541. [DOI] [PMC free article] [PubMed] [Google Scholar]
- 17.Hodge, M. R., A. M. Ranger, F. Charles de la Brousse, T. Hoey, M. J. Grusby, and L. H. Glimcher. 1996. Hyperproliferation and dysregulation of IL-4 expression in NF-ATp-deficient mice. Immunity 4:397-405. [DOI] [PubMed] [Google Scholar]
- 18.Hoey, T., Y. L. Sun, K. Williamson, and X. Xu. 1995. Isolation of two new members of the NF-AT gene family and functional characterization of the NF-AT proteins. Immunity 2:461-472. [DOI] [PubMed] [Google Scholar]
- 19.Hogan, P. G., L. Chen, J. Nardone, and A. Rao. 2003. Transcriptional regulation by calcium, calcineurin, and NFAT. Genes Dev. 17:2205-2232. [DOI] [PubMed] [Google Scholar]
- 20.Horsley, V., and G. K. Pavlath. 2002. Nfat: ubiquitous regulator of cell differentiation and adaptation. J. Cell Biol. 156:771-774. [DOI] [PMC free article] [PubMed] [Google Scholar]
- 21.Hotamisligil, G. S. 2003. Inflammatory pathways and insulin action. Int. J. Obes. Relat. Metab. Disord. 27(Suppl. 3):S53-S55. [DOI] [PubMed] [Google Scholar]
- 22.Jain, J., P. G. McCaffrey, V. E. Valge-Archer, and A. Rao. 1992. Nuclear factor of activated T cells contains Fos and Jun. Nature 356:801-804. [DOI] [PubMed] [Google Scholar]
- 23.Kahn, B. B., T. Alquier, D. Carling, and D. G. Hardie. 2005. AMP-activated protein kinase: ancient energy gauge provides clues to modern understanding of metabolism. Cell Metab. 1:15-25. [DOI] [PubMed] [Google Scholar]
- 24.Kim, H. B., M. Kong, T. M. Kim, Y. H. Suh, W. H. Kim, J. H. Lim, J. H. Song, and M. H. Jung. 2006. NFATc4 and ATF3 negatively regulate adiponectin gene expression in 3T3-L1 adipocytes. Diabetes 55:1342-1352. [DOI] [PubMed] [Google Scholar]
- 25.Kim, K. H., K. Lee, Y. S. Moon, and H. S. Sul. 2001. A cysteine-rich adipose tissue-specific secretory factor inhibits adipocyte differentiation. J. Biol. Chem. 276:11252-11256. [DOI] [PubMed] [Google Scholar]
- 26.Kim, S., and N. Moustaid-Moussa. 2000. Secretory, endocrine and autocrine/paracrine function of the adipocyte. J. Nutr. 130:3110S-3115S. [DOI] [PubMed] [Google Scholar]
- 27.Kopelman, P. G. 2000. Obesity as a medical problem. Nature 404:635-643. [DOI] [PubMed] [Google Scholar]
- 28.Lafontan, M. 2005. Fat cells: afferent and efferent messages define new approaches to treat obesity. Annu. Rev. Pharmacol. Toxicol. 45:119-146. [DOI] [PubMed] [Google Scholar]
- 29.Lawrence, M. C., H. S. Bhatt, and R. A. Easom. 2002. NFAT regulates insulin gene promoter activity in response to synergistic pathways induced by glucose and glucagon-like peptide-1. Diabetes 51:691-698. [DOI] [PubMed] [Google Scholar]
- 30.Lawrence, M. C., K. McGlynn, B. H. Park, and M. H. Cobb. 2005. ERK1/2-dependent activation of transcription factors required for acute and chronic effects of glucose on the insulin gene promoter. J. Biol. Chem. 280:26751-26759. [DOI] [PubMed] [Google Scholar]
- 31.Long, Y. C., and J. R. Zierath. 2006. AMP-activated protein kinase signaling in metabolic regulation. J. Clin. Investig. 116:1776-1783. [DOI] [PMC free article] [PubMed] [Google Scholar]
- 32.MacDougald, O. A., and S. Mandrup. 2002. Adipogenesis: forces that tip the scales. Trends Endocrinol. Metab. 13:5-11. [DOI] [PubMed] [Google Scholar]
- 33.Macian, F. 2005. NFAT proteins: key regulators of T-cell development and function. Nat. Rev. Immunol. 5:472-484. [DOI] [PubMed] [Google Scholar]
- 34.Molkentin, J. D., J. R. Lu, C. L. Antos, B. Markham, J. Richardson, J. Robbins, S. R. Grant, and E. N. Olson. 1998. A calcineurin-dependent transcriptional pathway for cardiac hypertrophy. Cell 93:215-228. [DOI] [PMC free article] [PubMed] [Google Scholar]
- 35.Must, A., J. Spadano, E. H. Coakley, A. E. Field, G. Colditz, and W. H. Dietz. 1999. The disease burden associated with overweight and obesity. JAMA 282:1523-1529. [DOI] [PubMed] [Google Scholar]
- 36.Neufeld, D. S. 1997. Isolation of rat liver hepatocytes. Methods Mol. Biol. 75:145-151. [DOI] [PubMed] [Google Scholar]
- 37.Okamoto, H., S. Obici, D. Accili, and L. Rossetti. 2005. Restoration of liver insulin signaling in Insr knockout mice fails to normalize hepatic insulin action. J. Clin. Investig. 115:1314-1322. [DOI] [PMC free article] [PubMed] [Google Scholar]
- 38.Oukka, M., I. C. Ho, F. C. de la Brousse, T. Hoey, M. J. Grusby, and L. H. Glimcher. 1998. The transcription factor NFAT4 is involved in the generation and survival of T cells. Immunity 9:295-304. [DOI] [PubMed] [Google Scholar]
- 39.Peng, S. L., A. J. Gerth, A. M. Ranger, and L. H. Glimcher. 2001. NFATc1 and NFATc2 together control both T and B cell activation and differentiation. Immunity 14:13-20. [DOI] [PubMed] [Google Scholar]
- 40.Poli, V. 1998. The role of C/EBP isoforms in the control of inflammatory and native immunity functions. J. Biol. Chem. 273:29279-29282. [DOI] [PubMed] [Google Scholar]
- 41.Rajala, M. W., and P. E. Scherer. 2003. Minireview: The adipocyte—at the crossroads of energy homeostasis, inflammation, and atherosclerosis. Endocrinology 144:3765-3773. [DOI] [PubMed] [Google Scholar]
- 42.Ramji, D. P., and P. Foka. 2002. CCAAT/enhancer-binding proteins: structure, function and regulation. Biochem. J. 365:561-575. [DOI] [PMC free article] [PubMed] [Google Scholar]
- 43.Ranger, A. M., L. C. Gerstenfeld, J. Wang, T. Kon, H. Bae, E. M. Gravallese, M. J. Glimcher, and L. H. Glimcher. 2000. The nuclear factor of activated T cells (NFAT) transcription factor NFATp (NFATc2) is a repressor of chondrogenesis. J. Exp. Med. 191:9-22. [DOI] [PMC free article] [PubMed] [Google Scholar]
- 44.Ranger, A. M., M. J. Grusby, M. R. Hodge, E. M. Gravallese, F. C. de la Brousse, T. Hoey, C. Mickanin, H. S. Baldwin, and L. H. Glimcher. 1998. The transcription factor NF-ATc is essential for cardiac valve formation. Nature 392:186-190. [DOI] [PubMed] [Google Scholar]
- 45.Ranger, A. M., M. Oukka, J. Rengarajan, and L. H. Glimcher. 1998. Inhibitory function of two NFAT family members in lymphoid homeostasis and Th2 development. Immunity 9:627-635. [DOI] [PubMed] [Google Scholar]
- 46.Rangwala, S. M., and M. A. Lazar. 2000. Transcriptional control of adipogenesis. Annu. Rev. Nutr. 20:535-559. [DOI] [PubMed] [Google Scholar]
- 47.Razani, B., T. P. Combs, X. B. Wang, P. G. Frank, D. S. Park, R. G. Russell, M. Li, B. Tang, L. A. Jelicks, P. E. Scherer, and M. P. Lisanti. 2002. Caveolin-1-deficient mice are lean, resistant to diet-induced obesity, and show hypertriglyceridemia with adipocyte abnormalities. J. Biol. Chem. 277:8635-8647. [DOI] [PubMed] [Google Scholar]
- 48.Rengarajan, J., B. Tang, and L. H. Glimcher. 2002. NFATc2 and NFATc3 regulate T(H)2 differentiation and modulate TCR-responsiveness of naive T(H)cells. Nat. Immunol. 3:48-54. [DOI] [PubMed] [Google Scholar]
- 49.Roesler, W. J. 2001. The role of C/EBP in nutrient and hormonal regulation of gene expression. Annu. Rev. Nutr. 21:141-165. [DOI] [PubMed] [Google Scholar]
- 50.Rosen, E. D., and B. M. Spiegelman. 2001. PPARγ: a nuclear regulator of metabolism, differentiation, and cell growth. J. Biol. Chem. 17:17. [DOI] [PubMed] [Google Scholar]
- 51.Rosen, E. D., C. J. Walkey, P. Puigserver, and B. M. Spiegelman. 2000. Transcriptional regulation of adipogenesis. Genes Dev. 14:1293-1307. [PubMed] [Google Scholar]
- 52.Schuh, K., B. Kneitz, J. Heyer, F. Siebelt, C. Fischer, E. Jankevics, E. Rude, E. Schmitt, A. Schimpl, and E. Serfling. 1997. NF-ATp plays a prominent role in the transcriptional induction of Th2-type lymphokines. Immunol. Lett. 57:171-175. [DOI] [PubMed] [Google Scholar]
- 53.Shoelson, S. E., J. Lee, and M. Yuan. 2003. Inflammation and the IKK beta/I kappa B/NF-kappa B axis in obesity- and diet-induced insulin resistance. Int. J. Obes. Relat. Metab. Disord. 27(Suppl. 3):S49-S52. [DOI] [PubMed] [Google Scholar]
- 54.Spiegelman, B. M. 1997. Peroxisome proliferator-activated receptor gamma: a key regulator of adipogenesis and systemic insulin sensitivity. Eur. J. Med. Res. 2:457-464. [PubMed] [Google Scholar]
- 55.Steppan, C. M., and M. A. Lazar. 2002. Resistin and obesity-associated insulin resistance. Trends Endocrinol. Metab. 13:18-23. [DOI] [PubMed] [Google Scholar]
- 56.Wolf, G. 2004. Insulin resistance and obesity: resistin, a hormone secreted by adipose tissue. Nutr. Rev. 62:389-394. [DOI] [PubMed] [Google Scholar]
- 57.Xanthoudakis, S., J. P. Viola, K. T. Shaw, C. Luo, J. D. Wallace, P. T. Bozza, D. C. Luk, T. Curran, and A. Rao. 1996. An enhanced immune response in mice lacking the transcription factor NFAT1. Science 272:892-895. [DOI] [PubMed] [Google Scholar]
- 58.Yang, T. T., and C. W. Chow. 2003. Transcription cooperation by NFAT.C/EBP composite enhancer complex. J. Biol. Chem. 278:15874-15885. [DOI] [PubMed] [Google Scholar]
- 59.Yang, T. T., P. M. Ung, M. Rincon, and C. W. Chow. 2006. Role of the CCAAT/enhancer-binding protein NFATC2 transcription factor cascade in the induction of secretory phospholipase A2. J. Biol. Chem. 281:11541-11552. [DOI] [PubMed] [Google Scholar]
- 60.Yang, T. T., Q. Xiong, H. Enslen, R. J. Davis, and C. W. Chow. 2002. Phosphorylation of NFATc4 by p38 mitogen-activated protein kinases. Mol. Cell. Biol. 22:3892-3904. [DOI] [PMC free article] [PubMed] [Google Scholar]
- 61.Yang, T. T., Q. Xiong, I. A. Graef, G. R. Crabtree, and C. W. Chow. 2005. Recruitment of the extracellular signal-regulated kinase/ribosomal S6 kinase signaling pathway to the NFATc4 transcription activation complex. Mol. Cell. Biol. 25:907-920. [DOI] [PMC free article] [PubMed] [Google Scholar]


