

Abstract
Classifying patients as “active” or “passive” with regard to healthcare decision making is misleading, since patients have different desires for different components of the decision making process. Distinguishing patients’ desired roles is an essential step towards promoting care that respects and responds to individual patients’ preferences. We included items on the 2004 Wisconsin Longitudinal Study mail survey measuring preferences for four components of the decision making process: physician knowledge of patient medical history, physician disclosure of treatment choices, discussion of treatment choices, and selection of treatment choice. We characterized preference types for 5,199 older adults using cluster analysis. Ninety-six percent of respondents are represented by four preference types, all of which prefer maximal information exchange with physicians. Fifty-seven percent of respondents wanted to retain personal control over important medical decisions ("autonomists"). Among the autonomists, 81% preferred to discuss treatment choices with their physician. Thirty-nine percent of respondents wanted their physician to make important medical decisions ("delegators"). Among the delegators, 41% preferred to discuss treatment choices. Female gender, higher educational attainment, better self-rated health, fewer prescription medications, and having a shorter duration at a usual place of care predicted a significantly higher probability of the most active involvement in discussing and selecting treatment choices. The overwhelming majority of older adults want to be given treatment options and have their physician know everything about their medical history; however, there are substantial differences in how they want to be involved in discussing and selecting treatments.
Keywords: US, decision making, patient preferences, communication, survey research, cluster analysis
Introduction
Successful physician-patient communication about decision making plays a critical role in healthcare delivery, yet there are conflicting messages about changing roles for physicians and patients. A mandatory role for patients as autonomous decision makers has recently been recommended, since patients alone weather the consequences of their medical care (McNutt, 2004). However, others advocate that patients be allowed to participate to the extent they desire, completely delegating decisions to their physicians if they so choose (Whitney, McGuire, & McCullough, 2004). The model of patient participation where both physician and patient communicate information and values and make decisions together–called shared decision making–has been embraced in literature (Charles, Gafni, & Whelan, 1999; Emanuel & Emanuel, 1992; Quill & Brody, 1996), and the Institute of Medicine has recommended including it in medical school curricula as a mechanism to improve care (Institute of Medicine, 2004). Yet there has been little discussion resolving the potential conflict between promoting shared decision making as ideal and accommodating individual patient preferences for participation (or lack of participation) in decision making.
There is evidence that not all components of the shared decision making model are equally desired by patients. Early work in this area identified 2 distinct components of patient participation: information exchange and decision making (Ende, Kazis, Ash, & Moskowitz, 1989; Ong, de Haes, Hoos, & Lammes, 1995; Strull, Lo, & Charles, 1984). Later work further refined the components to 3: information exchange, deliberation, and decisional control (Charles, Gafni, & Whelan, 1999). It is well established that patients want to receive information from their physicians almost universally (Deber, Kraetschmer, & Irvine, 1996; Ende, Kazis, Ash et al., 1989; Nease & Brooks, 1995), but less is known about information transmission, that is, patient preferences for providing information to their physicians. Preferences for deliberation (i.e., formal discussion about options) and preferences for decisional control (i.e., power over the final selection of treatment) are known to differ substantially among patients (Robinson & Thomson, 2001), although it is unclear whether patients who prefer discussing treatment options also prefer making the final decision about treatment. Where one study suggests that patients do not want to be involved in problem-solving tasks while retaining control over decisions (Deber, Kraetschmer, & Irvine, 1996), others advise patient involvement in both stages (Quill & Brody, 1996). Often the concept of deliberation as distinct from decisional control is ignored entirely.
Consequently, there is little information available to assist clinicians in understanding and distinguishing the different roles patients prefer in the decision making process. Distinguishing these roles is an essential step towards promoting patient-centered care, care that respects and responds to individual patients’ preferences (Gerteis, Edgman-Levitan, Walker, Stoke, Cleary, & Delbanco, 1993). Physicians have been classified according to their attitudes about paternalism, patient autonomy, and deliberation (Falkum & Forde, 2001), but patients have not been similarly characterized according to their preferences for participation in multiple, distinct stages of healthcare decision making.
To address this gap, we categorize a population-based cohort of older adults into types based on preferences for participation in each of four components of healthcare decision-making (physician knowledge of patient, physician disclosure of treatment choices, discussion of treatment choices, and selection of treatment choice). We then describe the preference types with respect to key sociodemographic and health variables. We use data from the Wisconsin Longitudinal Study (WLS), which for 47 years has followed over 10,000 men and women who graduated from Wisconsin high schools in 1957. Respondents have completed extensive telephone and mail surveys with high sample retention and represent a wide variety of health states.
Conceptual Model
Several models of decision making have been described. In the paternalistic model, physicians perform information management, assess options, and make treatment decisions for patients (presumably in patients’ best interests) without consideration of patient preferences (Katz, 1984). This model assumes that there are objective criteria to determine the best course of action, that physicians choose this course of action and that patients assent to this course with gratitude (Emanuel & Emanuel, 1992). It is also assumed that patients who prefer not to make the final decision also do not want to participate more than minimally in information exchange or discussing options. Conversely, in the informed or consumer model, physicians provide all relevant information to their patients, and patients alone assess their options and make the final decision. The physician in this model serves as a technical expert to provide information and facilitate decisions made by a fully autonomous patient (Emanuel & Emanuel, 1992). Again assumptions are made about the congruence of preferences for information, deliberation, and decisional control, namely, that patients who want to make the final decision do not want to first discuss all the options with physicians. The shared model merges these models into one where patients and physicians participate equally in all stages of decision-making (Charles, Gafni, & Whelan, 1999). This model assumes that patients want equal participation with their physicians at every stage. Variations of this model include the interpretive and deliberative models, which differ in their treatment of patient values (Emanuel & Emanuel, 1992). However, none of these models accommodates situations where patients want to participate to different degrees in different stages.
This paper categorizes older adults into types based on preferences for participation in healthcare decision making using the Charles, Gafni, and Whelan (1997, 1999) framework, which describes decision-making in 3 analytic stages: (1) information exchange (sub-categorized into flow, direction, type, and amount), (2) deliberation, and (3) control over the final decision. Although the shared decision making model Charles et al. outlined has been extensively cited (Thomson ISI, 2003), an explicit test of the model showed that in 62 consultations regarding prescription drugs, there was little evidence that both parties were involved or shared information, let alone shared deliberation or decisional control (Stevenson, Barry, Britten, Barber, & Bradley, 2000). Though not explicitly based on the Charles et al. framework, when Norwegian physicians were profiled with respect to their attitudes toward paternalism, patient autonomy, and deliberation, only 15% were pure paternalists, 19% fit under the informed model (autonomists), and 12% could be called shared (deliberationists) (Falkum & Forde, 2001). The approach to categorizing decision making as purely paternalistic, informed, or shared is clearly limited in its ability to accurately reflect actual practice, as Charles et al. acknowledge (1999). To address this, we develop a typology that allows the components of the decision-making process to vary within patients, e.g., a strong preference for discussing treatment options does not necessarily indicate a strong preference for retaining control over the decision. By allowing patients to vary in their preferences for each of the dimensions, our typology may better reflect the complex nature of patient preferences for participation in healthcare visits.
No single validated instrument exists to measure preferences for participation in all components of the decision making process as conceptualized by Charles et al. (1999), though two validated instruments capture fundamental parts. The Autonomy Preference Index (API) includes two scales to distinguish between information seeking and decision making (Ende, Kazis, Ash et al., 1989), and the Health Opinions Survey (HOS) includes two scales to distinguish between preferences for information and behavioral involvement (Krantz, Baum, & Wideman, 1980). A comparison of these two instruments identified differences in how they framed questions, specifically that the API focuses on what patients prefer the physician to do and the HOS asks what the patient usually does (Nease & Brooks, 1995). Because we were interested in preferences rather than respondent-reported behaviors, we favored the decisional control items in the API. However, the API was limited for our purposes because information exchange is measured only in the direction of doctor to patient and there are no explicit items about deliberation. Similarly the HOS does not measure information exchange from patient to physician, but the information subscale does include items about being given choices, which is the basis for the discussing options during deliberation. We operationalized the components of patient participation in decision making by including items from these validated instruments when possible, but we developed our own item to assess preference for physician knowledge of patient. The other frequently used method to elicit the role patients prefer is illustrated response cards (Degner & Sloan, 1992), but this option was not feasible given constraints of the WLS mail-survey. Additionally, the illustrated response cards would not distinguish preferences for physician knowledge of patient or discussion of treatment choices.
We expected that respondents would have high preferences for information about treatment choices from their physicians but would vary in their preferences for the other components of decision making. Since female gender,(Kaplan, Gandek, Greenfield, Rogers, & Ware, 1995) higher education (Kaplan, Gandek, Greenfield et al., 1995; Thompson, Pitts, & Schwankovsky, 1993), and better health (Degner & Sloan, 1992; Ende, Kazis, Ash et al., 1989) have been associated with preferences for increased participation in healthcare decision making, we expect to find similar relationships in the WLS population as well (Kaplan, Gandek, Greenfield et al., 1995; Thompson, Pitts, & Schwankovsky, 1993). We also expect to see preferences vary according to interactions with the healthcare system or specific providers. There is some evidence that chronic illness visits are positively associated with increased shared decision making (Gotler, Flocke, Goodwin, Zyzanski, Murray, & Stange, 2000). We expect that respondents with greater illness burden or more prescription medications will prefer more active participation.
Methods
Population and Sampling
The WLS graduate survey is a long-term cohort study of a 1/3 random sample (N=10,317) of men and women who graduated from Wisconsin high schools in 1957. Survey data were collected in 1957, 1964, 1975, 1992, and 2004. Roughly 2/3 of respondents still reside in Wisconsin, with the number of participants in each county roughly proportional to the county’s total population. The remaining 1/3 of the sample is spread throughout the U.S. and abroad. The response rate for the 2004 telephone survey was 80%, and among telephone respondents the response rate for the mail survey was 89%. Our analysis was conducted on respondents who had complete data for all preference items (N=5,199 of 5,322 who completed both the telephone and mail surveys by March 2004).
Data Collection
All surviving WLS graduates were fielded for contact via telephone, and 75-minute interviews were conducted and audio-recorded using computer-assisted techniques. Respondents who completed the telephone survey received a 54-page mail-back survey. The WLS surveys focus on social, psychological, and economic factors. In the 2004 round, we added items on preferences for participation in healthcare decision making on the mail survey. All new items were pilot-tested and underwent extensive cognitive interviews on a sample of 40 subjects. The preference items used in this analysis were pilot-tested on an additional sample of 15, with extensive cognitive interviewing of 2 adults with chronic illness. This study was approved by the Institutional Review Board at the University of Wisconsin-Madison.
Variables
The preference items assess respondent preferences during healthcare visits for physician knowledge of patient, disclosure of treatment choices, discussion of treatment choices, and selection of treatment choice. Preferences for participation may be different depending on the nature of a particular decision, but because this was a population-based sample of older adults, we included broad-spectrum items rather than situation- or disease-specific items. Respondents were instructed to “please think about the doctor that you usually go to when you are sick or need advice about your health and indicate how much you agree or disagree with each statement.” The preference items were coded on a 5-point scale from 1=agree strongly to 5=disagree strongly and were reversed scored when necessary so that all items indicate preferences for more information, more choices in deliberation, or personal control over making the decision.
Physician knowledge of patient was measured using an item we created, “I believe that my doctor needs to know everything about my medical history to take good care of me.” The wording in this item is meant to gauge how much information patients want their doctors to know about them. Because the literature suggests that most people prefer to exchange a high degree of information with physicians, we used strong wording (“everything about my medical history”) to create a less highly skewed distribution.
Disclosure of treatment choices was measured using an item from the Autonomy Preference Index’s information-seeking scale (Ende, Kazis, Ash et al., 1989), “When there is more than one method to treat a problem, I should be told about each one.” The main advantage of this item is that is refers to a situation where a true choice exists (“more than one method”), which is the situation generally touted as ideal for shared decision making (Whitney, McGuire, & McCullough, 2004). This item was also chosen because of its generality, i.e., preference for information not specific to laboratory tests, illness, side effects of medication, etc.
Discussion of treatment choices was measured using an item adapted from the Krantz Health Opinion Survey (Krantz, Baum, & Wideman, 1980), “I would rather have my doctor make the decisions about what’s best for my health than to be given a whole lot of choices” (reverse coded). This item was chosen to reflect preference for traditional paternalistic style or an approach that involves the patient in assessment by giving them many options.
Selection of treatment choice was measured using an item from the Autonomy Preference Index’s decision-making preference scale (Ende, Kazis, Ash et al., 1989), “The important medical decisions should be made by my doctor, not by me” (reverse coded). Again, this item was chosen because of its broad scope–it does not explicitly refer to either everyday medical problems or decisions for hospitalized patients.
We describe respondents with respect to key sociodemographic, health, and physician-patient relationship factors from the 2003–04 telephone and mail surveys. Sociodemographic variables included gender, marital status, educational attainment, and health insurance status. Insurance was self-reported and recoded into 5 categories—private insurance, Medicare with additional private insurance, Medicare with or without additional public insurance, other public insurance (Medicaid and military coverage), and uninsured. We included a global 5-point measure of self-rated health (1=excellent, 2=very good, 3=good, 4=fair, 5=poor), the number of common illnesses and conditions according to the OARS schedule (Duke University Center for the Study of Aging and Human Development, 1978), and the number of self-reported prescription medications taken regularly. The physician-patient relationship variables we included were the length of relationship (in years) with both a usual place and usual physician of care.
Statistical Methods
Our goal was to see if distinct types of individuals existed. We used cluster analysis to organize respondents into meaningful structures based on the 4 preference items. Cluster analysis assigns individuals to distinct groups based on the similarity of observed characteristics. While the methods of assignment vary, all clustering algorithms attempt to put individuals into groups such that the characteristics of any pair of individuals within any group are more alike than any pair of individuals between two groups (Gordon, 1999). Cluster analysis has been used previously in health services research to create a taxonomy of health networks and systems by the types of services offered and arrangements with physicians (Bazzoli, Shortell, Dubbs, Chan, & Kralovec, 1999; Dubbs, Bazzoli, Shortell, & Kralovec, 2004).
We performed the cluster analysis using both hierarchical and non-hierarchical (partition) methods using a joining algorithm based on similarity measured by Euclidean (geometric) distance (StataCorp, 2003). Within the hierarchical methods, clusters were joined using the three most common joining techniques, which include single, complete, and average linkage. Our final typology of patient preferences was based on hierarchical agglomerative cluster analysis using average linkage. We chose hierarchical clustering because it allows smaller clusters to be nested within larger ones (StataCorp, 2003) reflecting gradation in preferences. We chose average linkage because it allows clusters to be related hierarchically but does not depend on our prior knowledge that the clusters resemble chains (single linkage) or are spatially compact (complete linkage) (Kaufman & Rousseeuw, 1990).
Cluster solutions with fewer than 15 observations were ignored for the purpose of manageability and generalizability. To explore the pattern of scores across the 4 dimensions of the decision-making process, we calculated the mean values of the preference items for each cluster solution that we examined. We examined the differences between means for the clusters between 3 and 20 solutions. The number of clusters to choose is discretionary (Schonlau, 2002); we chose 11 cluster solutions because of substantive differences between means for clusters in this solution compared to 10 and 12 solutions (after 11 cluster solutions, the breaks did not identify distinctly different preference types).
We assessed the reliability of cluster solutions by conducting separate analyses on each WLS random replicate–the WLS sample was divided into 10 random replicates for data collection–to determine if the same cluster solutions were identified for each replicate. The patterns of cluster solutions (preference types) were nearly identical in each of the random replicates. The percentage of respondents who fell into each preference type varied; however, the percentage in the top 4 types combined was nearly the same across all replicates. Additionally, we examined a variety of pictorial representations of the data to confirm that the data were not evenly distributed across the spectrum of possible preference mixes and that our finding of distinct clusters was robust.
We used multinomial logistic regression to predict the adjusted probabilities of the preference types for each sociodemographic, health, and relationship variable, with all other variables in the model held at their population means. Ninety-five percent confidence intervals were calculated using the delta method (Xu & Long, 2005). We found no evidence that our outcome categories did not meet the assumption of independence of irrelevant alternatives according to a generalized Hausman specification test based on the seemingly unrelated estimation command in Stata (Weesie, 1999). Results were considered statistically significant at p-value < 0.05. Data were analyzed using SAS 8.2 (SAS Institute, 2002) and Stata 8.0 (StataCorp, 2003).
Results
Distribution of Responses for Each Preference Item
The overwhelming majority of respondents want to engage in information exchange with physicians (Table 1). Over half of respondents agreed strongly that their doctor needs to know everything about their medical history to take good care of them, roughly 4% were neutral, and 1% disagreed or disagreed strongly. Similarly, over half of respondents agreed strongly with wanting their physician to disclose all treatment options, while only 2% were neutral and less than 1% disagreed. The 2 information exchange items had an inter-item correlation of 0.42.
Table 1.
Distribution of responses to items describing preferences for decision-making with usual provider. N=5,199
| Percent (%) of respondents in
each category |
|||||
|---|---|---|---|---|---|
| Items | Agree Strongly | Agree | Neutral | Disagree | Disagree Strongly |
| When there is more than one method to treat a problem, I should be told about each one | 59.7 | 37.8 | 2.2 | 0.3 | 0.0 |
| I believe that my doctor needs to know everything about my medical history to take good care of me | 53.9 | 40.7 | 4.4 | 0.9 | 0.1 |
| I would rather have my doctor make decisions about what's best for my health than to be given a whole lot of choices* | 4.9 | 17.2 | 19.5 | 35.9 | 22.5 |
| The important medical decisions should be made by my doctor, not by me* | 5.7 | 17.9 | 20.3 | 36.1 | 20.0 |
Reverse scored for analysis
Wider variation was seen in the remaining two items. Just over half of respondents wanted to be offered a lot of treatment choices rather than having their doctor make decisions about what’s best for their health, about 20% of respondents were neutral, and nearly a quarter reported not wanting this deliberation. Again, over half of respondents wanted to retain personal control over important medical decisions, about 20% of respondents were neutral, and nearly 25% preferred doctor selection of important decisions. These 2 items had an inter-item correlation of 0.56.
A Typology of Preferences for Participation in Decision Making
The 4 largest cluster solutions represented 96% of respondents (Figure 1). As expected, most respondents want disclosure of all possible treatment options from physicians, and most also want physicians to know everything about them. Consequently, the distinguishing feature of these four most prevalent cluster solutions is the variation in preferences for discussing and selecting treatment choices, representing the four possible combinations of high and low on these two items. We labeled the types that wanted to be offered many choices “deliberative.” Conversely, those types that did not want many choices we called “non-deliberative.” We labeled the types that characterized patients who wanted to make the important decisions themselves “autonomists.” Conversely, we labeled the types that preferred a doctor make the important decisions “delegators.”
Figure 1.
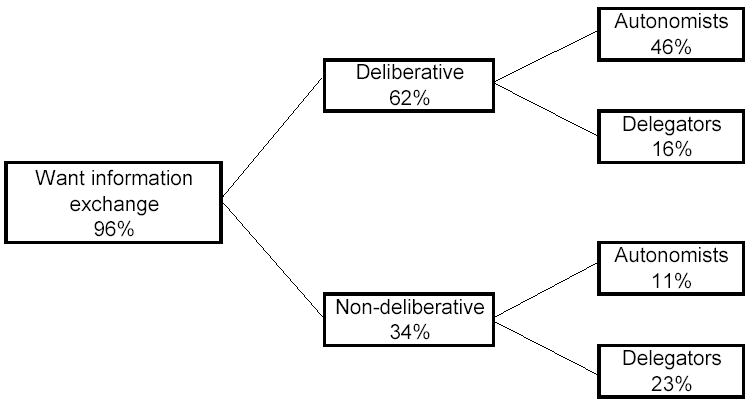
Percent who desire each component of the decision making process for the four most prevalent preference types.
The four most prevalent preference types were non-deliberative delegators (23%), deliberative delegators (16%), non-deliberative autonomists (11%), and deliberative autonomists (46%) (Table 2). Each of these four types had high average values on the information exchange items (Figure 2). Non-deliberative delegators preferred low deliberation and doctor control over decisions while deliberative delegators preferred high deliberation and doctor control. Non-deliberative autonomists preferred low deliberation and personal control over decisions while deliberative autonomists preferred high deliberation and personal control. Three smaller types incorporated the remaining 4% of respondents (Table 2). Although these types had small numbers, we included them as they represent the full range of patient preferences for participation. The groups we labeled “suspicious deliberative autonomists” and “uninformed deliberative autonomists” are nearly identical to deliberative autonomists except they scored low on wanting physicians to know everything about them and receive information from physicians, respectively. Less than half of 1% of respondents could not be characterized by any of these types.
Table 2.
Typology of patient preferences for participation in decision making, including number (N) and percent (%) of respondents in each type and the mean values (standard deviations) for each item used to construct the typology. N=5,199
| Mean value* (standard deviation)
for each item used to construct typology |
||||||
|---|---|---|---|---|---|---|
| Types | N | % | Physician knowledge of patient | Disclosure of treatment choices | Discussion of treatment choices | Selection of treatment choice |
| Non-deliberative Delegator | 1226 | 23 | 4.3(0.62) | 4.3(0.60) | 2.1(0.66) | 2.2(0.71) |
| Deliberative Delegator | 844 | 16 | 4.8(0.39) | 4.8(0.43) | 3.8(0.75) | 2.4(0.66) |
| Non-deliberative Autonomist | 559 | 11 | 4.5(0.60) | 4.6(0.52) | 2.4(0.68) | 4.2(0.41) |
| Deliberative Autonomist | 2390 | 46 | 4.6(0.50) | 4.7(0.48) | 4.4(0.51) | 4.3(0.59) |
| Suspicious Deliberative Autonomist | 133 | 3 | 2.7(0.46) | 4.4(0.50) | 4.2(0.49) | 4.0(0.90) |
| Uninformed Deliberative Autonomist | 29 | 1 | 4.1(0.77) | 2.8(0.38) | 3.8(0.47) | 3.9(0.41) |
| Other | 18 | 0 | -- | -- | -- | -- |
Higher mean values indicate preference for more information, discussion, or personal choice.
Figure 2.
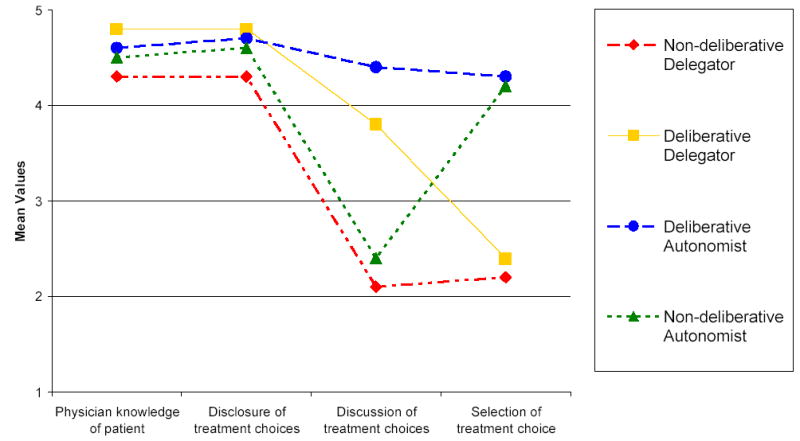
Mean values of preference items for the four most prevalent preference types.
Descriptive Characteristics for Preference Types
Overall, WLS respondents tend to be married, insured, have very good or excellent health with few illnesses or prescription medications, and have relatively long relationships with their physician or place of care (Table 3). However, the characteristics of respondents in the 4 most prevalent preference types differed substantially (Table 4). Males, respondents with less education, poorer self-rated health, fewer OARS conditions, or longer relationships at a usual place of care were significantly more likely to be non-deliberative delegators. Respondents with less education or more prescription medications were significantly more likely to be deliberative delegators. Females, respondents with more education, better self-rated health, more OARS conditions, fewer prescription medications, or shorter relationships at a usual place of care were significantly more likely to be deliberative autonomists. There were no significant differences among sociodemographic or health factors for non-deliberative autonomists. Marital status, insurance status, and length of relationship with a usual physician did not predict preference type (data not shown).
Table 3.
Unadjusted sociodemographic and health characteristics of WLS respondents. N=5,199
| Variable | Percent | Variable | Percent |
|---|---|---|---|
| Gender | Self-rated health | ||
| Male | 45 | Excellent | 25 |
| Female | 55 | Very good | 39 |
| Marital status | Good | 27 | |
| Married | 80 | Fair | 7 |
| Not married | 20 | Poor | 2 |
| Education | # of OARS conditions | ||
| High School | 56 | 0–1 | 20 |
| Some college | 15 | 2–3 | 39 |
| College degree | 14 | 4+ | 41 |
| Postgraduate degree | 15 | # of prescription medications | |
| Health insurance | 0 | 20 | |
| Private | 58 | 1–2 | 35 |
| Medicare + other private | 30 | 3+ | 45 |
| Medicare | 7 | Relationship length at usual place | |
| Other public | 2 | 0–4 years | 25 |
| None | 3 | 5–14 years | 29 |
| 15+ years | 46 | ||
| Relationship length with usual provider | |||
| 0–4 years | 38 | ||
| 5–14 years | 35 | ||
| 15+ years | 27 | ||
Table 4.
Mean predicted probability (95% confidence intervals) of preference type, overall and by key sociodemographic and health variablesa. N=5,199
| Variable | Non-deliberative Delegator (N=1,226) | Deliberative Delegator (N=844) | Deliberative Autonomist (N=2,390) | Non-deliberative Autonomist (N=559) |
|---|---|---|---|---|
| Overall | 0.24 (0.237, 0.243) | 0.17 (0.165, 0.167) | 0.48 (0.479, 0.486) | 0.11 (0.111, 0.112) |
| Gender | ||||
| Male | 0.29 (0.27, 0.31) | 0.17 (0.16, 0.19) | 0.42 (0.4, 0.44) | 0.12 (0.1, 0.13) |
| Female | 0.18 (0.17, 0.2) | 0.17 (0.15, 0.18) | 0.54 (0.52, 0.56) | 0.11 (0.1, 0.12) |
| Education | ||||
| High school | 0.30 (0.28, 0.32) | 0.18 (0.17, 0.2) | 0.40 (0.38, 0.42) | 0.12 (0.109, 0.13) |
| Some college | 0.21 (0.18, 0.23) | 0.17 (0.14, 0.2) | 0.51 (0.47, 0.55) | 0.12 (0.09, 0.14) |
| College degree | 0.13 (0.11, 0.16) | 0.15 (0.12, 0.18) | 0.61 (0.58, 0.65) | 0.10 (0.08, 0.12) |
| Postgraduate degree | 0.12 (0.09, 0.14) | 0.13 (0.1, 0.15) | 0.66 (0.63, 0.7) | 0.09 (0.07, 0.113) |
| Self-rated health | ||||
| Excellent | 0.17 (0.15, 0.19) | 0.19 (0.16, 0.21) | 0.53 (0.5, 0.57) | 0.11 (0.09, 0.13) |
| Very good | 0.22 (0.2, 0.24) | 0.17 (0.16, 0.19) | 0.48 (0.46, 0.51) | 0.12 (0.1, 0.13) |
| Good | 0.27 (0.25, 0.3) | 0.16 (0.14, 0.18) | 0.45 (0.43, 0.48) | 0.12 (0.1, 0.14) |
| Fair | 0.30 (0.25, 0.36) | 0.15 (0.11, 0.19) | 0.41 (0.35, 0.47) | 0.13 (0.09, 0.17) |
| Poor | 0.33 (0.23, 0.42) | 0.15 (0.08, 0.22) | 0.47 (0.36, 0.57) | 0.05 (0.01, 0.1) |
| # of OARS conditions | ||||
| 0–1 | 0.28 (0.255, 0.32) | 0.17 (0.14, 0.19) | 0.44 (0.4, 0.47) | 0.11 (0.09, 0.13) |
| 2–3 | 0.24 (0.22, 0.25) | 0.17 (0.16, 0.18) | 0.48 (0.46, 0.493) | 0.11 (0.1, 0.12) |
| 4+ | 0.19 (0.18, 0.21) | 0.17 (0.15, 0.19) | 0.52 (0.491, 0.54) | 0.12 (0.1, 0.13) |
| # of prescription medications | ||||
| 0 | 0.21 (0.19, 0.24) | 0.13 (0.11, 0.1512) | 0.54 (0.5, 0.57) | 0.12 (0.1, 0.14) |
| 1–2 | 0.22 (0.21, 0.24) | 0.16 (0.1506, 0.17) | 0.50 (0.48, 0.51) | 0.12 (0.11, 0.13) |
| 3+ | 0.23 (0.21, 0.25) | 0.20 (0.18, 0.22) | 0.45 (0.43, 0.48) | 0.11 (0.1, 0.13) |
| Relationship length at usual place | ||||
| 0–4 years | 0.19 (0.17, 0.22) | 0.16 (0.14, 0.18) | 0.54 (0.505, 0.57) | 0.11 (0.09, 0.13) |
| 5–14 years | 0.22 (0.21, 0.23) | 0.17 (0.16, 0.18) | 0.50 (0.479, 0.511) | 0.11 (0.1, 0.12) |
| 15+ years | 0.25 (0.23, 0.27) | 0.18 (0.16, 0.19) | 0.45 (0.43, 0.476) | 0.12 (0.1, 0.14) |
Adjusted for all other variables in the table as well as marital status, health insurance status, and relationship length with usual provider. No significant differences were found for marital status, health insurance status, and relationship length with usual provider.
Discussion
The 4 most prevalent types of patients prefer high levels of information exchange but differ in preferences for discussing and selecting treatment choices. Deliberative autonomists preferred deliberation and decisional control, while non-deliberative autonomists preferred decisional control without deliberation. Deliberative delegators preferred deliberation but preferred their doctor to retain decisional control, and non-deliberative delegators preferred neither deliberation nor control over important decisions. Gender, educational attainment, and self-rated health have traditionally been used to explain variation in preferences, and this study confirms previous findings suggesting that women, more highly educated patients, and those in better health prefer the most active roles in decision making (deliberative autonomists) while men, less educated patients, and those in worse health prefer the least active roles (non-deliberative delegators). However, sociodemographic, health, and physician-patient relationship factors were less useful for explaining variation among the remaining two prevalent patient preference types (non-deliberative autonomists and deliberative delegators).
Our results are consistent with recent literature that suggests patients prefer a high level of information exchange with physicians. Contrary to our expectations, preferences for the two information exchange items did not distinguish among types for the very large majority of respondents. Additionally, a strong preference for discussing treatment options did not necessarily indicate a strong preference for selecting the final option. These results support the broad Charles framework of the decision making process, which characterizes the analytical stages of decision making as information exchange, deliberation, and decision making.(Charles, Gafni, & Whelan, 1999) There is a clear need for strategies to improve information exchange and distinguish preferences for discussing and selecting treatment options, thus it is crucial that physicians have both relationship development and shared decision making skills. It is our hope that this will improve with the recent Institute of Medicine report on improving medical education (2004), which called basic and complex physician-patient communication skills a high priority for inclusion in medical school curricula.
Our study has several limitations. First, it is important to note that these data are not a random sample of the country, which limits the generalizability of our results. In particular, minority groups are not well-represented. However, WLS graduates are generally representative of non-Hispanic white women and men with a high school education, constituting approximately 67% of Americans aged 60 to 64 (U.S. Bureau of the Census, 2000). Second, the lack of variation in respondent age is a potential limitation as age as previously been an important predictor of patient preferences for information (Deber, Kraetschmer, & Irvine, 1996) and participation in decision-making (Arora & McHorney, 2000; Benbassat, Pilpel, & Tidhar, 1998; Degner & Sloan, 1992; Ende, Kazis, Ash et al., 1989; Strull, Lo, & Charles, 1984). Our results will need to be confirmed using other samples of older and younger adults. Future research should also evaluate preference types in more racially and geographically diverse populations. However, the WLS has substantial strength as a longitudinal cohort study. As the baby boom generation approaches older age, the importance of research on older adults increases. In the next 20 years the U.S. population over age 65 is projected to double compared to what it was in 2000 (U.S. Census Bureau, 2004). How this cohort of older adults will affect and be affected by the healthcare delivery system has yet to be fully addressed (Institute of Medicine, 2001). Because the WLS cohort precedes the bulk of the baby boom generation by about a decade, it can provide early indications of trends as this group passes through their 60s and into the age of Medicare eligibility.
Third, we are limited by having only one item per component of the decision-making process (four items total). The addition of more items will be beneficial to extend and validate the findings of this study; however, any implementation of a more individualized approach in the clinical setting needs to be manageable and focus on capturing large rather than subtle differences among individuals. Related to this is the wording of the individual preference items, in particular, the item asking about discussion of treatment options. Our interpretation focused on the latter half of the statement about having many choices. This was informed by cognitive interviews; however, we recognize that respondents could also have focused on the first half of the item about having a doctor make the decision. Fourth, preferences for participation in decision making may not be stable over time. For example, it is known that preferences for treatment may change over the course of treatment (O'Connor, Boyd, Warde, Stolbach, & Till, 1987). It will be important to develop measures of preferences for participation that adequately reflect responsiveness to change over time. Finally, it will be critical to validate preference types with actual behaviors related to healthcare decision making. There is currently a considerable mismatch between the roles patients say they want and the one they feel they actually perform in the context of the healthcare visit (Ford, Schofield, & Hope, 2003).
Patients’ decision making preferences are not being met, and most often they want to be more involved (Ford, Schofield, & Hope, 2003). Our typology expands current knowledge about patient preferences with its identification of four prevalent and distinct types with regard to discussing and selecting treatment choices. This has important implications for how shared decision making should be promoted in healthcare visits. Some have taken the view that physicians should never make decisions for patients (McNutt, 2004). Others have suggested that patients should not be forced to make medical decisions if they prefer not to be involved (Whitney, McGuire, & McCullough, 2004). We support the view that patient-centered care should strive to respond to individual patient’s needs and preferences when possible. However, as our typology shows, only a minority of patients prefer to be involved in neither deliberation nor making important decisions. For the majority of patients then, the challenge lies in allowing them to participate to the extent they desire. As sociodemographic and health factors do a relatively poor job of predicting patient preference type, we suggest direct assessment of patient preferences for all components of the decision making process, perhaps eliciting preferences on intake or patient history forms.
Footnotes
Funding: Kathryn Flynn was funded by training grant T32-HS00083 and by dissertation grant R36-HS015544 from the Agency for Healthcare Research and Quality.
References
- Arora NK, McHorney CA. Patient preferences for medical decision making: who really wants to participate? Med Care. 2000;38(3):335–341. doi: 10.1097/00005650-200003000-00010. [DOI] [PubMed] [Google Scholar]
- Bazzoli GJ, Shortell SM, Dubbs N, Chan C, Kralovec P. A taxonomy of health networks and systems: bringing order out of chaos. Health Serv Res. 1999;33(6):1683–1717. [PMC free article] [PubMed] [Google Scholar]
- Benbassat J, Pilpel D, Tidhar M. Patients' preferences for participation in clinical decision making: a review of published surveys. Ann Behav Med. 1998;24(2):81–88. doi: 10.1080/08964289809596384. [DOI] [PubMed] [Google Scholar]
- Charles C, Gafni A, Whelan T. Decision-making in the physician-patient encounter: revisiting the shared treatment decision-making model. Soc Sci Med. 1999;49(5):651–661. doi: 10.1016/s0277-9536(99)00145-8. [DOI] [PubMed] [Google Scholar]
- Deber RB, Kraetschmer N, Irvine J. What role do patients wish to play in treatment decision making? Arch Intern Med. 1996;156(13):1414–1420. [PubMed] [Google Scholar]
- Degner LF, Sloan JA. Decision making during serious illness: what role do patients really want to play? J Clin Epidemiol. 1992;45(9):941–950. doi: 10.1016/0895-4356(92)90110-9. [DOI] [PubMed] [Google Scholar]
- Dubbs NL, Bazzoli GJ, Shortell SM, Kralovec PD. Reexamining organizational configurations: an update, validation, and expansion of the taxonomy of health networks and systems. Health Serv Res. 2004;39(1):207–220. doi: 10.1111/j.1475-6773.2004.00222.x. [DOI] [PMC free article] [PubMed] [Google Scholar]
- Duke University Center for the Study of Aging and Human Development. Multidimensional functional assessment: the OARS methodology. Durham, NC: Duke University; 1978. [Google Scholar]
- Emanuel EJ, Emanuel LL. Four models of the physician-patient relationship. Jama. 1992;267(16):2221–2226. [PubMed] [Google Scholar]
- Ende J, Kazis L, Ash A, Moskowitz MA. Measuring patients' desire for autonomy: decision making and information-seeking preferences among medical patients. J Gen Intern Med. 1989;4(1):23–30. doi: 10.1007/BF02596485. [DOI] [PubMed] [Google Scholar]
- Falkum E, Forde R. Paternalism, patient autonomy, and moral deliberation in the physician-patient relationship. Attitudes among Norwegian physicians. Soc Sci Med. 2001;52(2):239–248. doi: 10.1016/s0277-9536(00)00224-0. [DOI] [PubMed] [Google Scholar]
- Ford S, Schofield T, Hope T. Are patients' decision-making preferences being met? Health Expect. 2003;6(1):72–80. doi: 10.1046/j.1369-6513.2003.00211.x. [DOI] [PMC free article] [PubMed] [Google Scholar]
- Gerteis M, Edgman-Levitan S, Walker JD, Stoke DM, Cleary PD, Delbanco TL. What patients really want. Health Manage Q. 1993;15(3):2–6. [PubMed] [Google Scholar]
- Gordon AD. Classification. Boca Raton, FL: Chapman & Hall/CRC; 1999. [Google Scholar]
- Gotler RS, Flocke SA, Goodwin MA, Zyzanski SJ, Murray TH, Stange KC. Facilitating participatory decision-making: what happens in real-world community practice? Med Care. 2000;38(12):1200–1209. doi: 10.1097/00005650-200012000-00007. [DOI] [PubMed] [Google Scholar]
- Institute of Medicine. Crossing the Quality Chasm: A New Health System for the 21st Century. Washington, D.C.: National Academy Press; 2001. [PubMed] [Google Scholar]
- Institute of Medicine. Improving Medical Education: Enhancing the Behavioral and Social Science Content of Medical School Curricula. Washington, D.C.: National Academies Press; 2004. [PubMed] [Google Scholar]
- Kaplan SH, Gandek B, Greenfield S, Rogers W, Ware JE. Patient and visit characteristics related to physicians' participatory decision-making style. Results from the Medical Outcomes Study. Med Care. 1995;33(12):1176–1187. doi: 10.1097/00005650-199512000-00002. [DOI] [PubMed] [Google Scholar]
- Katz J. The Silent World of Doctor and Patient. New York: Free Press; 1984. [Google Scholar]
- Kaufman L, Rousseeuw PJ. Finding Groups in Data. New York: Wiley; 1990. [Google Scholar]
- Krantz DS, Baum A, Wideman M. Assessment of preferences for self-treatment and information in health care. J Pers Soc Psychol. 1980;39(5):977–990. doi: 10.1037//0022-3514.39.5.977. [DOI] [PubMed] [Google Scholar]
- McNutt RA. Shared medical decision making: problems, process, progress. Jama. 2004;292(20):2516–2518. doi: 10.1001/jama.292.20.2516. [DOI] [PubMed] [Google Scholar]
- Nease RF, Jr, Brooks WB. Patient desire for information and decision making in health care decisions: the Autonomy Preference Index and the Health Opinion Survey. J Gen Intern Med. 1995;10(11):593–600. doi: 10.1007/BF02602742. [DOI] [PubMed] [Google Scholar]
- O'Connor AM, Boyd NF, Warde P, Stolbach L, Till JE. Eliciting preferences for alternative drug therapies in oncology: influence of treatment outcome description, elicitation technique and treatment experience on preferences. J Chronic Dis. 1987;40(8):811–818. doi: 10.1016/0021-9681(87)90133-0. [DOI] [PubMed] [Google Scholar]
- Ong LM, de Haes JC, Hoos AM, Lammes FB. Doctor-patient communication: a review of the literature. Soc Sci Med. 1995;40(7):903–918. doi: 10.1016/0277-9536(94)00155-m. [DOI] [PubMed] [Google Scholar]
- Quill TE, Brody H. Physician recommendations and patient autonomy: finding a balance between physician power and patient choice. Ann Intern Med. 1996;125(9):763–769. doi: 10.7326/0003-4819-125-9-199611010-00010. [DOI] [PubMed] [Google Scholar]
- Robinson A, Thomson R. Variability in patient preferences for participating in medical decision making: implication for the use of decision support tools. Qual Health Care. 2001;10(Suppl 1):i34–38. doi: 10.1136/qhc.0100034... [DOI] [PMC free article] [PubMed] [Google Scholar]
- SAS Institute. SAS Statistical Software. Cary, NC: SAS Institute; 2002. [Google Scholar]
- Schonlau M. The clustergram: a graph for visualizing hierarchical and non-hierarchical cluster analyses. The Stata Journal. 2002;3:316–327. [Google Scholar]
- StataCorp. Stata Statistical Software. College Station, TX: Stata Corporation; 2003. [Google Scholar]
- Stevenson FA, Barry CA, Britten N, Barber N, Bradley CP. Doctor-patient communication about drugs: the evidence for shared decision making. Soc Sci Med. 2000;50(6):829–840. doi: 10.1016/s0277-9536(99)00376-7. [DOI] [PubMed] [Google Scholar]
- Strull WM, Lo B, Charles G. Do patients want to participate in medical decision making? Jama. 1984;252(21):2990–2994. [PubMed] [Google Scholar]
- Thompson SC, Pitts JS, Schwankovsky L. Preferences for involvement in medical decision-making: situational and demographic influences. Patient Educ Couns. 1993;22(3):133–140. doi: 10.1016/0738-3991(93)90093-c. [DOI] [PubMed] [Google Scholar]
- Thomson ISI. Web of Knowledge. 2003. [Google Scholar]
- U.S. Bureau of the Census. Current Population Reports. Washington, D.C: Government Printing Office; 2000. Educational Attainment in the United States: March 2000. [Google Scholar]
- U.S. Census Bureau. U.S. Interim Projections by Age, Sex, Race, and Hispanic Origin. 2004. [Google Scholar]
- Weesie J. Seemingly unrelated estimation and the cluster-adjusted sandwich estimator. Stata Technical Bulletin. 1999;52:34–47. [Google Scholar]
- Whitney SN, McGuire AL, McCullough LB. A typology of shared decision making, informed consent, and simple consent. Ann Intern Med. 2004;140(1):54–59. doi: 10.7326/0003-4819-140-1-200401060-00012. [DOI] [PubMed] [Google Scholar]
- Xu J, Long JS. Using the delta method to construct confidence intervals for predicted probabilities, rates, and discrete changes. 2005 http://www.indiana.edu/~jslsoc/stata/spostci/documentation/prvalue2-delta.pdf.