Abstract
Ultrafast electron microscopy and diffraction are powerful techniques for the study of the time-resolved structures of molecules, materials, and biological systems. Central to these approaches is the use of ultrafast coherent electron packets. The electron pulses typically have an energy of 30 keV for diffraction and 100–200 keV for microscopy, corresponding to speeds of 33–70% of the speed of light. Although the spatial resolution can reach the atomic scale, the temporal resolution is limited by the pulse width and by the difference in group velocities of electrons and the light used to initiate the dynamical change. In this contribution, we introduce the concept of tilted optical pulses into diffraction and imaging techniques and demonstrate the methodology experimentally. These advances allow us to reach limits of time resolution down to regimes of a few femtoseconds and, possibly, attoseconds. With tilted pulses, every part of the sample is excited at precisely the same time as when the electrons arrive at the specimen. Here, this approach is demonstrated for the most unfavorable case of ultrafast crystallography. We also present a method for measuring the duration of electron packets by autocorrelating electron pulses in free space and without streaking, and we discuss the potential of tilting the electron pulses themselves for applications in domains involving nuclear and electron motions.
Keywords: ultrafast imaging, femtosecond electron pulses, electron autocorrelation
In recent years it has become possible to reveal structures and dynamics with combined atomic-scale spatial and temporal resolutions in the gas phase, on surfaces and in crystals, and for biological systems, by using 4D ultrafast electron diffraction, crystallography, and microscopy (ref. 1 and references therein). The spatial resolution in ultrafast electron diffraction is atomic with milliangstrom accuracy, and the temporal resolution is up to subpicosecond at low electron fluxes (ref. 2 and references therein; see also refs. 3 and 4), well suited to resolve ultrafast dynamics. The temporal limit is determined by the extent of energy spread and space charge effects (ref. 5 and references therein). Recently, by developing microscopy and diffraction with single-electron packets (6), space charge effects and their associated pulse broadening mechanisms were fully removed, reaching the femtosecond regime for imaging with electrons. For reversible processes, an ultrafast dynamics can be measured with pulse trains at high repetition rates. However, for irreversible changes, a single pulse must have such a large number of electrons that the temporal broadening has to be considered at the point of in situ imaging.
Besides the pulse duration, there is another temporal spread that imposes an often more severe limitation on time resolution. When performing experiments with pulses of different speed, such as the case here for electrons and photons (used to initiate the change), one has to consider the different group velocities involved. For electrons accelerated at 30–200 keV, this difference results in a large smearing of the time resolution during propagation in the sample (dispersion of time zero). This mismatch becomes even more significant when a collinear arrangement is not possible, such as in ultrafast electron crystallography (UEC), during which the electrons interrogate the sample at near grazing incidence and the initiating pulse is nearly perpendicular to the surface. In a previous report (7), this problem was considered for ultrafast electron diffraction, and conditions were established for minimizing the velocity mismatch, basically by reducing the sample size and/or the initiating laser beam diameter and by changing the angle between the two beams. The optimum spread was found to be subpicosecond, but no solution was offered to reduce it beyond this limit; other geometries, such as UEC, were not considered.
In this work, we show how to overcome the effect of group velocity mismatch (GVM) between electrons and light by tilting the optical pulses such that both the electron and the initiating pulses precisely coincide at every point in the sample and throughout the propagation time. This method can be generally applied to ultrafast electron diffraction, UEC, and ultrafast electron microscopy, for gas phase, condensed phase, and biological specimens. Here, we present results of UEC-type experiments, the worst of all cases. Although the necessary pulse front tilt turns out to be as large as 72°, it was possible to achieve this tilting with ease, and the results show a >25-fold reduction in time spread. We also report the results of electron-pulse autocorrelation measurements and discuss tilting the electron packets to overcome space charge problems that are especially important in single-shot experiments. A method for obtaining the shortest pulse duration also is described.
Results and Discussion
Tilting for Diffraction and Imaging.
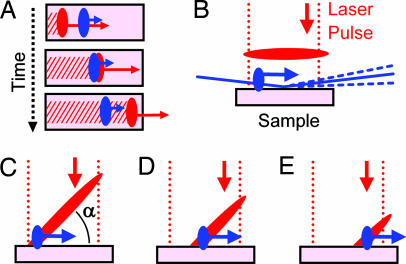
We first consider the general case of collinear propagation and then specifically address the case of UEC. Fig. 1A depicts three points in time during a collinear propagation of electron and light pulses through a sample. While propagating, the light pulse imprints an excited region in the sample (Fig. 1A, hatched regions). Because the initiating light pulse is faster than the probing electron pulse, one overtakes the other during propagation. Even for perfectly synchronized pulses, as is the case here, the consequence is that the electrons are diffracted from regions of no excitation, excitation, and after excitation.
Fig. 1.
Tilted pulse geometry. (A) Concept of GVM. The difference in speed of electron (blue) and laser (red) pulses leads to a spread (dispersion) of time zero throughout the sample and spoils the time resolution. (B) Basic methodology of UEC. Electron pulses (blue) are diffracted from the sample surface after excitation with a laser pulse (red). Different group velocities and the geometry lead to a large timing mismatch on the sample surface. (C–E%) The velocity mismatch between the rather slow electron pulses (33% c for UEC) and the fast laser excitation can be overcome by tilting the optical pulses. Depicted are the early (C), intermediate (D), and late (E) time during electron and laser propagation.
The case of UEC is shown schematically in Fig. 1B, with emphasis on the interaction region. The sample surface is probed by diffracting a beam of 30-keV electron pulses with a small angle of incidence, and the pattern is recorded in the far field. For time-resolved measurements, a femtosecond laser pulse impulsively excites the surface. For 90° incidence, the entire sample is excited at once, and the electron pulse is diffracted at different positions, at different times. The GVM is determined by the electron speed of 0.33 c, which yields a dispersion of 10 ps for a millimeter of sample sweep; for 200 keV, the dispersion is 4.8 ps/mm. Note that for angles <90°, this value changes minimally, and even for a collinear arrangement the dispersion would still be 7 ps/mm at 30 keV.
Fig. 1 C–E% depicts an outline of the concept involved in using tilted optical pulses to overcome the GVM problem. With a perpendicular incidence of the initiating laser pulse, but now tilted at an angle α between the propagation direction and the intensity front, the speed of the laser excitation impinging on the surface can be matched to the relatively slow electrons propagating along the surface. At the early time point (Fig. 1C), mid-point (Fig. 1D), and later time point (Fig. 1E), both the laser and electron pulses are in coincidence at all times.
The optical pulses must have an angle between the propagation direction and the plane of highest intensity. Basically, the optical pulses can be viewed as tilted discs propagating in a given direction. Such pulses still have their phase front perpendicular to the propagation direction, but the point of constructive interference between different spectral components is distributed over the spatial beam profile so that constructive interference occurs earlier on one side and later on the other. Tilted pulses have an angular dispersion, and different colors propagate in different directions (8, 9). In ultrafast optics, these pulses have been used for single-shot autocorrelation measurements (10), parametric amplification (11), generation of terahertz radiation (12), and the improvement of velocity mismatch in fluorescence up-conversion (13). Here, tilted pulses are introduced for diffraction and imaging.
For the arrangement indicated by Fig. 1C, the necessary pulse front tilt α is determined by the incidence angle γ between the laser and sample, the speed vel of electrons, and by the small sample tilt β. From geometrical considerations, we obtain the expression
Similar expressions can be derived for other arrangements. For γ = 90° and α = 0.33 c, a pulse front tilt of α = 72° is obtained. Although this tilt is large, we can experimentally achieve it, as shown below. Small angles of β at <5° change the tilt value only by <0.5°. A single tilt angle is therefore sufficient for recording data at different sample angles, allowing for a broad range of experiments involving rocking curves.
A pulse front tilt α is associated with an angular dispersion ε(λ) which results from any diffractive element (9):
Because of the large magnitude of the required pulse front tilt, we choose a grating as a diffractive element. The angular dispersion ε(λ) is calculated from the groove spacing d and the incidence angle Θgr:
For λ0 = 800 nm and for a grating of 1,800 grooves per millimeter, we obtain Θgr = 34°, which is the condition for the desired tilt matching at α = 72°. In this arrangement, the grating is not near Littrow configuration (Θgr = 46°); however, we find it more convenient in the experimental arrangement to have a net deflection despite the somewhat reduced efficiency. A variation of the angle of incidence Θgr leads to a comparable effect in the tilt and can therefore easily be used as an adjustable parameter to fine-tune the velocity matching.
Because femtosecond pulses have large spectral widths, the angular dispersion necessary for the tilt causes different wavelengths within the optical spectrum to propagate in different directions. For the calculated geometry, the spectrum is already dispersed by more than the beam diameter after a few centimeters of propagation from the grating. Therefore, in our optical arrangement, the image at the grating is replicated at the sample by using a spherical mirror such that all wavelengths coincide at the same spot on the sample.
Experimental Realization.
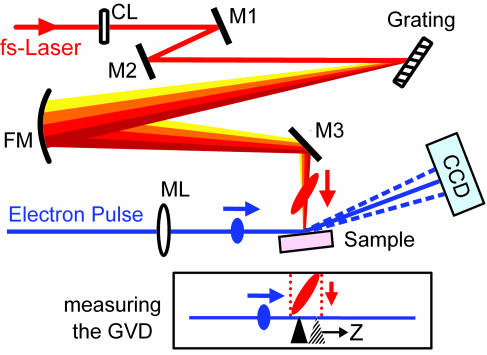
The essential parts of the experimental setup are shown in Fig. 2. The tilt optics was integrated into our existing UEC apparatus, which is described elsewhere (14). Ultrashort electron pulses of 30 keV were generated by using photo-activated cathodes, and the third harmonic of an amplified titanium–sapphire femtosecond laser. After passing a pinhole and a magnetic lens system, the electrons propagate toward the sample as a collimated beam with a diameter of ≈300 μm. For the number of electrons generated, the electron pulse width is ≈1–2 ps, measured by the in situ streaking technique (ref. 5 and references therein). The sample is typically mounted on a goniometer and aligned for an electron beam incidence of a few degrees. For this geometry, the footprint of the electron beam on the sample surface is elliptical and is of some mm length. The electron pulses were diffracted, and the 2D pattern was recorded with a camera capable of single-electron detection.
Fig. 2.
Experimental arrangement (relevant part only) for tilted pulse excitation and footprint match. (Upper) The optical pulses (red) are focused by a cylindrical lens (CL) and fall on a grating. The tilted optical pulses are generated and imaged on the sample with a spherical mirror (FM); M1–M3, steering mirrors 1–3; ML, magnetic lens system. The rainbow colors depict different wavelengths within the 800-nm laser spectrum. (Lower) For measuring the effect of the pulse front tilt, a needle (black) is used for ionizing and the resulting electron pulse profile is changed (see text). A time scan yields time zero for that particular needle position, which is then varied along the electron propagation direction (Z).
The 100-fs, 800-nm excitation beam was focused by a cylindrical lens, and two steering mirrors were used to define the angle of incidence according to the calculated angle on the grating (1,800 grooves per millimeter; damage threshold > 250 mJ/cm2; Horiba Jobin-Yvon, Edison, NJ). A properly tilted but spectrally dispersed beam is then generated. The grating surface is imaged onto the sample surface with a focusing mirror (f = 300 mm). We chose an incidence of γ = 90° for the laser beam to easily adjust the polarization and to facilitate the alignment. With the imaging condition established, one can then adjust the spot size of the excitation laser on the sample by observing and controlling the spot size on the grating surface outside the ultrahigh vacuum chamber of the apparatus. To match the laser excitation to the elliptical footprint of the electron beam, the cylindrical lens was made to generate an elliptical spot of ≈4 × 0.5 mm on the grating surface and similarly on the sample. Thus, the two involved beams of electrons and light are matched for optimal overlap.
To confirm and measure the effect of the tilted excitation, we determined time zero between the electron pulse and the laser excitation for different spatial positions in the interaction region. Fig. 2 Lower shows the methodology used to measure a spatially defined time zero. We used multiphoton ionization from a needle that is placed at a position Z in the probed region of the sample surface. When the needle was subjected to the intense femtosecond laser pulse with ≈50 mJ/cm2 fluence, photoelectrons were generated to form a transient and localized plasma, which then changed the electron pulse's spatial profile in what we have termed the plasma lensing effect (15); this process has been introduced for measuring time zero within ≈1 ps (15, 16). For each time step, we recorded images and averaged for a total time of typically 1 min during multiple scans. The absolute difference of each image with respect to a reference image without excitation was integrated for each delay time.
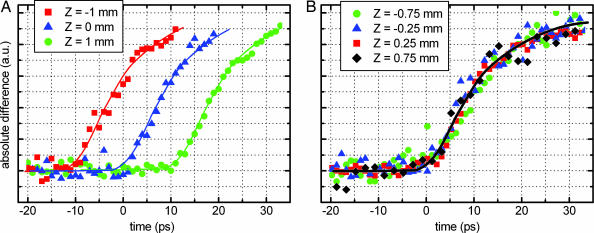
We first measured the spatial variation of time zero for a nontilted excitation pulse. Fig. 3A depicts the results: for different Z positions along the interaction region, very similar but temporally shifted traces were obtained. This behavior clearly shows that time zero shifts (spreads) by the expected dispersion of 10 ps/mm because of the effect of velocity mismatch between the electron and laser pulses. We then applied the prescribed tilted pulse excitation scheme with the optical parameters set as calculated. The resulting time traces for different positions are shown in Fig. 3B. Independent of the needle position, all traces coincide, showing that time zero is the same regardless of where in space the interaction region is probed.
Fig. 3.
Experimental results for measurements of time zero for the nontilted and tilted geometry. (A) Without tilted pulses, the traces are all similar but shifted in time when moving the point of measurement in space. (B) With tilted pulses, all traces coincide regardless of the position Z.
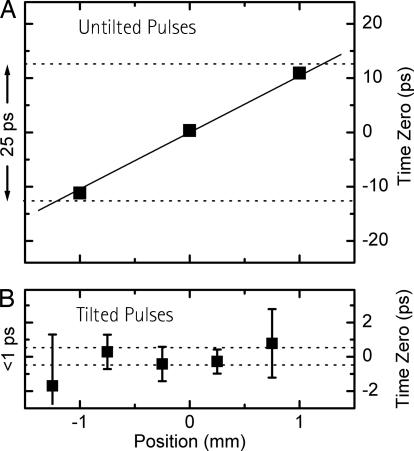
For more accurate analysis, we evaluated time zero from all transients by linearly fitting the initial slope and determining the crossing with the base line. The results are plotted in Fig. 4A for the nontilted excitation; one can clearly see the expected 10 ps/mm dispersion. For a 2-mm-long sample surface, the measured GVM, therefore, indicates that the time resolution of diffraction experiments will be 25 ps, convoluted with the electron pulse duration. The same measurement after properly tilting the optical pulses is shown in Fig. 4B. In contrast to the untilted geometry, over a range of nearly 2 mm, no significant variation in time zero was observed within the measurement accuracy. We note that the error bars are the result of the uncertainty in the characterization of time zero (≈1 ps) by the ionization method (Fig. 3B) and not from our tilting scheme. Over the full spatial range, we observed better than 1 ps control of the resolution (see Fig. 4B), and we expect that tilting easily provides femtosecond resolution when the uncertainty in time zero measurements is further reduced. The experimental approach reported here removes one major hurdle in electron optics, that of velocity mismatch.
Fig. 4.
Change of time zero with spatial position. (A) Without tilted pulses, time zero (■) changes by the dispersion of 10 ps/mm, reducing the overall time resolution by the range indicated (25 ps for a 2-mm sample). The solid line is a fit including data points outside the displayed range. (B) With tilted pulses, time zero does not change significantly across the 2-mm range. The difference between A and B in position range is due to the footprint used. The dotted lines give a better than 1-ps velocity match, and <50 fs is the limit (see text).
The effectiveness of tilted pulse excitation is limited by higher-order pulse front tilt, or pulse front curvature. Because the tilt is associated with the angular dispersion, any higher-order angular dispersion will also generate higher-order tilt, corresponding to a varying speed of the excitation point along the sample surface. Electron velocity does not change during propagation, which leads to a higher-order mismatch between electron and laser coincidence. From Eqs. 2 and 3, we calculated that, over the spectral width of a 100-fs pulse, the pulse front curvature leads to a mismatch of <50 fs. We are aware that this higher-order mismatch will become worse for shorter and more broadband pulses; however, the effect can be overcome by choosing or combining dispersive elements to yield less second-order dispersion. Another consideration of similar magnitude is the few-degree tilt of the sample, which will lead to a higher or lower necessary pulse front tilt, depending on the sample tilt. As mentioned before (see Eq. 1), this effect is not severe and if needed can be corrected for by tracking the rotation of the grating with that of the sample (rocking curve).
Besides the highly improved time resolution, the reported method also offers the advantage of a better match between the excited and the probed (elliptical) regions on the sample surface. We expect more sensitivity in UEC experiments because of the absence of contributions from spatial regions that are not initially excited. We note that, in previous UEC experiments from this laboratory, we reduced the GVM by using smaller footprinting or excitation of a wedged sample to obtain good time resolution (ref. 1 and references therein).
The Technique of Electron Autocorrelation.
Having achieved the time resolution as described above, we needed to develop a method for characterizing the electron packet. For light pulses, the determination of their duration without an external reference is a textbook case. The most basic and widespread method is an autocorrelation measurement. Here, we introduce and demonstrate ultrafast electron-pulse autocorrelation. The methodology makes use of the fact that, because electrons repel each other, the vacuum is nonlinear and/or dispersive for multielectron pulses. The spatial and temporal propagation dynamics of an electron pulse in free space therefore depends on electron density, similar to nonlinear optics in a medium where the interaction depends on intensity.
The electron autocorrelation approach is our method of choice because of its ease and the time resolution it offers. This approach is to be contrasted with streaking the electron pulses with a rapidly varying electric field, which is technically more demanding and has a resolution in the range of hundreds of femtoseconds under realistic circumstances. A proposal was made for cross-correlating the electron pulse with an intense (millijoule) laser pulse by using ponderomotive scattering to obtain the pulse width (17). A self-referencing characterization without external probes, such as intense laser pulses or streaking fields, is introduced here.
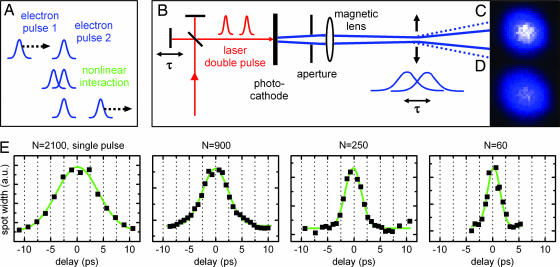
We generated an identical pair of electron pulses and made them overlap in free space. Fig. 5 A and B depicts the conceptual idea and the experimental arrangement, respectively. The photocathode was activated with two femtosecond laser pulses in sequence separated by an adjustable delay τ using a Michelson interferometer. At the photocathode and during initial steps of propagation toward the acceleration mesh, these pulses develop to have a duration on the order of picoseconds. In the autocorrelation measurements, because the electron density is relatively low, no significant temporal broadening is expected during propagation toward the sample and CCD detection (ref. 5 and references therein).
Fig. 5.
Electron pulse autocorrelation. (A) Concept of an autocorrelation measurement with electron pulses exploiting the nonlinearity in free space. (B) Experimental arrangement. A laser double-pulse generates two identical electron pulses with a delay. A magnetic lens system focuses the electron pulses toward a narrow spatial waist, where Coulomb repulsion leads to a spatial beam broadening that depends on delay time. (C and D) Beam profiles are shown without (C) and with (D) temporal overlap between the two electron pulses. (E) The traces show the measured spatial beam diameter versus the delay between the electron pulses for various numbers of electrons. The green traces are fits to Gaussian functions. Note the decrease in width with the decrease in the number N of electrons; here, N is relative (see text).
A magnetic lens system is used to focus the electrons down at the position where the sample is normally located. In the narrow waist of that ≈100-μm focus, the pulses exhibit a spatial broadening due to Coulomb repulsion that depends on their mutual overlap. The spatial beam diameter is then recorded on a screen as a function of the delay τ. Fig. 5C and D shows typical beam profiles when the two electron pulses (Fig. 5A) were separated in time or temporally overlapped. A decrease in peak intensity together with an increase in width can clearly be observed. For each delay time, the image was integrated along one dimension, and the profile was fitted to a Gaussian function. The width of the beam is then plotted for varying τ. The data point at τ = 0 is missing because optical interference spoils the electron pulse generation; however, this could easily be circumvented with a quarter-wave plate in one of the interferometer arms to provide the needed crossed polarizations. Fig. 5E shows typical autocorrelation traces obtained for various numbers of electrons per pulse; the values are relative and given for single pulses at detection. The width of the traces decreases significantly with decreasing electron number, indicating that the electron pulse width is being measured by the electron autocorrelation method. The autocorrelation traces can be fitted well with Gaussian functions. The resultant widths scale linearly with the number of electrons of the pulse, as expected and well known from earlier streaking measurements (2, 5).
An examination of the appropriate deconvolution formalism is necessary to achieve quantitative comparison with streaking results. Although we limit the interaction region to a short propagation length at the intermediate focus, the accurate dependence of the spatial Coulomb spreading on the temporal overlap of the two electron pulses requires some modeling. Because of the striking linear dependence of the autocorrelation widths on electron density, in agreement with earlier streaking experiments, a deconvolution factor should express a simple relationship depending on pulse shape, similar to optical autocorrelations. The use of two spatially separated electron pulses that are later brought to a spatial overlap with an angle could limit the interaction region. Besides its value for measuring the pulse width, an electron autocorrelation provides an easy way to investigate and optimize parameters of pulse generation and diffraction experiments in the femtosecond regime. Even for as few as 60 electrons in the pulse there is a measurable dependence (≈2%) of the beam width on temporal overlap (see Fig. 5E).
Further Improvements: Single-Shot and Single-Electron Packets
The success in removing the hurdle of GVM by introducing tilted optical pulses and characterizing the packets by electron autocorrelation provides new opportunities for 4D imaging and diffraction studies. In this section, we consider tilting electron packets to reach subpicosecond pulse duration in a single-shot recording and a ponderomotive deflection scheme to achieve few-femtosecond pulses for single-electron diffraction and imaging.
As mentioned above, single-electron packets are space-charge free. In contrast, a single shot with a large number of electrons experiences major space-charge effects due to Coulomb repulsion, which results in temporal and energy spread during propagation. To compensate for this effect, a proposal was made to recompress the pulses after broadening by space-charge repulsion (18). Here, we present an approach that is based on tilting the electron packets themselves to allow for self-compression of the pulse. Initially, a long pulse is produced with a relatively low electron density (per unit time) but with a high total number of electrons, thereby avoiding space-charge effects at the generation and acceleration process and during the early stages of propagation. To obtain an ultrashort pulse with a high electron density at the point of experimental interaction, the initial long pulse is controlled such that the leading electrons are slower and the trailing ones are faster than the central speed. Such a pulse is chirped, by which we mean that there is a correlation between the velocities of the temporal segments of the pulse, which is to be contrasted with a random distribution of speeds. After some propagation time, such a pulse will then self-compress and reach a large electron density at the interaction region while simultaneously developing an ultrashort duration.
To estimate the required velocity distribution for self-compression, we consider an initially long pulse of duration Δt with the central energy being E (speed v) and an initial energy width ΔE. The propagation length L needed for self-compression is
 |
For a 30-keV pulse with an initial length of 50 ps, self-compression will occur after 50 cm of propagation length, for an initial ΔE = 600 eV. This energy distribution is achievable by the design depicted in Fig. 6. A tilted laser pulse is used to activate a photocathode with a slit-type geometry to generate a spatially tilted electron packet. An acceleration mesh with a static voltage gradient makes the trailing electrons slightly faster and the leading ones slightly slower. The tilted electron packet is then recombined spatially by electron optics. In this scheme, the degree and magnitude of the initial chirp, and thereby the self-compression, can be controlled by the optical tilt and by the electrostatic voltage gradient. We estimate that 100 times more electrons can be confined within a subpicosecond pulse when compared with conventional electron sources. Although for simplicity Eq. 4 does not include space charge contributions, such effects can be compensated for by an adjustment in the tilt angle and geometry.
Fig. 6.
Generation of self-compressed femtosecond electron pulses. The concept involves the use of tilted laser pulses to trigger a slit-type photo-activation, generating electrons at different times. An acceleration element with a linear voltage gradient, together with suitable electron optics, then generates an electron pulse with the slow electrons leading the fast ones. The pulse self-compresses in free space to an unprecedented electron density.
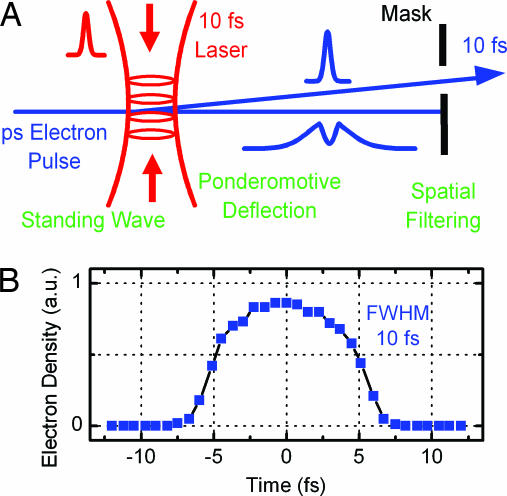
At the opposite end, single-electron pulses can reach the femtosecond and, possibly, attosecond regime. The energy spread and spatial distribution, however, could result in a jitter of single-electron trajectories, thus impeding the transition to few or subfemtosecond resolution. For this reason, we invoke the use of picosecond electron pulses and intersect them by optical few-femtosecond pulses, filtering out the corresponding few-femtosecond electron pulses by the ponderomotive force. Although electrons are not directly deflected by optical field oscillations, the ponderomotive force [proportional to the intensity gradient (19)] of state-of-the-art few-femtosecond sources is strong enough to efficiently repel electrons out of the region of highest intensity. For a high deflection efficiency, two femtosecond pulses are used in a colliding geometry, generating for a short time a standing wave that exhibits a strongly deflecting ponderomotive force at all of the wave slopes. The conceptual idea is depicted in Fig. 7A.
Fig. 7.
Few-femtosecond electron pulses generated by ponderomotive deflection. (A) Electrons are deflected by the ponderomotive force of a laser lasting a few femtoseconds in a standing-wave geometry. (B) Simulations obtained by integrating the equation of motion of electrons in the ponderomotive force showing that 10-fs electron pulses are possible.
The ponderomotive potential and force are given by
and
where I is the laser intensity and λ0 is the wavelength. To estimate the deflection angle, we consider an electron with velocity vel passing through a laser focus with a diameter d at the slope of a standing wave fringe. The electron is within the focus for Δt ≈ d/vel. At the fringe slope, the ponderomotive force is FP ≈ UP/(λ/2), and the electron gains a momentum of p⊥ = FpΔt. For a 10-fs laser at λ0=800 nm with a pulse energy of 10 μJ focused to d = 10 μm, the ponderomotive potential UP is ≈75 eV and a nonrelativistic treatment is appropriate. From E⊥ = (p⊥2/2me), we obtain
For electron energy of 30 keV, the transversal energy E⊥ is ≈30 eV, corresponding to vel ≈ 0.33 c and v⊥ ≈ 0.01 c, which gives a 2° deflection. Numerical classical electron dynamics simulations with a realistic beam of electrons show that the deflected pulses can have a duration of <10 fs while being perfectly synchronized with the laser (see Fig. 7B).
Attosecond extreme UV pulses have now been generated, providing exciting opportunities in electron dynamics (20–23). Optical pulses are essentially limited by the relatively long wavelength of an optical cycle, but the wavelength of an electron pulse is much shorter and can be scaled by increasing the energy. For comparison, the duration of optical pulses (visible and UV) is limited to a few femtoseconds, and even pulses generated from higher harmonics are already limited to ≈100 as by the optical oscillation period. In contrast, electron pulses with an energy of 100 keV could in principle have pulse durations as short as 0.1 as. This regime of the electron packet width, together with the very large cross-section for electron interaction with matter, makes electrons a highly promising tool for breaking into unknown domains of time and spatial resolution.
The experimental results and concepts presented here demonstrate the new limits reached experimentally and the further improvements that can be reached in the use of ultrashort single-electron and single-shot electron packets in diffraction and microscopy.
Acknowledgments
We thank Profs. Jeff Kimble and Ferenc Krausz for their careful reading of the manuscript and valuable suggestions and Nuh Gedik and Songye Chen for experimental help with UEC in the initial stage. This work was supported by the Gordon and Betty Moore Foundation and the National Science Foundation. P.B. was supported by the Alexander von Humboldt Foundation.
Abbreviations
- UEC
ultrafast electron crystallography
- GVM
group velocity mismatch.
Note Added in Proof.
Recently we applied the approach of tilted optical pulses to record ultrafast diffraction patterns of nanoscale materials. The results indeed show that the tilting scheme for the UEC experimental geometry allows for the observation of materials response with a footprint of 3 mm but without any loss of temporal resolution.
Footnotes
The authors declare no conflict of interest.
References
- 1.Zewail AH. Annu Rev Phys Chem. 2006;57:65–103. doi: 10.1146/annurev.physchem.57.032905.104748. [DOI] [PubMed] [Google Scholar]
- 2.Lobastov VA, Srinivasan R, Vigliotti F, Ruan C-Y, Feenstra JS, Chen S, Park ST, Xu S, Zewail AH. Springer Series in Optical Sciences. In: Krausz F, Korn G, Corkum P, Walmsley IA, editors. Ultrafast Optics IV. Vol 95. New York: Springer; 2004. pp. 419–425. [Google Scholar]
- 3.Cao J, Hao Z, Park H, Tao C, Kau D, Blaszczyk L. Appl Phys Lett. 2003;83:1044–1046. [Google Scholar]
- 4.Siwick BJ, Dwyer JR, Jordan RE, Miller RJD. Science. 2003;302:1382–1385. doi: 10.1126/science.1090052. [DOI] [PubMed] [Google Scholar]
- 5.Srinivasan R, Lobastov VA, Ruan CY, Zewail AH. Helv Chim Acta. 2003;86:1763–1799. [Google Scholar]
- 6.Lobastov VA, Srinivasan R, Zewail AH. Proc Natl Acad Sci USA. 2005;102:7069–7073. doi: 10.1073/pnas.0502607102. [DOI] [PMC free article] [PubMed] [Google Scholar]
- 7.Williamson JC, Zewail AH. Chem Phys Lett. 1993;209:10–16. [Google Scholar]
- 8.Bor Z, Rácz B. Opt Commun. 1985;54:165–170. [Google Scholar]
- 9.Hebling J. Opt Quantum Electron. 1996;28:1759–1763. [Google Scholar]
- 10.Collier J, Danson C, Johnson C, Mistry C. Rev Sci Instrum. 1999;70:1599–1602. [Google Scholar]
- 11.Shirakawa A, Sakane I, Kobayashi T. Opt Lett. 1998;23:1292–1294. doi: 10.1364/ol.23.001292. [DOI] [PubMed] [Google Scholar]
- 12.Stepanov AG, Kuhl J, Kozma IZ, Riedle E, Almási G, Hebling J. Opt Express. 2005;13:5762–5768. doi: 10.1364/opex.13.005762. [DOI] [PubMed] [Google Scholar]
- 13.Zhao L, Lustres JLP, Farztdinov V, Ernsting NP. Phys Chem Chem Phys. 2006;7:1716–1725. doi: 10.1039/b500108k. [DOI] [PubMed] [Google Scholar]
- 14.Ruan CY, Vigliotti F, Lobastov VA, Chen S, Zewail AH. Proc Natl Acad Sci USA. 2004;101:1123–1128. doi: 10.1073/pnas.0307302101. [DOI] [PMC free article] [PubMed] [Google Scholar]
- 15.Dantus M, Kim SB, Williamson JC, Zewail AH. J Phys Chem. 1994;98:2782–2796. [Google Scholar]
- 16.Park H, Hao Z, Wang X, Nie S, Clinite R, Cao J. Rev Sci Instrum. 2005;76:083905. doi: 10.1063/1.3062863. [DOI] [PubMed] [Google Scholar]
- 17.Siwick BJ, Green AA, Hebeisen CT, Miller RJD. Opt Lett. 2005;30:1057–1059. doi: 10.1364/ol.30.001057. [DOI] [PubMed] [Google Scholar]
- 18.Qian BL, Elsayed-Ali HE. Phys Rev E. 2002;65:046502. doi: 10.1103/PhysRevE.65.046502. [DOI] [PubMed] [Google Scholar]
- 19.Kibble TWB. Phys Rev. 1966;150:1060–1069. [Google Scholar]
- 20.Drescher M, Krausz F. J Phys B. 2005;38:S727–740. [Google Scholar]
- 21.Hentschel M, Kienberger R, Spielmann C, Reider GA, Milosevic N, Brabec T, Corkum P, Heinzmann U, Drescher M, Krausz F. Nature. 2001;414:509–513. doi: 10.1038/35107000. [DOI] [PubMed] [Google Scholar]
- 22.Niikura H, Hasbani LFR, Bandrauk AD, Ivanov MY, Villeneuve DM, Corkum PB. Nature. 2001;417:917–922. doi: 10.1038/nature00787. [DOI] [PubMed] [Google Scholar]
- 23.Drescher M, Hentschel M, Kienberger R, Uiberacker M, Yakovlev V, Scrinzi A, Westerwalbesloh T, Kleineberg U, Heinzmann U, Krausz F. Nature. 2002;419:803–807. doi: 10.1038/nature01143. [DOI] [PubMed] [Google Scholar]


