Abstract
EPR imaging has emerged as an important tool for noninvasive three-dimensional (3D) spatial mapping of free radicals in biological tissues. Spectral–spatial EPR imaging enables mapping of the spectral information at each spatial position, and, from the observed line width, the localized tissue oxygenation can be mapped. We report the development of EPR imaging instrumentation enabling 3D spatial and spectral–spatial EPR imaging of small animals. This instrumentation, along with the use of a biocompatible charcoal oximetry-probe suspension, enabled 3D spatial imaging of the gastrointestinal (GI) tract, along with mapping of oxygenation in living mice. By using these techniques, the oxygen tension was mapped at different levels of the GI tract from the stomach to the rectum. The results clearly show the presence of a marked oxygen gradient from the proximal to the distal GI tract, which decreases after respiratory arrest. This technique for in vivo mapping of oxygenation is a promising method, enabling the noninvasive imaging of oxygen within the normal GI tract. This method should be useful in determining the alterations in oxygenation associated with disease.
Keywords: oximetry, magnetic resonance imaging, metabolism, activated charcoal, free radical
Tissue oxygenation is an important regulator of physiological function, and alterations in oxygenation are of critical importance in the pathogenesis of disease. Oxygen concentrations vary greatly in different tissues and are modulated by alterations in vascular flow and metabolic work. Therefore, there has been a great need for noninvasive techniques suitable for measurement and spatial mapping of oxygen in models of disease and in humans.
In the gastrointestinal (GI) tract, tissue oxygen tension has been used to assess intestinal function and viability (1, 2). Oxygen tension varies in bowel ischemia where there is limited perfusion and in inflammatory bowel disease (3). Past techniques for measurement of oxygen tension in the GI tract have been based primarily on modified Clark electrodes with surgical laparotomy or endoscopy (1, 4, 5). The invasive nature of these methods has limited greatly the ability to perform measurements of oxygen in the clinical diagnosis and treatment of disease, as well as in animal models of the pathogenesis of disease (6–9). In addition, there are concerns that these invasive methods with external cannulation could perturb the values of oxygen that are measured. Thus, there is a great need for a noninvasive technique suitable for in vivo measurement and spatial mapping of oxygen within the GI tract.
EPR imaging techniques have enabled the spatial mapping of paramagnetic species in isolated organs and other ex vivo or in vitro biological systems (10–16). With the use of suitable oximetry probes, this technique can measure tissue oxygenation or oxygen tension. Molecular oxygen is paramagnetic; it produces line width broadening caused by spin–spin interaction of oxygen with the probe, and the magnitude of this broadening is a function of the concentration of oxygen. Although spatial EPR imaging provides a map of spin distribution in the sample, spatial EPR imaging does not provide information related to spectral line shape (16–18). However, spectral–spatial imaging techniques have been developed to enable spatial imaging with determination of the EPR line shape at each spatial point (13, 19–21). Thus, by using these spectral–spatial imaging techniques, oxygen concentration or tension can be imaged.
We report the development of instrumentation enabling three-dimensional (3D) spatial EPR imaging as well as spectral–spatial EPR imaging of small animals. This instrumentation was applied to map oxygen tension within the lumen of the GI tract by using a charcoal oximetry probe that is suitable for clinical use. Spatial EPR 3D imaging enabled visualization of the spatial structure and anatomy of the GI tract, whereas spectral–spatial EPR imaging enabled measurement of the oxygen tension at different locations. This methodology enables noninvasive mapping of oxygenation in living animals and has potential for clinical applications for humans.
MATERIALS AND METHODS
Spin Probe.
Activated charcoal (American Norit, Milwaukee, WI) was used as the EPR oximetry probe. The charcoal was mixed with glucose in a 1:1 (wt/wt) ratio and stirred thoroughly with water to a semisolid form. This mixture was used to feed the mice before the EPR imaging experiments.
Mouse Preparation.
C3H mice weighing ≈30 g were used. Before feeding the mice with charcoal, solid-food intake was stopped for 12 h, after which the mice were fed a mixture of charcoal and sugar for 24 h. The mice then were anesthetized with 20 mg/kg pentobarbital by i.p. injection. With this dose, anesthesia could be maintained for a period of ≈2 h. To ensure that neither anesthesia nor microwave heating on placement inside the EPR resonator altered the core body temperature of the mice, measurements were performed in selected mice with a BetaTherm (Shrewsbury, MA) thermal resistor rectal probe. It was observed that the body temperature remained stable at 37 ± 1°C for the typical 2- to 3-h period of experimental measurements. The tail vein was cannulated to allow administration of additional anesthesia as required, which enabled both the extension of the duration of anesthesia for periods of 4 h and the rapid induction of respiratory arrest by pentobarbital overdose. In some animals, to assure further that the GI tract was filled with the label, a bolus (0.5 ml) of activated-charcoal suspension also was infused after intubation of the stomach. No adverse effects were noted with charcoal feeding, even after continuous feeding for 3 days. Animals survived the feeding and imaging, unless purposely killed in the experimental protocol. For experiments in which respiratory arrest was induced, the mice were given an overdose of pentobarbital by rapid bolus intravenous infusion of 20 mg of the drug. A total of 12 mice were studied for the spatial and spectral–spatial imaging protocols described.
EPR Imaging Instrumentation.
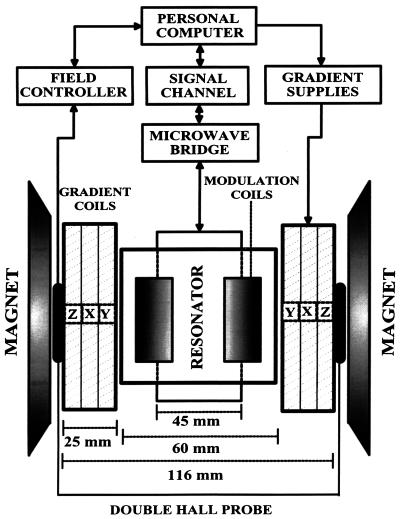
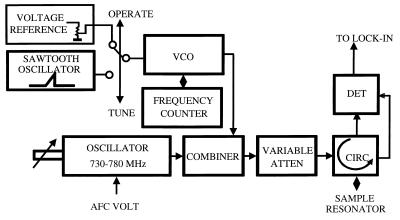
EPR spectroscopy and EPR imaging experiments were performed by using instrumentation consisting of a 750-MHz narrow-band rf bridge, a transverse electric-field reentrant resonator (22), and three sets of water-cooled gradients. Fig. 1 shows a block diagram of the EPR imaging instrument. The magnetic-field system uses a 15" pole diameter iron-core electromagnet, custom-designed ring shims with gaps of 116 mm, and 3D water-cooled gradient sets consisting of a set of Maxwell coils for the z axis and rectangular pair coils for the x and y axes, each capable of gradients of up to 120 G/cm. The static field was regulated with a double-Hall-probe arrangement to compensate for z gradient-induced field pulling, and the Hall probes were positioned precisely for null gradient field along the x and y axes. The gradients were powered with home-built six-channel switching operational amplifier-based supplies capable of up to 1 kW per channel. A Bruker (Billerica, MA) field controller (ER032M) and signal channel (ER023M) were used. We designed the transverse electric-field reentrant resonator with a transverse capacitive element that facilitates access to the capacitive gap, enabling the tuning of the frequency and capacitive coupling. This resonator was capable of accommodating and measuring a cylindrical volume of up to 45 mm in diameter and 60 mm in length. A detailed technical description and analysis of this resonator has been reported (22). Fig. 2 shows a block diagram of the narrow-band rf bridge. Data acquisition and image reconstruction for 3D spatial or spectral–spatial EPR imaging were performed with imaging software written for a personal computer interfaced to the spectrometer as described (21, 23).
Figure 1.
Diagram of the 750-MHz whole-body EPR imaging system.
Figure 2.
Block diagram of the narrow-band rf bridge. For the narrow-band bridge, a wider sweep is required to visualize the resonator mode; therefore, the bridge has two oscillators. The main low-noise narrow-band (730- to 780-MHz) oscillator (Magnum Microwave, San Jose, CA) works in the “operate” mode, providing low-noise bridge performance, whereas a Voltage Controlled Oscillator (VCO; Minicircuits, Brooklyn, NY) with a wide tuning range replaces the main oscillator in the “tune” mode, allowing visualization of the resonator mode.
Oximetry Calibration and Measurement.
Measurements of the line width of activated-charcoal suspension after equilibration with a series of oxygen and nitrogen gas mixtures were performed with the 750-MHz spectrometer. Calibration was performed over the oxygen-concentration range (0–21%) with oxygen/nitrogen gas mixtures. In these experiments, the time response of the observed line width changes was measured, and equilibration for a given oxygen tension occurred in less than 5 min. It was observed that the oxygen-dependent line width of these charcoal suspensions was stable and unchanged even 1 week after preparation. No significant alterations in oxygen-dependent broadening were seen over the temperature range from 24°C to 37°C. The oxygen sensitivity also was unaffected after oral ingestion in mice after periods of 3 days or more. The O2 tension values from the spectral–spatial image data were measured from the line width value observed in five pixels at the specific region of the GI tract, and values are represented as mean (in torr) ±SEM. (Note that 1 torr = 133 Pa.)
Coregistration of Images with Anatomy.
The linearity of the spatial frame of the imaging volume and its correspondence to true dimensions was established through a series of prior validation imaging experiments on arrangements of precisely separated point samples along the x, y, or z axis, as well as on 3D phantoms of known geometry. From these measurements, the position of the gradient center with respect to the longitudinal x axis of the sample holder was determined and marked, as well as that for the y and z axes. A reference mark also was placed at the center of the abdomen to align the x and z axes. The animal in the prone position was placed in the holder, with the marks on the holder and abdomen aligned. This positioning ensured that the longitudinal gradient center plane (x) and the transverse gradient center plane (z) were superimposed on the reference mark at the center of the abdomen. After the animals were killed, necropsy was performed, and the actual distance along the x axis of organs and sections of the GI tract from the reference plane was measured. This procedure enabled confirmation of the assignment of particular regions of the image to the sections of the GI tract.
RESULTS AND DISCUSSION
The EPR line width of activated charcoal is sensitive to oxygen because of spin–spin coupling of paramagnetic oxygen molecules with the unpaired electron of activated charcoal. Activated charcoal has been used to measure oxygen tension in mammalian cells and tissues (14, 24). In the present study, we used activated charcoal as spin label to measure oxygen concentration inside the GI tract of mice. The activated charcoal was mixed with glucose to make it nutritious and to enhance its spontaneous oral intake by the mice. The mice were allowed to feed on the charcoal–sugar diet for periods of 24–72 h before measurements were performed.
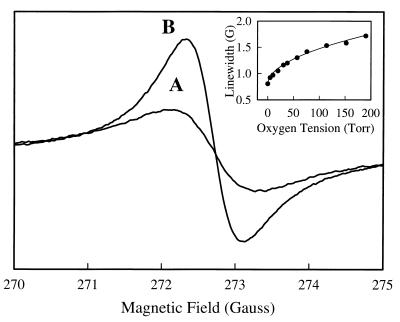
The EPR line width of a charcoal and water suspension was calibrated as a function of oxygen tension. The line width was 1.50 G in room air, and under anaerobic conditions, the line width was 0.80 G (Fig. 3). Over the physiological oxygen-concentration range (0–21%; 0–160 torr), the line width varied in a nonlinear manner as shown in the inset of Fig. 3. The experimental calibration curve was fitted with a power function L = 0.80 + (0.06 × [O2]0.51), where L is the peak-to-peak line width of the activated charcoal and [O2] is the oxygen concentration.
Figure 3.
EPR spectra of charcoal suspension equilibrated with room air (21% oxygen; line A) and 0% oxygen (line B). The Inset shows the variation of line width that occurs as a function of oxygen tension. Measurements were performed with a microwave frequency of 763 MHz, a modulation amplitude of 0.4 G, a field modulation of 100-kHz, and a microwave power of 60 mW.
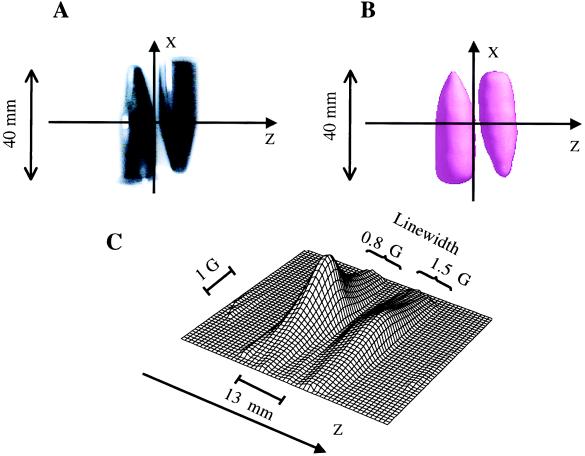
Validation measurements for spatial and spectral–spatial EPR imaging were performed on a phantom containing the charcoal suspension. These measurements served to test the quality of 3D spatial EPR imaging, as well as the accuracy of the line width and oximetry values obtained with spectral–spatial imaging. The same amount of the suspension was filled into two centrifuge tubes: one equilibrated in room air and the other deoxygenated with sodium hydrosulfite. Fig. 4A shows a photograph of the phantom, and Fig. 4 B and C shows the 3D spatial image and spectral–spatial profile of the phantom, respectively. From Fig. 4B, we observe that the 3D spatial EPR image provides accurate information regarding the spatial distribution of the spin probe. The line width data obtained from the spatially resolved spectral data (Fig. 4C) are in good agreement with the calibration obtained by EPR spectroscopy (Fig. 3).
Figure 4.
EPR imaging of a phantom of the charcoal spin probe. The phantom consists of two conical centrifuge tubes. (A) Photograph of the phantom; (B) 3D spatial image; (C) 2D spectral–spatial image. The imaging parameters for 3D spatial imaging were a 746-MHz microwave frequency; 1,024 projections; a 15-G/cm gradient; a 5-s projection acquisition time; a 0.4-G modulation amplitude; and a 40-mm spatial window (field of view). The parameters for 2D spectral–spatial image were a 5-G spectral window; a 40-mm spatial window; a 5-s base projection acquisition time; and a 5-min total acquisition time. Microwave power of 60 mW was used.
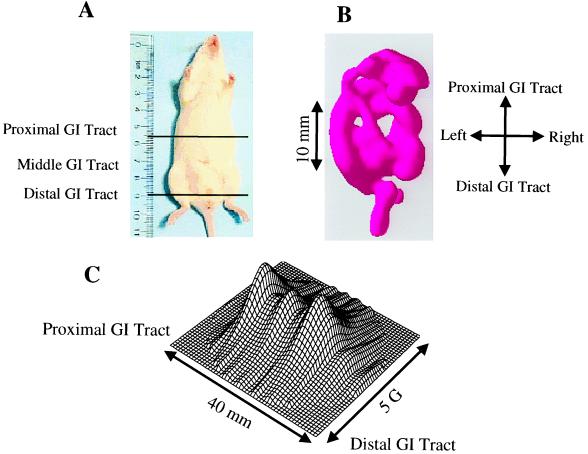
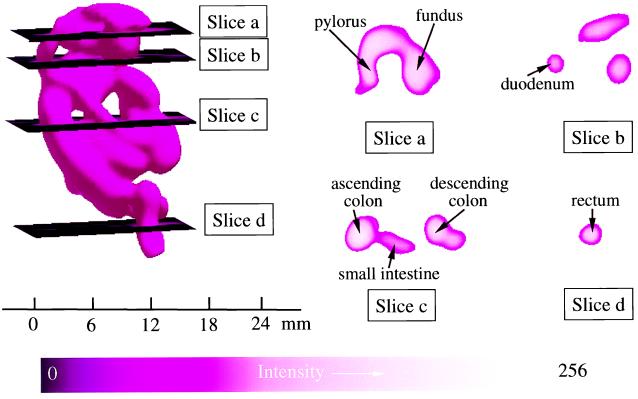
In preliminary experiments with mice fed charcoal for periods of 24–72 h, it was observed on laparotomy that 24 h of feeding was sufficient to fill the GI tract from the stomach to the distal colon and rectum. In vivo EPR measurements performed on these mice also showed that a maximum EPR signal was observed with 24 h of charcoal feeding, and no further increase occurred with longer periods of feeding. Therefore, EPR imaging experiments were performed on mice after 24 h of charcoal feeding. The mice were anesthetized and placed inside the resonator facing down, and then 2D spectral–spatial imaging and 3D spatial imaging measurements were performed. Fig. 5A shows a photograph of the mouse with demarcation of the active area imaged, whereas Fig. 5B shows the corresponding surface rendered 3D spatial EPR image. The 3D spatial EPR image data enable visualization of the location of the charcoal probe in the GI tract from the stomach, to the duodenum, mid and distal small intestine, as well as the ascending colon, transverse colon, descending colon, sigmoid colon, and rectum. Cross-sectional cuts through the 3D image enable visualization of the internal structure of the GI tract at different levels (Fig. 6). Cross-sectional cuts at the level of the mid stomach enable visualization of the fundus and pylorus of the stomach (Fig. 6, slice a). A more distal cut shows the lumen of the mid duodenum (Fig. 6, slice b). A further distal cut shows a cross section through the ascending colon, small intestine, and descending colon (Fig. 6, slice c). The most distal cut shows the lumen of the rectum (Fig. 6, slice d). The spatial image data seen in Figs. 5 and 6 corresponded to the anatomic structure and charcoal distribution found on postmortem laparotomy. In Fig. 5C, the corresponding 2D spectral–spatial image along the longitudinal axis of the mouse from the proximal to the distal GI tract is shown. The line width was measured along the longitudinal axis and was found to decrease from the proximal to the distal GI tract. For each of the planes shown in Fig. 6 the oxygen concentration was calculated from the observed line width data.
Figure 5.
Photograph of the mouse studied with demarcation of the region imaged and corresponding 3D spatial and 2D spectral–spatial image data. (A) A photograph of the mouse with a ruler for scale. The area imaged is shown between black lines. The mouse was fed with the charcoal probe for 1 day. (B) Spatial EPR 3D image visualizing the location of the charcoal probe in the GI tract. (C) Spectral–spatial 2D image data along the longitudinal axis from the proximal to the distal GI tract. The parameters for 3D spatial and for 2D spectral–spatial imaging are described in Fig. 4.
Figure 6.
Spatial EPR 3D image data showing the cross-sectional structure of the GI tract at different levels. (Left) The complete 3D surface rendering of the image of the charcoal probe in the GI tract. Planar sections through this image are shown at four levels. Slice a shows a section at the level of the mid stomach where the fundus and pylorus of the stomach can be seen with the taper to the pyloric valve. Slice b shows a section at the level of the mid duodenum. The lumen of the duodenum is seen on the left along with less defined cuts on the right through the lower edge of the lumen of the stomach, anteriorly, and what appear to be the transverse colon and small intestine just below the stomach, posteriorly. Slice c shows a section at the level of the mid colon and mid small intestine where distinct cuts through the ascending colon, small intestine, and descending colon occur. Slice d shows a section at the level of the distal sigmoid colon–rectal junction where the lumen is seen clearly. The parameters for 3D spatial imaging are described in Fig. 4.
To confirm the decrease in line width and oxygenation from the proximal to the distal GI tract, experiments were performed with administration or feeding of the animals for discrete times, after which EPR measurements of line width were taken and the animals were killed to verify anatomic location. With acute infusion, after 15–30 min, the line width values and calculated oxygen tensions were in the range of 50–60 torr, in agreement with the values obtained from the imaging at the level of the stomach (58 ± 15 torr). Both 3D spatial EPR imaging and laparotomy confirmed that the charcoal was present primarily in the stomach. After acute feeding followed by 2 days, the charcoal oximetry probe was found on autopsy in the distal colon and rectum; the oximetry values obtained before the mice were killed were similar to those from the imaging experiments (3 ± 1 torr).
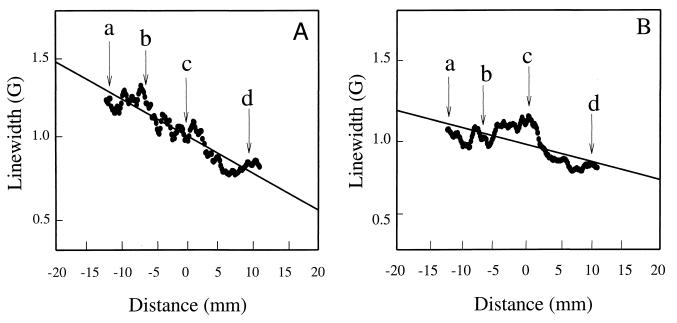
After respiratory arrest, systemic oxygen concentrations fall, and it would be expected that oxygenation within the gut also would decrease; however, the time course of this process at different levels of the GI tract is not known. To determine the effect and time course of alterations in oxygenation within the GI tract after respiratory arrest, mice were administered an overdose of pentobarbital by i.v. infusion. The variation of oxygen concentration was obtained as a function of time with a series of 2D spectral–spatial imaging measurements. At the end of the spectral–spatial measurements, 3D spatial imaging was performed to obtain 3D mapping of the distribution of the charcoal spin label. This 3D mapping enabled coregistration of the spectral–spatial image with the 3D spatial image, which, in turn, facilitated assignment of the spectral data and calculated oxygen values within the GI tract. Fig. 7A shows a plot of the line width data as a function of spatial position obtained from spectral–spatial EPR imaging of a living mouse, and Fig. 7B shows the line width data vs. spatial position obtained from spectral–spatial EPR imaging of the mouse 30 min after respiratory arrest. Before arrest, the line width along the GI tract—and thus the oxygen concentration—decreased from the proximal GI tract to the distal GI tract. After arrest, the oxygen-tension differences greatly decreased. In a series of six animals subjected to this imaging protocol, similar results were observed both before and after respiratory arrest.
Figure 7.
Graph of the line width of the charcoal oximetry probe at different locations of the GI tract of the mouse when it was alive (A) and 30 min after respiratory arrest (B). The arrows show the position of each of the planar cross sections shown in Fig. 6: a, level of mid stomach; b, level of mid duodenum; c, level of mid colon and mid small intestine; and d, level of sigmoid colon–rectal junction.
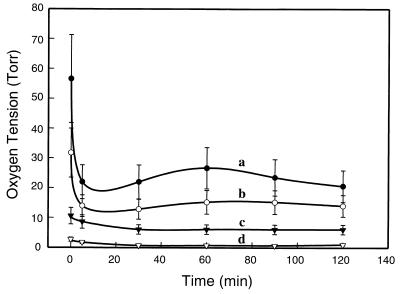
The time course of the change in oxygen within the GI tract after respiratory arrest was followed by spectral–spatial imaging for 2 h after arrest. The oxygen tension was calculated from the observed line width data obtained in these images. Although, before arrest, the oxygen tension at the level of the mid stomach (Fig. 6, slice a) was 58 ± 15 torr, it decreased rapidly within the first 5 min after arrest to a value of 22 ± 4 torr (Fig. 8, line a). At the level of the mid duodenum (Fig. 6, slice b), the oxygen tension was 32 ± 8 torr before ischemia, and it decreased to 14 ± 3 torr only 5 min after arrest (Fig. 8, line b). At the level of the mid small intestine and mid colon (Fig. 6, slice c), the oxygen tension was 11 ± 3 torr before arrest and decreased gradually over 30 min to 5 ± 1 torr (Fig. 8, line c). At the level of the distal sigmoid colon—rectal junction (Fig. 6, slice d), the basal oxygen tension was 3 ± 1 torr, and it gradually decreased to 0.5 ± 0.3 torr over 30 min (Fig. 8, line d).
Figure 8.
Time course of the change in oxygen tension at different levels of the GI tract before and after respiratory arrest. Values were calculated from the oxygen-dependent line width broadening by using the calibration data shown in Fig. 3. The levels are as defined by the planar cross sections shown in Fig. 6. Line a, level of mid stomach; line b, level of mid duodenum; line c, level of mid colon and mid small intestine; and line d, level of sigmoid colon–rectal junction.
The observed oxygen gradient seen along the GI tract can be explained by a combination of processes. When food is swallowed, it would be initially equilibrated with the oxygen tension of room air. On passage to the stomach and later the small intestine, the oxygen levels would fall as oxygen diffuses across the mucosal membrane. A gradual process of equilibration with the capillary levels of oxygen (i.e., 5–10 torr; ref. 9) would occur. On passage to the colon, with its heavy bacterial colonization, further decreases in oxygenation would be expected. The presence of marked hypoxia within the lumen of the distal colon is consistent with the known abundance of anaerobic bacteria at this site.
Activated charcoal is commonly used in humans for the clinical treatment of a variety of types of oral poisoning or drug overdose. Activated charcoal also is used in oral medications for the treatment of indigestion. As such, it is known to be well tolerated in humans. Although the material used in the present study was a commonly available charcoal, a number of laboratories have shown that with special controlled formulations or types of chars, both the paramagnetic content and the oxygen-dependent line width broadening can be enhanced (25, 26). With future development and application of optimized formulations, it would be expected that further enhancement of the image quality and sensitivity of oxygen measurement could be achieved.
It was observed that the charcoal oximetry spin probe was nontoxic and well tolerated with feeding for up to 3 days. In animals fed with this spin probe, spatial EPR imaging enabled clear 3D spatial visualization of the entire GI tract distal to the esophagus. With spectral–spatial imaging, spatial differences in oxygen tension could be mapped. Differences in oxygen tension at levels from the stomach to the small intestine, colon, and rectum were determined and mapped as a function of time. These measurements show that there is a marked oxygen gradient from the proximal to the distal GI tract. Because the charcoal probe used is nontoxic and suitable for oral administration in humans, this technique of oxygen mapping in the GI tract may be applicable for clinical use in humans once suitable clinical instrumentation is developed. With further advances in EPR imaging instrumentation for in vivo applications and the development of optimized solid-state oximetry probes, this technology holds great promise for noninvasive measurement and imaging of oxygen in animal models of disease and as well as eventual clinical use in humans.
Acknowledgments
We thank Dr. Harold M. Swartz and Dr. John W. Harmon for helpful comments and advice.
ABBREVIATIONS
- GI
gastrointestinal
- 2D and 3D
two- and three-dimensional
References
- 1.Sheridan W G, Lowndes R H, Young H L. Am J Surg. 1990;159:314–319. doi: 10.1016/s0002-9610(05)81226-7. [DOI] [PubMed] [Google Scholar]
- 2.Knudson M M, Bermudez K M, Doyle C A, Mackersie R C, Hopf H P, Morabito D. J Trauma. 1997;42:608–616. doi: 10.1097/00005373-199704000-00005. [DOI] [PubMed] [Google Scholar]
- 3.Hauser C J, Locke R R, Kao H W, Patterson J, Zipser R D. J Lab Clin Med. 1988;112:68–71. [PubMed] [Google Scholar]
- 4.Cooper G J, Sherry K M, Thorpe J A. Eur J Cardiothorac Surg. 1995;9:158–160. doi: 10.1016/s1010-7940(05)80065-x. [DOI] [PubMed] [Google Scholar]
- 5.Larsen P N, Moesgaard F, Naver L, Rosenberg J, Gottrup F, Kirkegaard P, Helledie N. Scand J Gastroenterol. 1991;26:409–418. doi: 10.3109/00365529108996503. [DOI] [PubMed] [Google Scholar]
- 6.Landow L, Phillips D A, Heard S O, Prevost D, Vandersalm T J, Fink M P. Crit Care Med. 1991;19:1226–1233. doi: 10.1097/00003246-199110000-00003. [DOI] [PubMed] [Google Scholar]
- 7.Kram H B, Appel P L, Fleming A W, Shoemaker W C. Crit Care Med. 1986;14:707–713. doi: 10.1097/00003246-198608000-00008. [DOI] [PubMed] [Google Scholar]
- 8.Zabel D D, Hopf H W, Hunt T K. Shock. 1996;5:341–343. doi: 10.1097/00024382-199605000-00005. [DOI] [PubMed] [Google Scholar]
- 9.Uribe N, Garcia-Granero E, Belda J, Calvete J, Alos R, Marti F, Gallen T, Lledo S. Eur J Surg. 1995;161:569–573. [PubMed] [Google Scholar]
- 10.Berliner L J, Fujii H. Science. 1985;227:517–519. doi: 10.1126/science.2981437. [DOI] [PubMed] [Google Scholar]
- 11.Halpern H J, Bowman M K, Spencer D P, Polen J V, Dowey E M, Massoth R J, Nelson A C, Teicher B A. Rev Sci Instrum. 1989;60:1040–1050. [Google Scholar]
- 12.Kuppusamy P, Shankar R A, Zweier J L. Phys Med Biol. 1998;43:1837–1844. doi: 10.1088/0031-9155/43/7/003. [DOI] [PubMed] [Google Scholar]
- 13.Maltempo M M. J Magn Reson. 1986;69:156–161. [Google Scholar]
- 14.Goda F, Liu K J, Walczak T, O’Hara J A, Jiang J, Swartz H M. Magn Reson Med. 1995;33:237–245. doi: 10.1002/mrm.1910330214. [DOI] [PubMed] [Google Scholar]
- 15.Krishna M C, Kuppusamy P, Afeworki M, Zweier J L, Cook J A, Subramanian S, Mitchell J B. Breast Dis. 1998;10:209–220. doi: 10.3233/bd-1998-103-420. [DOI] [PubMed] [Google Scholar]
- 16.Woods R K, Bacic G C, Lauterbur P C, Swartz H M. J Magn Reson. 1989;84:247–254. [Google Scholar]
- 17.Alecci M, Colacicchi S, Indovina P L, Momo F, Pavone P, Sotigiu A. Magn Reson Imaging. 1990;8:59–63. doi: 10.1016/0730-725x(90)90213-l. [DOI] [PubMed] [Google Scholar]
- 18.Kuppusumy P, Chzhan M, Zweier J L. J Magn Reson Ser B. 1995;106:122–130. doi: 10.1006/jmrb.1995.1022. [DOI] [PubMed] [Google Scholar]
- 19.Ewert U, Herrling T. Chem Phys Lett. 1986;129:516–520. [Google Scholar]
- 20.Woods R K, Dobrucki J W, Glockner J F, Morse P D, Swartz H M. J Magn Reson. 1989;85:50–59. [Google Scholar]
- 21.Kuppusumy P, Chzhan M, Vij K, Shteynbuk M, Gianella E, Lefer D J, Zweier J L. Proc Natl Acad Sci USA. 1994;91:3388–3392. doi: 10.1073/pnas.91.8.3388. [DOI] [PMC free article] [PubMed] [Google Scholar]
- 22.Chzhan M, Kuppusamy P, Samouilov A, He G, Zweier J L. J Magn Reson. 1999;137:373–378. doi: 10.1006/jmre.1998.1689. [DOI] [PubMed] [Google Scholar]
- 23.Kuppusamy P, Chzhan M, Samouilov A, Wang P, Zweier J L. J Magn Reson Ser B. 1995;107:116–125. doi: 10.1006/jmrb.1995.1067. [DOI] [PubMed] [Google Scholar]
- 24.Zweier J L, Chzhan M, Ewert U, Schneider G, Kuppusamy P. J Magn Reson Ser B. 1994;105:52–57. doi: 10.1006/jmrb.1994.1099. [DOI] [PubMed] [Google Scholar]
- 25.Liu K J, Miyake M, James P E, Swartz H M. J Magn Reson. 1998;133:291–298. doi: 10.1006/jmre.1998.1480. [DOI] [PubMed] [Google Scholar]
- 26.Swartz H M, Clarkson R B. Phys Med Biol. 1998;43:1957–1975. doi: 10.1088/0031-9155/43/7/017. [DOI] [PubMed] [Google Scholar]


