

Abstract
C-reactive protein (CRP) is an acute-phase reactant whose levels increase in response to a variety of inflammatory stimuli. Elevated levels in serum are observed after trauma, tissue necrosis, infection, surgery, and myocardial infarction and are associated with an increased risk of cardiovascular disease. CRP levels are also elevated in noninflammatory states, such as obesity, sleep disturbances, depression, chronic fatigue, aging, and physical inactivity. In this study, the performance of a highly sensitive CRP enzyme immunoassay was evaluated, along with common laboratory variables (specimen type, processing time, and storage conditions) that may influence measured blood concentrations of CRP. The measurement range of the assay was from 0.4 to 50 μg/liter. Total imprecision (coefficient of variation) ranged from 8.1 to 11.4%. CRP levels obtained with the enzyme immunoassay were highly correlated with those obtained with an automated immunonephelometric assay. Comparable results were obtained for plasma (heparin and EDTA treated) and serum samples, and levels were unaffected by delays in sample processing and storage temperature. CRP levels were also unaffected by up to seven freeze-thaw cycles. The median CRP concentration in healthy adults was determined to be 0.94 mg/liter, with a 95% working reference interval of 0 to 6.9 mg/liter. In view of these data, we recommend that serial serum or plasma samples for CRP should be stored at 4oC for short periods of time or at −70oC for longer periods and tested within the same run to minimize interassay variability.
C-reactive protein (CRP) is one of several plasma proteins, designated acute-phase reactants, whose levels rapidly increase in response to stress, tissue injury, and a variety of inflammatory stimuli. CRP was discovered in 1930 at the Rockefeller Institute for Medical Research (32). The name is based on an observation in the 1940s that sera from patients who had recovered from pneumococcal infections could form visible flocculates when incubated with C polysaccharide from the same bacterium (18). CRP has a mass of 118 to 144 kDa and is composed of five identical polypeptide subunits held together by noncovalent interactions (10, 23). CRP is predominantly synthesized by the liver and is regulated by proinflammatory cytokines, primarily tumor necrosis factor alpha and interleukin 6 (3, 13) During an acute-phase response, there is a rapid increase in the production of CRP (≥100-fold), resulting in the release of elevated quantities into the circulation (48). The plasma half-life of CRP is approximately 19 h (35).
Although its function is unclear, CRP may serve as a general scavenger protein, recognizing and binding toxic molecules released from damaged tissues for subsequent removal from the circulation (11, 38). CRP binds a variety of microorganisms and can activate the classical complement pathway, resulting in C3b deposition on the surfaces of microorganisms (37, 43). Thus, CRP can play an important role in opsonization, phagocytosis, and cell-mediated cytotoxicity.
Because CRP is one of the most sensitive indicators of an acute-phase reaction (increases in levels can be detected within 12 to 48 h), its levels in blood can be used to screen for organic diseases and to monitor inflammatory and autoimmune disorders. CRP is also useful for managing neonatal septicemia and for identifying organ rejection in renal transplant recipients (31). CRP can be elevated in noninflammatory states, such as obesity (12, 36, 47), sleep disturbances (34), depression (1), chronic fatigue (2), aging (15), physical inactivity (29), and radiotherapy (4), and in persons who smoke (28, 33). In addition, numerous studies have shown that CRP is a risk factor for cardiovascular disease and has a prognostic value for patients with acute coronary syndrome (16, 17, 22).
The present study was undertaken to evaluate the performance of a highly sensitive immunoassay for CRP and to identify common laboratory variables that may influence CRP concentrations, such as specimen type, processing time, and specimen storage conditions.
MATERIALS AND METHODS
Specimens.
Serum and plasma samples were obtained from healthy volunteers and HIV-negative or -positive subjects participating in the Multicenter AIDS Cohort Study (MACS) of the Natural History of AIDS at the University of California at Los Angeles (UCLA). The protocol was approved by the institutional review board for human studies at UCLA, and blood samples were obtained after informed consent. Blood was collected in 10-ml glass tubes (Becton Dickinson Vacutainer Systems, Franklin Lakes, N.J.) containing either sodium heparin or EDTA for plasma or in plain tubes without anticoagulant for serum. The contents of collection tubes without anticoagulant were allowed to clot at room temperature for 30 min. In one experiment, clotted blood was stored for 6 h at room temperature. Serum and plasma were separated and stored at either room temperature, +4°C, or −70°C. When needed, serum samples were frozen at −70°C and thawed at room temperature a number of times.
CRP assay.
CRP was measured by a sandwich enzyme immunoassay from Immunodiagnostik (produced in Bensheim, Germany, and distributed by ALPCO Diagnostics, Windham, N.H.). The assay was performed according to manufacturer instructions. Serum and plasma samples were diluted 500-fold with sample diluent prior to analysis. One-hundred-microliter samples of calibrators (0, 0.95, 1.9, 5.6, 16.7, 50, and 150 μg/liter), controls, and unknowns were added to wells of a microtiter plate precoated with rabbit anti-CRP polyclonal antibodies. The CRP calibrators were standardized against the international reference preparation for plasma proteins, CRM 470. The plate was incubated for 1 h at room temperature with shaking on a horizontal mixer. After a wash step (250 μl of wash solution was added to each well and removed a total of five times), 100 μl of peroxidase-labeled rabbit anti-CRP antibody was added to each well; the plate was shaken at room temperature for 1 h. After a wash step, 100 μl of substrate (tetramethylbenizidine) was added to each well. The reaction was stopped 10 to 20 min later by the addition of 50 μl of stop solution. The optical density of each well was determined at 450 nm. A calibration curve was generated, and the concentrations of unknown samples were determined directly from the calibration curve. Results were multiplied by the dilution factor (500) and expressed in milligrams per liter.
A highly sensitive CRP assay was performed with a BNII automated system from Dade-Behring Inc., Newark, Del. The assay uses particle-enhanced immunonephelometry to quantitate CRP in serum samples. Polystyrene particles coated with monoclonal antibodies against CRP become agglutinated when mixed with samples containing CRP. The intensity of light scattering due to the agglutination reaction is measured by the nephelometer and is directly related to the CRP concentration. Samples are automatically diluted 20-fold by the instrument prior to analysis. The assay was standardized against the reference preparation, CRM 470.
Statistical analysis.
A four-parameter curve-fitting program (Bio-Rad Laboratories, Irvine, Calif.) was used to generate the calibration curve. Deming regression analysis was performed by using EP Evaluator software (David Rhoads Associates, Inc., Kennett Square, Pa.). A Student paired t test was used to compare mean values and was performed by using SAS computer software (SAS Institute, Cary, N.C.). A two-sided P value of <0.05 was considered statistically significant. A reference interval was calculated by using the Wilcoxon rank sum test. Sigmaplot software (Jandel Corp., San Rafael, Calif.) was used to produce all graphs.
RESULTS
Performance characteristics.
A typical calibration curve for CRP revealed that CRP concentrations were related to signal strength (optical density) in a nonlinear fashion (Fig. 1). Excellent correlation was observed, with an adjusted r value of 0.997. Mean values for calibrators (based on duplicate testing) had coefficients of variation (CVs) that were usually ≤10%. The zero standard had a mean optical density reading (n = 10 in a single run) of 0.032, with a standard deviation (SD) of 0.005. Based on these findings, the detection limit of the assay was conservatively defined at 0.4 μg/liter. Unknown samples were routinely diluted 500-fold prior to analysis so that CRP concentrations would fall between 0.4 and 50 μg/liter.
FIG. 1.
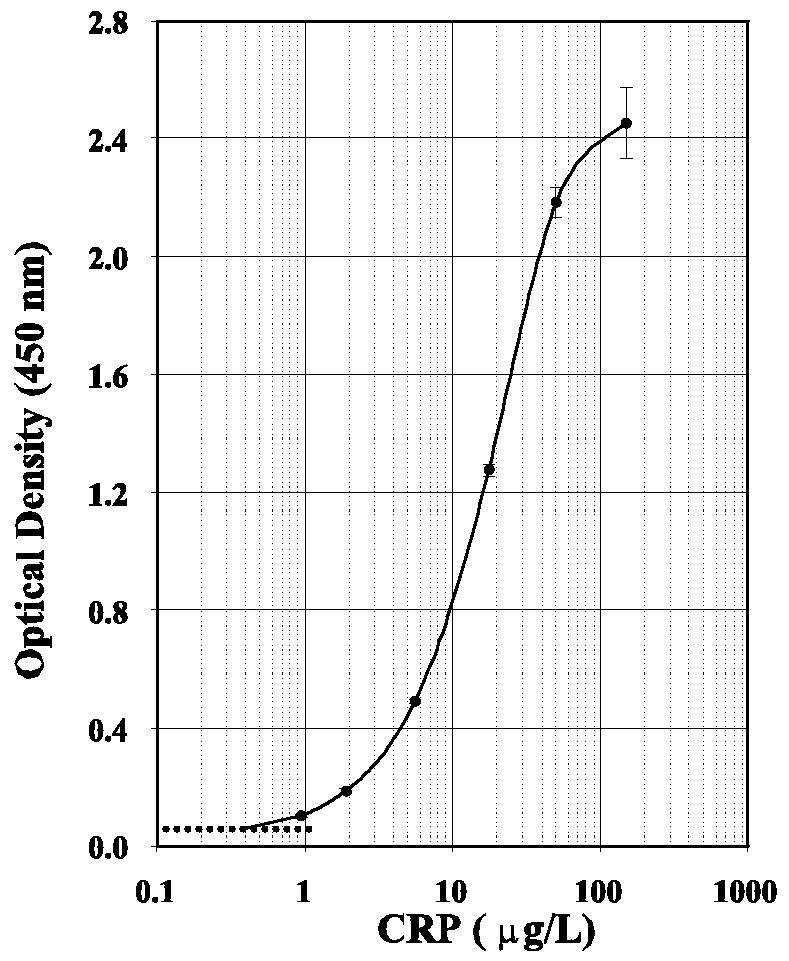
Dose-response curve for the highly sensitive Immunodiagnostik CRP immunoassay. Each calibrator was tested in duplicate. SD bars are shown. The broken line is the mean optical density reading for the zero standard (n = 10) plus 2 SDs.
Assay parallelism was evaluated by performing dilution recovery analyses with 10 serum samples and different CRP concentrations. Depending on the starting CRP concentration, four to six serial twofold dilutions of sera were made before testing. CRP concentrations spanned the working range of the dose-response curve and ranged from 84.0 to 0.4 μg/liter. Interdilution CVs for the 10 samples ranged from 4.6 to 10.2% (mean CV, 6.6%), indicating acceptable performance based on a CV limit of ≤15%. The slope of the curves ranged from 0.99 to 1.07, with a mean slope of 1.03.
Within-run and total imprecision of the CRP assay was evaluated by using commercial controls (provided with the assay) and in-house serum pools. Within-run (intra-assay) CVs for serum pools were 5.7 and 5.6% at mean concentrations of 4.7 and 2.6 mg/liter, respectively (Fig. 2A). Total imprecision (interassay) CVs for commercial controls during a 12-day period were 8.1 and 11.4% at mean concentrations of 24.8 and 2.8 μg/liter, respectively (Fig. 2B). Taken together, these data indicate that the enzyme immunoassay has acceptable performance for routine clinical monitoring of CRP levels.
FIG. 2.

Within-run and total imprecision of the highly sensitive Immunodiagnostik CRP immunoassay. (A) Serum pools were analyzed nine times during the same analytical run. (B) Commercial controls (provided in the assay kit) were tested in duplicate on 12 different days.
Correlation studies.
CRP results obtained by the enzyme immunoassay were compared to results obtained by using the Dade-Behring BNII nephelometer. The BNII nephelometer is an automated immunoanalyzer that is routinely used in the clinical laboratory at the UCLA Medical Center to quantitate CRP serum levels and stratify patients at risk for cardiovascular disease. As shown in Fig. 3, a total of 30 serum samples were analyzed by both methods for CRP at concentrations ranging from 0.2 to 3.6 mg/liter, according to the BNII nephelometer. Deming regression analysis revealed excellent correlation based on a slope of 0.95, a y intercept of 0.05, an r value of 0.987, and an SD of the residuals (Sy/x) of 0.16. These data indicate that the enzyme immunoassay is properly calibrated and does not suffer from analytical bias.
FIG. 3.
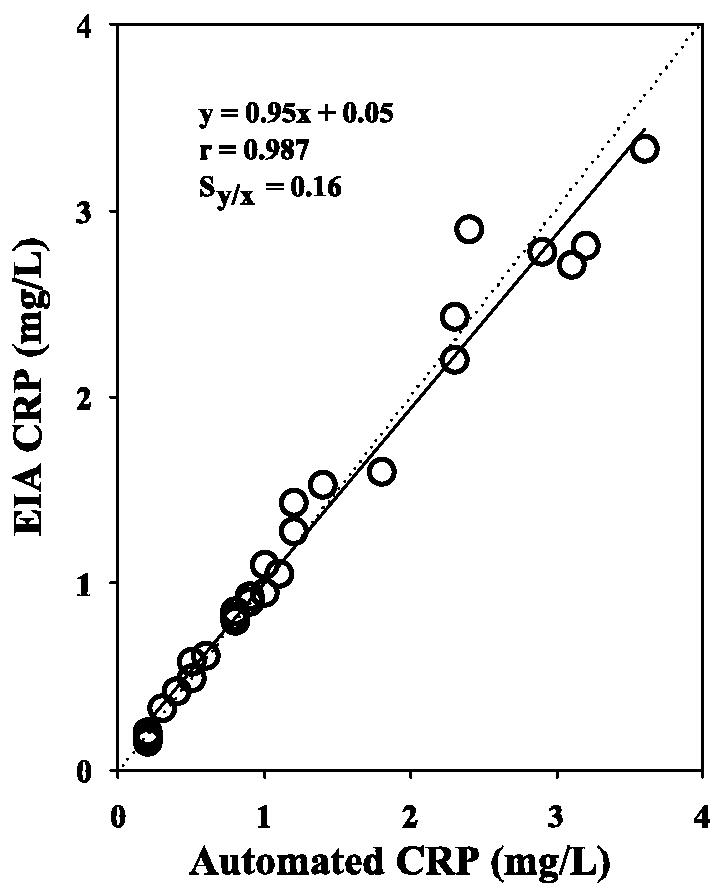
Deming regression analysis of CRP levels obtained by the manual enzyme immunoassay (EIA) (Immunodiagnostik) and an automated nephelometric assay (Dade-Behring). A total of 30 serum samples from healthy donors were analyzed. Sy/x, SD of the residuals.
Influence of sample types on CRP levels.
To determine the effects of various anticoagulants on blood CRP levels, serum, heparinized plasma, and EDTA-treated plasma samples were collected from the same donor and tested for CRP in the same assay. As shown in Fig. 4, CRP levels in heparin- and ETDA-treated plasma samples were not significantly different from those in serum samples. Mean CRP levels were 1.86 mg/liter for serum, 1.82 mg/liter for heparinized plasma, and 1.75 mg/liter for EDTA-treated plasma.
FIG. 4.
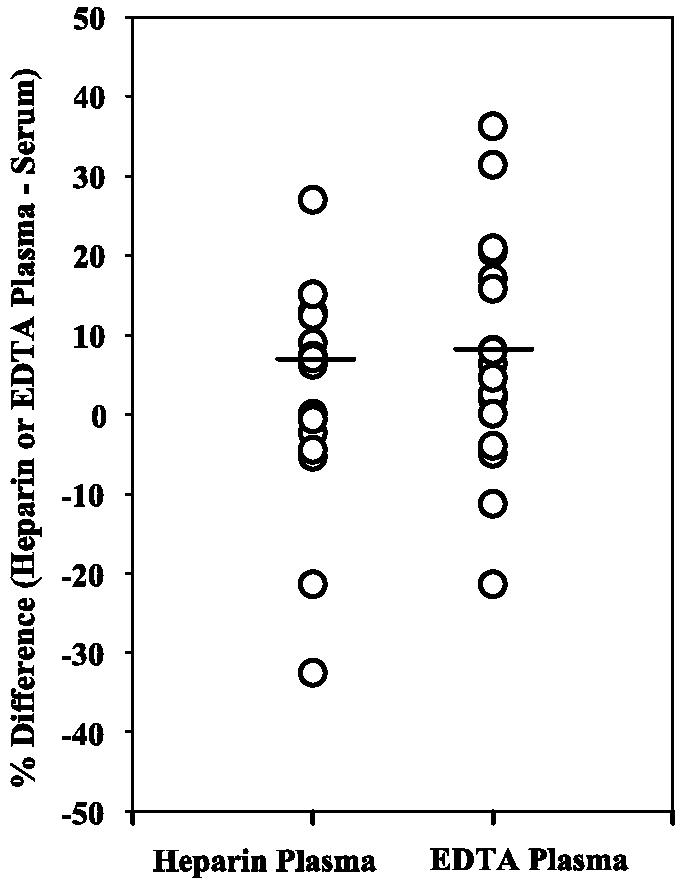
Plasma samples can be used to measure CRP concentrations. Circles represent percent differences in CRP values for heparin- or EDTA-treated plasma samples compared to serum samples (n = 17). The lines represent the mean percent differences for the different types of plasma and serum. No significant difference was observed for CRP values in heparin-treated plasma versus serum (P = 0.38) or EDTA-treated plasma versus serum (P = 0.13).
Influence of processing and storage variables on CRP levels.
Many analyte concentrations are altered when serum is left in contact with erythrocytes after clot formation. To investigate whether a delay in processing would alter serum CRP concentrations, clotted blood was left at room temperature for 6 h before the serum was removed from the clotted blood. As shown in Fig. 5, a delay of 6 h in separating the serum from the cells did not result in a significant change in CRP levels compared to separation after 1 h. Mean CRP concentrations were 2.74 (1 h) and 2.59 (6 h) mg/liter.
FIG. 5.
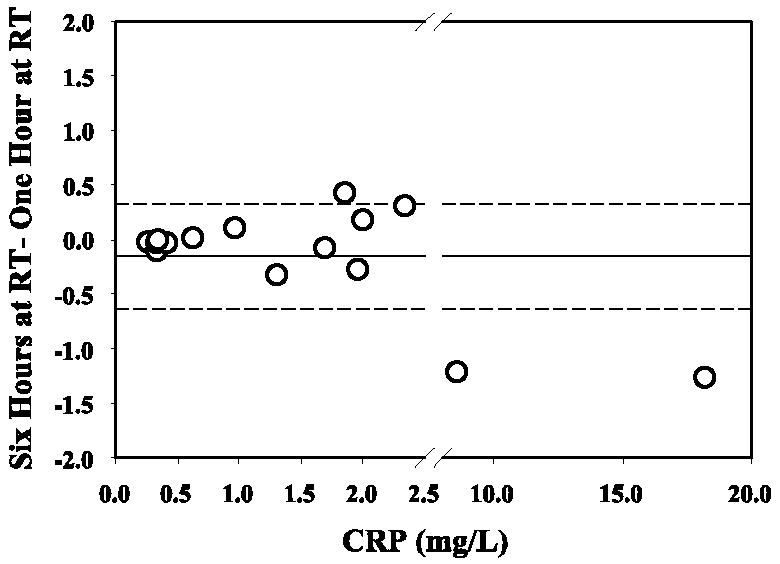
CRP concentrations are not affected by delays in specimen processing. Circles represent differences in CRP values (n = 15) for clotted blood samples that were stored at room temperature (RT) for 6 h compared to 1 h prior to centrifugation and separation of serum. The mean difference is shown as a solid line. The broken lines represent ±1 SD.
To determine the influence of storage temperature on CRP stability, serum samples were split into three aliquots and stored at room temperature (20 to 25°C), refrigerated (4°C), and frozen (−70°C) for 3 weeks. The samples were then brought to room temperature (refrigerated and frozen samples) and tested for CRP. As shown in Fig. 6, CRP levels in specimens stored at room temperature and refrigerated were not significantly different from those in specimens stored at −70°C. Mean CRP concentrations in samples stored frozen, refrigerated, and at room temperature were 4.72, 4.71, and 5.04 mg/liter, respectively.
FIG. 6.
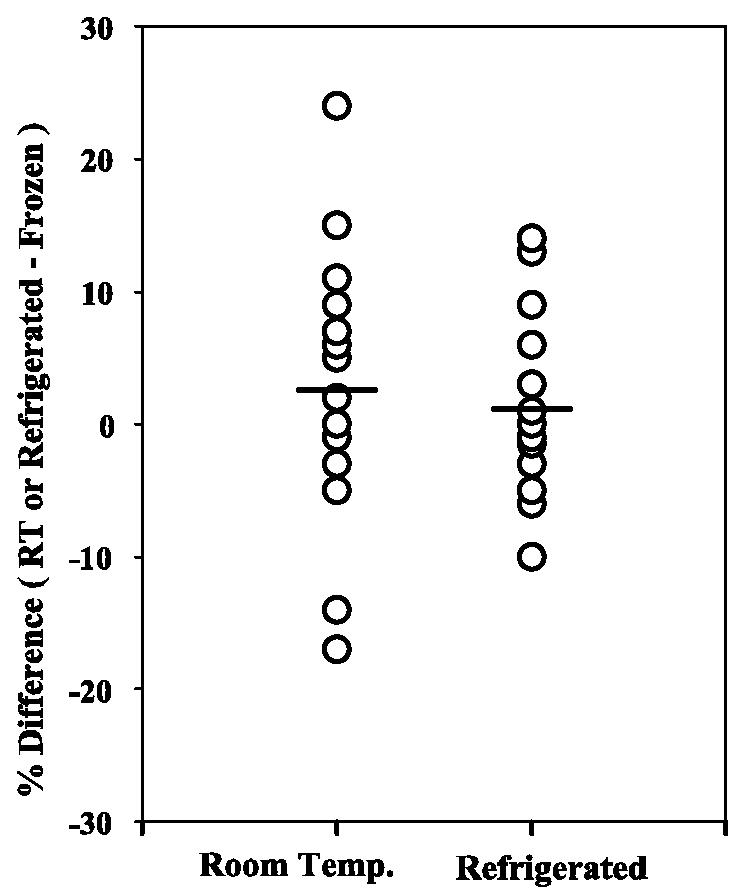
Serum samples can be stored at room temperature or refrigerated without affecting CRP concentrations. Circles represent percent differences in CRP values for samples (n = 19) stored at room temperature (RT or Room Temp.) or refrigerated compared to samples stored frozen at −70°C for 3 weeks. The lines represent the mean percent differences under different storage conditions. No significant difference was observed for CRP values in samples stored at room temperature versus frozen (P = 0.14) or refrigerated versus frozen (P = 0.95).
We next investigated the stability of CRP in serum samples after multiple freeze-thaw cycles. As shown in Fig. 7, CRP levels after 3, 7, and 10 freeze-thaw cycles were not significantly different from those obtained after a single freeze-thaw cycle. Mean concentrations after various numbers of freeze-thaw cycles were as follows: 1 cycle, 2.66 mg/liter; 3 cycles, 2.58 mg/liter; 7 cycles, 2.43 mg/liter; and 10 cycles, 1.89 mg/liter. Although differences in CRP levels after 3 to 10 freeze-thaw cycles were not statistically different, a few samples had considerably lower levels after 10 cycles, indicating that refreezing of serum samples should be minimized and not exceed 7 cycles.
FIG. 7.

Serum samples can undergo multiple freeze-thaw cycles without affecting CRP concentrations. Circles represent percent differences in CRP values for samples (n = 15) undergoing 3, 7, or 10 freeze-thaw cycles compared to one freeze-thaw cycle. The lines represent the mean percent differences for multiple freeze-thaw cycles. No significant difference was observed for CRP values in samples undergoing 3 (P = 0.35), 7 (P = 0.21), or 10 (P = 0.23) freeze-thaw cycles.
Reference range study.
To establish a working adult reference interval, CRP concentrations in serum samples from 62 apparently healthy donors (44 men and 18 women) ranging from 20 to 64 years old were determined. Five of the samples had CRP levels below 0.2 mg/liter (detection limit of 0.4 μg/liter times a dilution factor of 500). Analysis of the data revealed a non-Gaussian distribution (Fig. 8). The median levels for men (0.92 mg/liter) and women (1.05 mg/liter) were not statistically different, as determined by the Wilcoxon rank sum test (P = 0.65). The median CRP level for both women and men combined was 0.94 mg/liter (range, 0 to 9.2 mg/liter), with a 95% reference interval of 0 to 6.9 mg/liter.
FIG. 8.

Frequency distribution of serum CRP concentrations for 62 healthy donors ranging from 20 to 64 years old. Five individuals had CRP concentrations below the detection limit of 0.2 mg/liter. CRP concentrations of 17.2 and 19.4 mg/liter were identified as outliers (by using the interquartile range computation method) and were not used when calculating the 95% reference interval.
DISCUSSION
CRP is one of the most sensitive acute-phase proteins and has been traditionally used for diagnosing and monitoring infections and various autoimmune disorders. However, the lower limit of detection of CRP assays of about 2 mg/liter has severely limited the clinical usefulness of such assays. Recent improvements in assay development have resulted in a new generation of highly sensitive assays that can detect CRP at levels 100-fold lower than earlier assays. Highly sensitive CRP assays are based on either immunonephelometric (5, 27, 41), immunoturbidimetric (41), immunoluminometric (14), microparticle enzyme immunoassay (6, 42, 44), or sandwich immunoassay (39) technologies. Recent studies have provided evidence that elevations of CRP within the normal reference range are associated with an increased risk for cardiovascular disease (7, 9, 16, 17). Furthermore, studies have shown that CRP has prognostic value in patients with acute coronary syndrome and can predict future cardiovascular events in patients considered at low risk (20, 22, 24, 25, 30, 40, 46). In view of the emerging role of CRP in cardiovascular disease, it is important that preanalytical variables that can adversely affect CRP concentrations in blood samples be identified.
Common laboratory variables, such as specimen type, delays in specimen processing, and storage temperature, can dramatically influence measured levels of many analytes. In this study, we examined the influence of several preanalytical variables on CRP levels and found that serum versus plasma, delays of up to 6 h in specimen processing, and storage conditions had little effect on CRP concentrations when measured by a sandwich enzyme immunoassay. In addition, serum samples could undergo up to seven freeze-thaw cycles without a significant adverse effect on CRP levels. However, after 10 freeze-thaw cycles, a few samples had considerably lower CRP levels than those undergoing a single freeze-thaw cycle (>30% difference) (Fig. 7), indicating that multiple freeze-thaw cycles should be kept to a minimum. Consistent with our findings, Macy et al. found that serum and plasma (EDTA and citrate treated) yielded comparable CRP results and that samples were stable after four freeze-thaw cycles when measured by an in-house competitive immunoassay (19). Taken together, these data indicate that CRP is remarkably stable under different specimen processing conditions and storage conditions for several weeks. The influence of different specimen types on CRP levels may vary depending on the assay configuration and should be validated at the beginning of any research project.
An adult reference range study was performed by using 62 serum samples from healthy volunteers. Because donor histories were not obtained, we were unable to exclude donors who smoked, took oral contraceptives or other medications, or had low-grade infections that would influence CRP levels (26). As expected, the distribution of CRP levels was non-Gaussian and skewed to the left, in agreement with other studies measuring CRP by other assay formats (19, 21, 27, 45). Although the number of female donors was small in our reference range study (n = 12), median CRP levels were similar for both sexes. A median CRP level of 0.94 mg/liter was obtained, with a 95% reference interval of 0.0 to 6.9 mg/liter. The latter is similar to the reference interval of 0.08 to 3.11 mg/liter that was obtained by Macy et al. with an in-house competitive immunoassay (19). Many of the reference interval studies performed by nepholometric, turbidimetric, and microparticle enzyme immunoassay techniques have reported reference intervals with a considerably higher upper limit, ranging from 5.2 to 14.7 mg/liter (8, 21). Differences in assay format and calibration as well as the selected donor population may account for some of these differences in published reference range studies.
In summary, we found that specimen type (serum and plasma), delays of up to 6 h in specimen processing, and storage temperature had no effect on measured CRP concentrations. Furthermore, CRP was stable in frozen samples and could withstand up to seven freeze-thaw cycles. In view of these data and those of other studies, we recommend that serial serum or plasma samples should be kept at −70°C if they need to be stored for more than a few weeks and batch analyzed to minimize assay imprecision. The high sensitivity of the CRP assay may make it particularly useful for predicting increased risk for cardiovascular disease.
Acknowledgments
We thank the MACS program for serum and plasma samples. The MACS program has centers (principal investigators) at the Johns Hopkins Bloomberg School of Public Health (Joseph Margolick and Alvaro Munoz), Howard Brown Health Center and Northwestern University Medical School (John Phair), UCLA (Roger Detels and Beth Jamieson), and University of Pittsburgh (Charles Rinaldo).
Support from the MACS program (grant UO1-AI-5040) made this study possible.
REFERENCES
- 1.Berk, M., A. A. Wadee, R. H. Kuschke, and A. O'Neill-Kerr. 1997. Acute phase proteins in major depression. J. Psychosom. Res. 43:529-534. [DOI] [PubMed] [Google Scholar]
- 2.Buchwald, D., M. H. Wener, T. Pearlman, and P. Kith. 1997. Markers of inflammation and immune activation in chronic fatigue and chronic fatigue syndrome. J. Rheumatol. 24:372-376. [PubMed] [Google Scholar]
- 3.Castell, J. V., M. J. Gomez-Lechon, M. David, R. Fabra, R. Trullenque, and P. C. Heinrich. 1990. Acute-phase response of human hepatocytes: regulation of acute-phase protein synthesis by interleukin-6. Hepatology 12:1179-1186. [DOI] [PubMed] [Google Scholar]
- 4.Cengiz, M., S. Akbulut, I. L. Atahan, and P. W. Grigsby. 2001. Acute phase response during radiotherapy. Int. J. Radiat. Oncol. Biol. Phys. 49:1093-1096. [DOI] [PubMed] [Google Scholar]
- 5.De, B. K., L. G. Smith, W. E. Owen, and W. L. Roberts. 2002. Performance characteristics of an automated high-sensitivity C-reactive protein assay on the Dimension RxL analyzer. Clin. Chim. Acta 323:151-155. [DOI] [PubMed] [Google Scholar]
- 6.Eda, S., J. Kaufmann, W. Roos, and S. Pohl. 1998. Development of a new microparticle-enhanced turbidimetric assay for C-reactive protein with superior features in analytical sensitivity and dynamic range. J. Clin. Lab. Anal. 12:137-144. [DOI] [PMC free article] [PubMed] [Google Scholar]
- 7.Engelhardt, T., and B. H. Cuthbertson. 2001. Markers of myocardial damage and inflammation in unstable coronary artery disease. N. Engl. J. Med. 344:688-689. [DOI] [PubMed] [Google Scholar]
- 8.Erlandsen, E. J., and E. Randers. 2000. Reference interval for serum C-reactive protein in healthy blood donors using the Dade Behring N Latex CRP mono assay. Scand. J. Clin. Lab. Investig. 60:37-43. [DOI] [PubMed] [Google Scholar]
- 9.Folsom, A. R., N. Aleksic, D. Catellier, H. S. Juneja, and K. K Wu. 2002. C-reactive protein and incident coronary heart disease in the Atherosclerosis Risk In Communities (ARIC) study. Am. Heart J. 144:233-238. [DOI] [PubMed] [Google Scholar]
- 10.Gotschlich, E. C., and G. M. Edelman. 1965. C-reactive protein: a molecule composed of subunits. Proc. Natl. Acad. Sci. USA 54:558-566. [DOI] [PMC free article] [PubMed] [Google Scholar]
- 11.Griselli, M., J. Herbert, W. L. Hutchinson, K. M. Taylor, M. Sohail, T. Krausz, and M. B. Pepys. 1999. C-reactive protein and complement are important mediators of tissue damage in acute myocardial infarction. J. Exp. Med. 190:1733-1740. [DOI] [PMC free article] [PubMed] [Google Scholar]
- 12.Heilbronn, L. K., and P. M. Clifton. 2002. C-reactive protein and coronary artery disease: influence of obesity, caloric restriction and weight loss. J. Nutr. Biochem. 13:316-321. [DOI] [PubMed] [Google Scholar]
- 13.Heinrich, P. C., J. V. Castell, and T. Andus. 1990. Interleukin-6 and the acute phase response. Biochem. J. 265:621-636. [DOI] [PMC free article] [PubMed] [Google Scholar]
- 14.Keevil, B. G., S. P. Nicholls, and E. S. Kilpatrick. 1998. Evaluation of a latex-enhanced immunoturbidimetric assay for measuring low concentrations of C-reactive protein. Ann. Clin. Biochem. 35:671-673. [DOI] [PubMed] [Google Scholar]
- 15.Kushner, I. 2001. C-reactive protein elevation can be caused by conditions other than inflammation and may reflect biologic aging. Cleve. Clin. J. Med. 68:535-537. [DOI] [PubMed] [Google Scholar]
- 16.Lindahl, B., H. Toss, A. Siegbahn, P. Venge, L. Wallentin, et al. 2000. Markers of myocardial damage and inflammation in relation to long-term mortality in unstable coronary artery disease. Fragmin during instability in coronary artery disease. N. Engl. J. Med. 343:1139-1147. [DOI] [PubMed] [Google Scholar]
- 17.Liuzzo, G., L. M. Biasucci, J. R. Gallimore, R. L. Grillo, A. G. Rebuzzi, M. B. Pepys, and A. Maseri. 1994. The prognostic value of C-reactive protein and serum amyloid a protein in severe unstable angina. N. Engl. J. Med. 331:417-424. [DOI] [PubMed] [Google Scholar]
- 18.MacLeod, C. M., and O. T. Avery. 1941. The occurrence during acute infection of a protein not normally present in blood. I. Distribution of the reactive protein in patients' sera and effect of calcium on the flocculation reaction with C polysaccharide of pneumococcus. J. Exp. Med. 73:183-187. [DOI] [PMC free article] [PubMed] [Google Scholar]
- 19.Macy, E. M., T. E. Hayes, and R. P. Tracy. 1997. Variability in the measurement of C-reactive protein in healthy subjects: implications for reference intervals and epidemiological applications. Clin. Chem. 43:52-58. [PubMed] [Google Scholar]
- 20.Morrow, D. A., and P. M. Ridker. 2000. C-reactive protein, inflammation, and coronary risk. Med. Clin. North Am. 84:149-161. [DOI] [PubMed] [Google Scholar]
- 21.Ockene, I. S., C. E. Matthews, N. Rifai, P. M. Ridker, G. Reed, and E. Stanek. 2001. Variability and classification accuracy of serial high-sensitivity C-reactive protein measurements in healthy adults. Clin. Chem. 47:444-450. [PubMed] [Google Scholar]
- 22.Patti, G., G. Di Sciascio, A. D'Ambrosio, G. Dicuonzo, A. Abbate, and A. Dobrina. 2002. Inflammatory markers and coronary interventions: a potentially useful follow-up modality after stenting. Catheter Cardiovasc. Interv. 56:341-345. [DOI] [PubMed] [Google Scholar]
- 23.Pepys, M. B., and M. L. Baltz. 1983. Acute phase proteins with special reference to C-reactive protein and related proteins (pentaxins) and serum amyloid A protein. Adv. Immunol. 34:141-212. [DOI] [PubMed] [Google Scholar]
- 24.Ridker, P. M. 2001. High-sensitivity C-reactive protein: potential adjunct for global risk assessment in the primary prevention of cardiovascular disease. Circulation 103:1813-1818. [DOI] [PubMed] [Google Scholar]
- 25.Ridker, P. M., M. Cushman, M. J. Stampfer, R. P. Tracy, and C. H. Hennekens. 1997. Inflammation, aspirin, and the risk of cardiovascular disease in apparently healthy men. N. Engl. J. Med. 336:973-979. [DOI] [PubMed] [Google Scholar]
- 26.Riese, H., T. G. Vrijkotte, P. Meijer, C. Kluft, and E. J. De Geus. 2002. Diagnostic strategies for C-reactive protein. BMC Cardiovasc. Disord. 2:1471-2261. [DOI] [PMC free article] [PubMed] [Google Scholar]
- 27.Roberts, W. L., E. L. Schwarz, S. Ayanian, and N. Rifai. 2001. Performance characteristics of a point of care C-reactive protein assay. Clin. Chim. Acta 314:255-259. [DOI] [PubMed] [Google Scholar]
- 28.Rohde, L. E., C. H. Hennekens, and P. M. Ridker. 1999. Survey of C-reactive protein and cardiovascular risk factors in apparently healthy men. Am. J. Cardiol. 84:1018-1022. [DOI] [PubMed] [Google Scholar]
- 29.Smith, J. K., R. Dykes, J. E. Douglas, G. Krishnaswamy, and S. Berk. 1999. Long-term exercise and atherogenic activity of blood mononuclear cells in persons at risk of developing ischemic heart disease. JAMA 281:1722-1727. [DOI] [PubMed] [Google Scholar]
- 30.Speidl, W. S., S. Graf, S. Hornykewycz, M. Nikfardjam, A. Niessner, G. Zorn, J. Wojta, and K. Huber. 2002. High-sensitivity C-reactive protein in the prediction of coronary events in patients with premature coronary artery disease. Am. Heart J. 144:449-455. [DOI] [PubMed] [Google Scholar]
- 31.Their, M., K. Ronnholm, H. Sairanen, C. Holmberg, and H. Jalanko. 2002. Serum C-reactive protein in pediatric kidney and liver transplant patients. Pediatr. Transplant. 6:153-160. [DOI] [PubMed] [Google Scholar]
- 32.Tillet, W. S., and T. Francis. 1930. Serological reactions in pneumonia with a non-protein somatic fraction of the Pneumococcus. J. Exp. Med. 52:561-571. [DOI] [PMC free article] [PubMed] [Google Scholar]
- 33.Tracy, R. P., B. M. Psaty, E. Macy, E. G. Bovill, M. Cushman, E. S. Cornell, and L. H. Kuller. 1997. Lifetime smoking exposure affects the association of C-reactive protein with cardiovascular disease risk factors and subclinical disease in healthy elderly subjects. Arterioscler. Thromb. Vasc. Biol. 17:2167-2176. [DOI] [PubMed] [Google Scholar]
- 34.Vgontzas, A. N., E. O. Bixler, D. A. Papanicolaou, and G. P. Chrousos. 2000. Chronic systemic inflammation in overweight and obese adults. JAMA 283:2235-2236. [DOI] [PubMed] [Google Scholar]
- 35.Vigushin, D. M., M. B. Pepys, and P. N. Hawkins. 1993. Metabolic and scintigraphic studies of radioiodinated human C-reactive protein in health and disease. J. Clin. Investig. 91:1351-1357. [DOI] [PMC free article] [PubMed] [Google Scholar]
- 36.Visser, M., L. M. Bouter, G. M. McQuillan, M. H. Wener, and T. B. Harris. 1999. Elevated C-reactive protein levels in overweight and obese adults. JAMA 82:2131-2135. [DOI] [PubMed] [Google Scholar]
- 37.Volanakis, J. E. 1982. Complement activation by C-reactive protein complexes. Ann. N. Y. Acad. Sci. 389:235-250. [DOI] [PubMed] [Google Scholar]
- 38.Volanakis, J. E. 2001. Human C-reactive protein: expression, structure, and function. Mol. Immunol. 38:189-197. [DOI] [PubMed] [Google Scholar]
- 39.Voller, A., A. Bartlett, and D. E. Bidwell. 1978. Enzyme immunoassays with special reference to ELISA techniques. J. Clin. Pathol. 31:507-520. [DOI] [PMC free article] [PubMed] [Google Scholar]
- 40.Wang, T. J., M. G. Larson, D. Levy, E. J. Benjamin, M. J. Kupka, W. J. Manning, M. E. Clouse, R. B. D'Agostino, P. W. Wilson, and C. J. O'Donnell. 2002. C-reactive protein is associated with subclinical epicardial coronary calcification in men and women: the Framingham Heart Study. Circulation 106:1189-1191. [DOI] [PubMed] [Google Scholar]
- 41.Whicher, J. T., C. P. Price, and K. Spencer. 1983. Immunonephelometric and immunoturbidimetric assay for proteins. Crit. Rev. Clin. Lab. Sci. 18:213-260. [DOI] [PubMed] [Google Scholar]
- 42.Wilkins, J., J. R. Gallimore, E. G. Moore, and M. B. Pepys. 1998. Rapid automated high sensitivity enzyme immunoassay of C-reactive protein. Clin. Chem. 44:1358-1361. [PubMed] [Google Scholar]
- 43.Wolbink, G. J., A. W. Bossink, A. B. Groeneveld, M. C. de Groot, L. G. Thijs, and C. E. Hack. 1998. Complement activation in patients with sepsis is in part mediated by C-reactive protein. J. Infect. Dis. 177:81-87. [DOI] [PubMed] [Google Scholar]
- 44.Wood, W. G., J. Ludemann, R. Mitusch, J. Heinrich, R. Maass, and U. Frick. 2000. Evaluation of a sensitive immunoluminometric assay for the determination of C-reactive protein (CRP) in serum and plasma and the establishment of reference ranges for different groups of subjects. Clin. Lab. 46:131-140. [PubMed] [Google Scholar]
- 45.Yamada, S., T. Gotoh, Y. Nakashima, K. Kayab, S. Ishikawa, N. Nago, Y. Nakamura, Y. Itoh, and E. Kajii. 2000. Distribution of serum C-reactive protein and its association with atherosclerotic risk factors in a Japanese population: Jichi Medical School Cohort Study. Am. J. Epidemiol. 153:1183-1190. [DOI] [PubMed] [Google Scholar]
- 46.Yu, H., and N. Rifai. 2000. High-sensitivity C-reactive protein and atherosclerosis: from theory to therapy. Clin. Biochem. 33:601-610. [DOI] [PubMed] [Google Scholar]
- 47.Yudkin, J. S., C. D. A. Stehouwer, J. J. Emeis, and S. W. Coppack. 1999. C-reactive protein in healthy subjects: associations with obesity, insulin resistance, and endothelial dysfunction: a potential role for cytokines originating from adipose tissue? Arterioscler. Thromb. Vasc. Biol. 19:972-978 [DOI] [PubMed] [Google Scholar]
- 48.Yue, C. C., J. Muller-Greven, P. Dailey, G. Lozanski, V. Anderson, and S. Macintyre. 1996. Identification of a C-reactive protein binding site in two hepatic carboxylesterases capable of retaining C-reactive protein within the endoplasmic reticulum. J. Biol. Chem. 271:2245-2250. [DOI] [PubMed] [Google Scholar]