Abstract
Much is known about specific antibodies and their titers in patients with tuberculosis. However, little is known about the avidity of these antibodies or whether changes in avidity occur during the progression of the disease or during treatment. The aims of this study were to determine the avidity of antibodies to Mycobacterium tuberculosis in patients with pulmonary tuberculosis, to explore the value of avidity determination for the diagnosis of tuberculosis, and to study changes in levels of antibodies and their avidity during treatment. Antibody avidity was measured by an enzyme-linked immunosorbent assay with thiocyanate elution. Avidity indices and serum levels of immunoglobulin G to M. tuberculosis were determined for 22 patients with pulmonary tuberculosis before and during treatment and for 24 patients with other pulmonary diseases. Antibody levels and avidity were both significantly higher in untreated tuberculosis patients than in the controls. Avidity determination had more diagnostic potential than determination of the antibody levels. Tuberculosis patients with a long duration of symptoms had higher antibody avidity than those with a recent onset of symptoms, indicating affinity maturation of specific antibodies during active disease. In the early phase of treatment, a decrease in antibody avidity was observed for 73% of all tuberculosis patients, accompanied by an initial increase in antibody levels in 36% of these patients. These phenomena could be explained by an intense stimulation of the humoral response by antigens released from killed bacteria, reflecting early bactericidal activity of antituberculous drugs leading to the production of low-affinity antibodies against these released antigens.
Cell-mediated immunity plays an important role in infection with Mycobacterium tuberculosis. T-cell effector mechanisms are used to control and eliminate this intracellular living pathogen. The role of humoral immunity in protection against tuberculosis (TB) was previously thought to be minimal, although recent studies suggest that B cells and antibodies may also contribute to the response to TB (3, 20).
Studies concerning humoral immunity in TB have mainly concentrated on the development of serological diagnostic tests (5). However, serious problems of sensitivity and specificity have been encountered, and the deployment of such tests for diagnostic purposes has been limited. Recently, Samanich and coworkers identified several M. tuberculosis antigens with strong serodiagnostic potential (17). An evaluation of a serological test based on three of these antigens revealed that, although significantly greater sensitivities were achieved with these antigens than with antigens studied by other investigators, even the reactivity obtained with all three proteins combined failed to diagnose ∼20% of the human immunodeficiency virus (HIV)-negative, smear-positive patients and ∼50% of the smear-negative patients (18). Nearly all published studies have focused on the determination of serum levels of specific anti-M. tuberculosis antibodies. Little is known about the avidity of these antibodies, how this may change during treatment, and whether avidity can be used to discriminate between persons with active disease and those with previous exposure.
Avidity, or functional affinity, indicates the relative average strength of the interactions between antibody binding sites and their antigenic determinants. As a rule, immunoglobulin G (IgG) avidity is initially low after primary antigenic challenge and increases during the following weeks and months. The antibodies produced in a secondary response have higher average avidity than those produced in the primary response. This maturation of affinity involves somatic hypermutations in antibody-forming cells and an antigen-driven selective expansion of high-affinity B-cell clones.
Many avidity tests have been introduced for a variety of (mostly viral) infectious agents (10). These avidity tests have significantly improved the serological diagnosis of, for example, rubella virus infection (9, 13, 15), cytomegalovirus infection (2), toxoplasmosis (16), and herpesvirus infection (23), enabling the differentiation of recent primary infection (low-avidity antibodies) from past infection or reactivation (high-avidity antibodies). Furthermore, antibody avidity is an important surrogate of protective efficacy for several vaccines (8).
The value of IgG avidity determination for the diagnosis of TB and for the prediction of treatment outcome is unknown. TB is a biphasic disease with a primary form and a postprimary form, usually separated by an interval of latency. Although most primary infections are asymptomatic, they can progress directly to caseation and cavitation if the local immunological response at the primary site does not arrest the infection. It is likely that individuals with postprimary TB will have antibodies with a higher avidity than those with primary TB. Exposure to environmental mycobacteria can also produce an immune response and will influence the avidity of antibodies which cross-react with M. tuberculosis.
The objectives of this study were threefold: (i) to determine the avidity of antibodies against M. tuberculosis, (ii) to explore the value of avidity determination for the diagnosis of TB, and (iii) to study changes in the levels of antibodies and their avidity during the treatment of TB.
MATERIALS AND METHODS
Patient sera.
Serum samples were obtained from 22 patients before and during treatment for pulmonary TB at The Pham Ngoc Thach Tuberculosis and Lung Diseases Center, Ho Chi Minh City, Vietnam. From the majority of the patients, two or three follow-up samples were obtained during the treatment period. The diagnosis was confirmed by a positive culture for M. tuberculosis in 17 patients (77%), 13 of whom had smear-positive sputum samples. In five patients (23%), both microscopy and culturing were negative, and diagnosis was based on a combination of the clinical history, chest X-ray abnormalities, and a positive skin test reaction. All patients were treated for 8 months and responded well to the treatment. All of them were HIV seronegative and had no history of previous TB.
Serum samples were also obtained at the same center from 24 hospitalized patients with pulmonary diseases other than TB. They suffered from chronic obstructive pulmonary disease (n = 7), pneumonia (n = 8), or pulmonary malignancy (n = 9). For 16 patients, a purified protein derivative (PPD) skin test was performed, and 8 of them were found positive. All patients were HIV seronegative, and two patients had suffered from TB 15 to 20 years ago.
The study protocol was approved by the Ethics Committee of The Pham Ngoc Thach Tuberculosis and Lung Diseases Center. All patients gave permission for blood sampling.
Preparation of the M. tuberculosis antigen termed Ag 360.
We used as a source of M. tuberculosis antigens a Triton X-100 extract of M. tuberculosis (strain 1) (21) grown for 3 weeks at 37°C in a protein-free medium. One hundred milliliters of 0.5% Triton X-100 in 10 mM Tris-HCl (pH 8) (extraction buffer) was added to 75 g (wet weight) of M. tuberculosis bacteria. The bacteria were killed by heating the suspension at 56°C for 1 h. Then, the extract was placed on ice and sonicated (model 250 Sonifier; Branson Ultrasonics Corporation, Danbury, Conn.) twice each for 15 min at 4°C. After centrifugation of the sonicate for 30 min at 48,384 × g and 4°C, the supernatant was decanted and stored at 4°C. The pellet was resuspended in 100 ml of extraction buffer, and the extraction procedure was repeated twice as described above. The three supernatants were combined and centrifuged for 1 h at 99,600 × g and 4°C. The supernatant was applied to a detergent removal column (1-ml ExtractiGel D column; Pierce, Rockford, Ill.) to remove the Triton X-100. The protein concentration was measured by using bicinchoninic acid protein assay reagent (Pierce). The solution was stored in aliquots at −70°C.
ELISA.
Anti-M. tuberculosis IgG antibodies were detected by an enzyme-linked immunosorbent assay (ELISA). Polystyrene flat-bottom microtiter plates (high binding; Greiner Labortechnik, Nürtingen, Germany) were coated with Ag 360 (manufactured as described above) at a concentration of 5 μg of protein per ml in phosphate-buffered saline (pH 8.0). The plates were incubated overnight at 37°C in a water bath and washed three times with washing buffer, containing 0.15 M NaCl, 1.2 mM KH2PO4, 4.8 mM Na2HPO4, and 0.05% (wt/vol) Tween 80 (pH 7.3). After blocking of the plates for 1 h at room temperature (20°C) with 1% bovine serum albumin in phosphate-buffered saline (pH 8.0) (150 μl/well), the plates were washed again three times; then, 100 μl of serum (diluted 1:5,000 in dilution buffer, containing 0.1 M Tris, 0.15 M NaCl, 1% bovine serum albumin, and 0.05% Tween 80 [pH 8.0]) was added to each well. All samples were tested in duplicate. The plates were incubated for 1 h at 37°C in a water bath and washed five times. After the elution procedure (see below), the wells were filled with 100 μl of a 1:80,000 dilution of peroxidase-labeled goat anti-human IgG (Fcγ fragment specific; Jackson ImmunoResearch Laboratories, West Grove, Pa.). The plates were incubated for 1 h at 37°C in a water bath and washed again five times; then, 100 μl of tetramethylbenzidine substrate solution (0.04% tetramethylbenzidine and 0.04% urea-peroxide in 0.1 M sodium acetate-citric acid buffer [pH 4.0]) was added. After 30 min of incubation in the dark at room temperature, the A630 was measured with a microtiter plate reader (Bio-kinetics Reader; Bio-tec Instruments, Winooski, Vt.). The reaction was stopped by the addition of 100 μl of 0.5 M H2SO4 to each well, and the A450 was measured. By measuring at two wavelengths (630 and 450 nm), we were able to increase the detection range of the ELISA (14). High concentrations of anti-Ag 360 IgG could be detected by measuring the A630, and low concentrations could be detected by measuring the A450. The A450/A630 ratio was 3. Values below 1.0 at 630 nm were measured at 450 nm after the addition of acid (resulting in a clear yellow solution). Values between 1.0 and 4.0 at 630 nm were multiplied by the factor 3 to change these to 450-nm values (the addition of acid resulted in a brown product which precipitated; A630 values above 4 were out of range [too high]). To control for the background reaction (conjugate control), four wells were filled with sample dilution fluid. The final results were expressed as the mean A450 of the duplicates, after subtraction of the background A450.
Elution procedure.
Ammonium thiocyanate (NH4SCN) elution was performed essentially as described by Pullen and coworkers (15). After antibody incubation, NH4SCN in 0.1 M sodium phosphate (pH 6.0) was added to the appropriate duplicate wells (150 μl/well) at the following molarities: 5.00 M, 2.50 M, 1.25 M, 625 mM, 312.50 mM, 156.25 mM, 78.12 mM, 39.06 mM, and 19.53 mM. Control wells were incubated with 0.1 M sodium phosphate (pH 6.0) without NH4SCN. With this range of NH4SCN concentrations, we followed the simple method described by Ferreira and Katzin for assessment of the antibody affinity distribution by using a graphic presentation with an NH4SCN logarithmic scale (7) (see below). The plates were incubated at room temperature for 15 min prior to washing and addition of the conjugate.
Calculation of the avidity index.
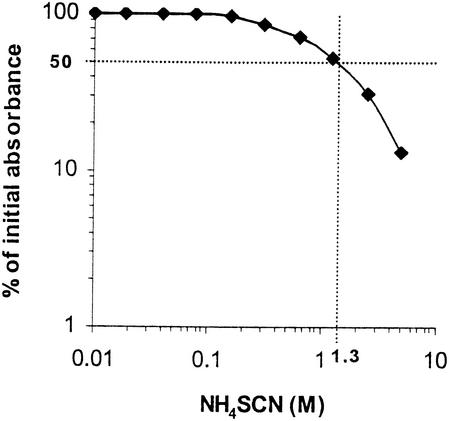
Absorbance readings in the presence of increasing concentrations of NH4SCN were converted to the appropriate percentage of total bound antibody (absorbance readings in the absence of NH4SCN). The data were fitted to a graph representing on the y axis the percentage of the initial absorbance and on the x axis the molar concentration of NH4SCN (Fig. 1). For each sample, the avidity index was estimated (7, 12) as the molar concentration of thiocyanate required to reduce the initial absorbance by 50%.
FIG. 1.
Estimation of the avidity index. The percentage of the initial absorbance (A450 in NH4SCN-free wells) is given on the y axis (log scale), and the molar concentration of NH4SCN is given on the x axis (log scale). Ag 360-specific antibodies in the serum of a TB patient were eluted with increasing concentrations of NH4SCN. The avidity index was estimated as the molar concentration of thiocyanate required to reduce the initial absorbance by 50%. From the data it can be concluded that the avidity index in this patient was 1.3.
Avidity distribution histograms.
Avidity distribution histograms were constructed by the method described by Ferreira and Katzin (7). The serum dilution used in the ELISA (1:5,000) was carefully chosen at a point at which the absorbance values were linearly proportional to the antibody concentrations, as determined by serial dilutions of human sera. The antibody content in control (NH4SCN-free) wells was considered to represent the total concentration of anti-M. tuberculosis IgG antibodies. The antibody contents in wells incubated with different concentrations of NH4SCN were expressed as proportions of this total. Affinity distribution histograms represent the different antibody subpopulations in relation to their tolerance to NH4SCN elution.
Statistical analysis.
The Mann-Whitney U test was used to compare sets of analyses; a P value of <0.05 was considered significant. The median value and interquartile range are given. The relationship between variables was analyzed by calculating the Spearman correlation coefficient (r). Receiver operating characteristic (ROC) curves were constructed to describe the relationship between sensitivity and specificity at various cutoff levels (1).
RESULTS
Serum anti-M. tuberculosis IgG levels.
The 22 pulmonary TB patients had significantly higher levels of IgG to M. tuberculosis (A450, 4.65 [3.13 to 6.50]) than the 24 patients with other pulmonary diseases (non-TB patients; A450, 2.99 [2.32 to 3.92]) (P = 0.02), although there was overlap between the groups (Fig. 2). In non-TB patients, no significant difference (P = 0.3) in antibody levels was found between the eight PPD-positive subjects (A450, 2.99 [2.49 to 3.14]) and the eight PPD-negative subjects (A450, 3.90 [2.54 to 4.24]).
FIG. 2.
Levels of anti-M. tuberculosis IgG antibodies in serum from untreated patients with pulmonary TB and patients with other pulmonary diseases. The level of antibody to Ag 360 is given on the y axis, expressed as the A450 (high values were converted from A630 results; see Materials and Methods). Closed circles represent individual TB patients, and open circles represent negative controls. Horizontal bars represent the median antibody levels in the groups; vertical error bars show the interquartile range. Antibody levels in untreated TB patients were significantly higher than those in patients with other pulmonary diseases (P = 0.02).
IgG avidity.
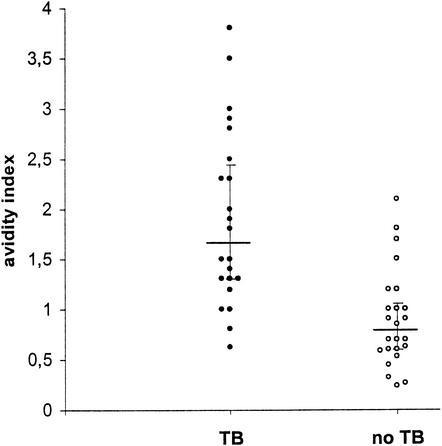
Significant differences in IgG avidity were found between TB patients and patients with other pulmonary diseases (Fig. 3). IgG antibodies to M. tuberculosis had a clearly higher average avidity in TB patients (avidity index, 1.65 [1.30 to 2.45]) than in non-TB patients (avidity index, 0.78 [0.60 to 1.05]) (P < 0.001). No difference in average IgG avidity was found between PPD-positive control patients (avidity index, 0.70 [0.60 to 1.05]) and PPD-negative control patients (avidity index, 0.90 [0.51 to 1.05]) (data not shown). Both control patients with a previous history of TB had low avidity indices (0.85 and 0.7).
FIG. 3.
Average avidity of anti-M. tuberculosis IgG antibodies in untreated patients with pulmonary TB and patients with other pulmonary diseases. Closed circles represent individual TB patients, and open circles represent negative controls. Horizontal bars represent the median avidity indices in the groups; vertical error bars show the interquartile range. Antibody avidity indices in TB patients were significantly higher than those in patients with other pulmonary diseases (P < 0.001).
IgG avidity maturation in TB patients.
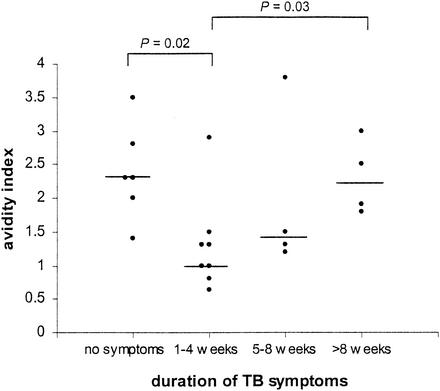
We found significant differences in average IgG avidity in relation to the duration of TB symptoms before diagnosis (Fig. 4). A significantly higher IgG avidity was observed in TB patients having symptoms for more than 2 months (avidity index, 2.2) than in TB patients having symptoms for 1 to 4 weeks (avidity index, 1.0) (P = 0.03). These results suggest that the affinity of IgG antibodies for M. tuberculosis matures during active disease. Asymptomatic patients (in whom TB was diagnosed based on chest X-ray abnormalities and a positive skin test reaction during a yearly checkup [n = 3]) and patients in whom TB was diagnosed after a single episode of severe hemoptysis (n = 3) had a significantly higher IgG avidity (avidity index, 2.3) than TB patients with symptoms lasting for 1 to 4 weeks (P = 0.02).
FIG. 4.
Average avidity of anti-M. tuberculosis IgG antibodies in untreated patients with pulmonary TB in relation to the duration of their TB symptoms. The x axis represents the duration of TB symptoms until the day on which the pretreatment serum sample was collected. In the asymptomatic patient group, three patients presented with a single episode of severe hemoptysis and signs of TB on the same day on which the serum sample was obtained. Circles represent individual TB patients in each group. Horizontal bars indicate median values for the groups. Statistically significant differences between groups are indicated.
Independence of antibody levels and avidity.
To establish whether there was a relationship between the avidity index and antibody levels, the avidity indices of TB patients and patients with other diseases were plotted against the serum anti-M. tuberculosis IgG levels in these patients. However, no correlation was found between the parameters in either patient group (r= 0.04 in TB patients; r=0.21 in patients with other diseases) (data not shown). Thus, avidity was not dependent on the levels of antibodies present.
Diagnostic value of serum anti-M. tuberculosis IgG levels and/or IgG avidity.
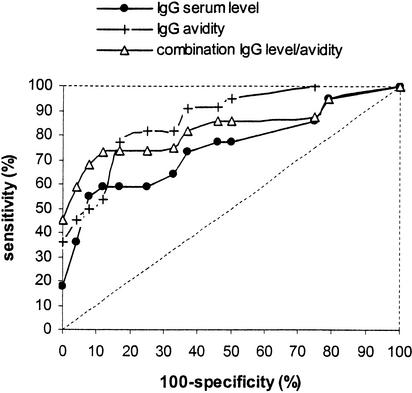
ROC curves were constructed based on the levels of IgG antibodies to M. tuberculosis, the avidity of these specific IgG antibodies, and a combination of both parameters (Fig. 5). Sensitivity was based on results obtained with all pretreatment samples from TB patients. Specificity was calculated from results obtained with all samples from patients with diseases other than TB. Since the area under the ROC curve is directly correlated to the overall diagnostic value of the assay, one can conclude that a test based on IgG avidity or a combination of IgG levels and IgG avidity has more diagnostic value than a test based on IgG levels alone. Although there were too few patients to obtain reliable sensitivity and specificity values (wide confidence intervals) (Table 1), the highest specificity and sensitivity values in this study population were obtained with a test based on a combination of the levels and the avidity of the IgG antibodies (Table 1).
FIG. 5.
ROC curves based on serum levels of anti-M. tuberculosis IgG antibodies, IgG avidity, or a combination of both. The broken line represents the ROC curve of a hypothetical test completely lacking diagnostic value. A test based on IgG avidity or a combination of IgG levels and IgG avidity had more diagnostic value than a test based on IgG levels alone.
TABLE 1.
Sensitivity and specificity values at various arbitrarily chosen cut off points for various testsa
| IgG parameter | Cutoff point for IgG
|
Test performance
|
||||
|---|---|---|---|---|---|---|
| Level in serum | Avidity | % Sensitivity | (95% CI) | % Specificity | (95% CI) | |
| Level in serum | 7.6 | 18 | (2-34) | 100 | ||
| 5.8 | 36 | (16-56) | 96 | (88-100) | ||
| 4.5 | 55 | (34-76) | 92 | (81-100) | ||
| Avidity | 2.2 | 36 | (16-56) | 100 | ||
| 1.9 | 45 | (24-66) | 96 | (88-100) | ||
| 1.8 | 50 | (29-71) | 92 | (81-100) | ||
| Level in serum plus avidity | 7.6 | 2.2 | 45 | (24-66) | 100 | |
| 5.8 | 2.2 | 59 | (38-80) | 96 | (88-100) | |
| 4.5 | 2.2 | 68 | (49-87) | 92 | (81-100) | |
IgG level in serum is the ELISA A450; CI, confidence interval.
Antibody levels and avidity during treatment.
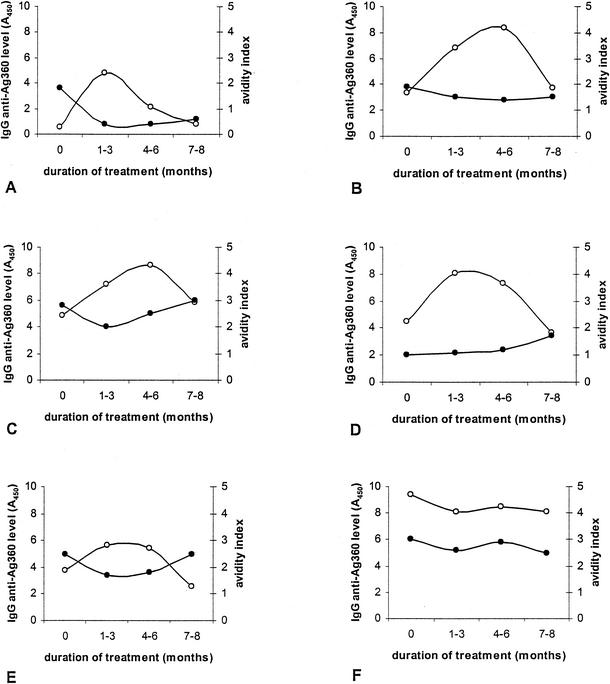
Serum samples were obtained from all TB patients at various times during treatment. Serum anti-M. tuberculosis IgG levels and IgG avidity indices were measured in pretreatment samples and all follow-up samples. Results for six patients representing the different patterns seen are shown in Fig. 6. For all six patients, microscopy and culture results were negative within 2 months of treatment. Although no single pattern could be detected when we examined antibody levels or avidity during treatment, several phenomena were observed in the majority of patients. In 59% of the patients, there was an initial increase in antibody levels in the first 3 months of therapy, and in 90% of these patients, the antibody levels had decreased again to the pretreatment levels by the end of treatment (Fig. 6). We observed a striking decrease in antibody avidity after the start of anti-TB treatment in 73% of the patients (Fig. 6). At the end of treatment, the antibody avidity had returned to the pretreatment level in 46% of these patients, the antibody avidity remained lower than that before therapy in 46% of these patients, and the antibody avidity was higher after treatment than before treatment in 8% of these patients. In 36% of the patients, the initial decrease in antibody avidity was accompanied by an initial increase in antibody levels.
FIG. 6.
Changes in specific antibody levels and avidity during treatment of six patients (A to F) with smear-positive pulmonary TB. The x axis is divided into four time periods: the pretreatment period and three periods during anti-TB therapy. Closed circles represent antibody avidity; open circles represent antibody levels.
For most patients in this study, who all came from Vietnam, the first sample obtained during treatment was obtained 2 to 3 months after treatment was begun. From recent observations in Dutch TB patients, we have obtained evidence that the initial decrease in antibody avidity occurs at a very early stage of treatment (approximately 2 weeks after the beginning of treatment) (data not shown).
Antibody avidity heterogeneity.
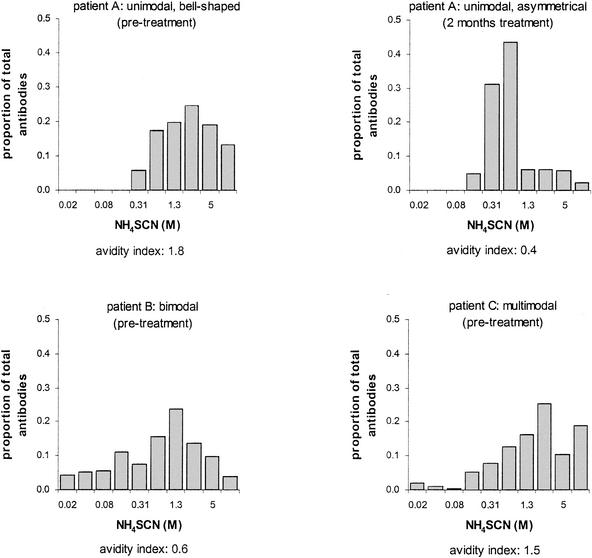
Before treatment, avidity distributions for 50% of the TB patients were unimodal (bell shaped or asymmetrical) (Fig. 7, patient A). Nine patients (41%) had bimodal avidity distributions (Fig. 7, patient B), and two patients (9%) had multimodal distributions (Fig. 7, patient C). In most of the patients (68%), similar patterns were also observed after anti-TB treatment. An evident shift to the left was observed in the avidity distribution histogram for the patient in whom the avidity index dropped markedly during therapy (Fig. 7, patient A, right graph).
FIG. 7.
Avidity distribution histograms for three TB patients. The y axis represents the eluted proportion of total antibodies. The x axis represents the NH4SCN concentration (twofold concentration series). Each bar represents the proportion of anti-M. tuberculosis antibodies eluted at a given concentration of NH4SCN. The avidity index is given below each graph. Patient A showed a unimodal avidity distribution histogram both before and during treatment. An evident shift to the left in the histogram was observed during therapy. Patients B and C showed bimodal and multimodal distribution histograms, respectively.
Avidity distribution histograms for patients with other pulmonary diseases were bimodal in 42%, unimodal in 29%, and multimodal in 29% (data not shown). Seven of the eight PPD-positive subjects had either bimodal or multimodal avidity distributions. Both patients with a history of TB had multimodal distributions.
DISCUSSION
This is the first study focusing on the kinetics of the avidity and levels in serum of anti-M. tuberculosis IgG antibodies in patients with pulmonary TB and undergoing treatment.
In our study, both the levels in serum and the avidity of these antibodies were significantly higher in untreated pulmonary TB patients than in patients with other pulmonary diseases. However, no relationship was found between the levels of circulating antibodies against M. tuberculosis and the avidity of the antibodies. This result is in agreement with the observations of Pullen and colleagues for patients with rubella infection, suggesting that antibody affinity is controlled by mechanisms independent of those regulating antibody levels (15).
For our Vietnamese study group, avidity determination had more diagnostic potential than measurement of serum levels alone. Especially in the desired specificity range of 90 to 100%, sensitivity could be improved to 45 to 68% by combining antibody levels and antibody avidity (Fig. 5 and Table 1). Although these sensitivity values seem to be lower than those achieved with other serological tests (5, 18), it should be noted that >40% of the TB patients in our study population had negative sputum smears. The study population was mixed, consisting of smear-positive, culture-positive patients, smear-negative, culture-positive patients, and smear-negative, culture-negative patients. This means that the TB patient group was not biased for easy-to-diagnose patients. No significant difference was observed for antibody levels and antibody avidity in smear-positive TB patients versus smear-negative TB patients (data not shown).
PPD-positive individuals have active cellular immunity directed against M. tuberculosis. However, no differences in IgG antibody levels or avidity were found between PPD-positive and PPD-negative subjects with diseases other than TB. Thus, there was no correlation between PPD status and antibody levels or avidity. In contrast, the development of active disease seems to be an important trigger for affinity maturation of specific antibodies. In support of this notion, patients with long-lasting symptoms clearly had a higher antibody avidity than patients with symptoms lasting for less than 4 weeks.
We found a relatively high avidity of specific antibodies in “asymptomatic” TB patients (including patients admitted to the hospital because of a single episode of severe hemoptysis). It is known that the duration of TB symptoms may bear little relationship to the length of time for which the patient has harbored active disease. This situation is particularly true when severe hemoptysis is the presenting symptom, when it reflects considerable destruction of lung parenchyma already as a result of the infection. Persons diagnosed at an annual checkup had visible changes on chest radiographs reflecting a considerable disease burden. It is possible, however, that the average antibody avidity decreases at a certain point during active disease because of the production of low-affinity antibodies to antigens newly released from areas of tissue destruction. In support of this notion, others have found that the repertoire of antigens recognized by antibodies from TB patients seems to change with disease progression (4, 17).
Interestingly, in the majority of TB patients, a decrease in IgG avidity was observed during the first half of anti-TB treatment. In more than one-third of these patients, this decrease in IgG avidity was accompanied by an initial increase in antibody levels. This initial increase in antibody levels in the first months of treatment has also been observed by others (6, 11, 22). Indeed, increasing numbers of specific circulating antibody-secreting cells have been noted (19). This discordance of increasing levels of specific antibodies with poorer avidity of these antibodies could be explained by intense stimulation of the humoral response by (intracellular) antigens released from killed bacteria, reflecting early bactericidal activity of anti-TB drugs leading to the production of (low-affinity) antibodies against these released antigens. Removal of the immunosuppresive effect of actively growing mycobacteria may contribute to the increased activity of the humoral response during the first weeks of treatment. A bactericidal drug such as isoniazid can kill the majority of the extracellular bacillary population during the first few days of chemotherapy. Recent data showed that the decrease in avidity seems to start very early after the commencement of treatment (between 1 and 2 weeks) (data not shown). During successful treatment, especially in the first few days, many mycobacteria are killed, leading to increased amounts of free antigens in the circulation. High-affinity antibodies could bind to these, leading to immune complex formation. This scenario would lead to a decrease in circulating antibody levels and to a decrease in the average avidity of the remaining antibodies. This notion is supported by the findings of Sousa and colleagues (19), who noted an early increase in the levels of circulating immune complexes and a modest decrease in the levels of circulating free antibodies to M. tuberculosis during the first 2 weeks of therapy.
The avidity index used in this study is a measure of the average avidity of specific polyclonal serum antibodies comprising a complex mixture of antibody subpopulations with different avidities. Since antibody populations with the same average avidity may differ with respect to the avidity distribution, we constructed avidity distribution histograms to gain insight into avidity heterogeneity in TB patients. Ferreira and Katzin (7) studied avidity distributions in acute- and convalescent-phase serum samples from patients with malaria. The majority of their patients showed equal avidity distributions during acute-phase infection and convalescence. Two-thirds of their patients showed unimodal and nearly symmetrical (bell-shaped) avidity distributions in the acute phase, and one-third showed bimodal or multimodal distributions (7).
Similarly, the majority of pulmonary TB patients in our study showed equal avidity distributions before and after treatment, and the unimodal avidity distribution again dominated in these patients. Multimodal avidity distributions were found only in the minority of TB patients. In contrast, in patients with other pulmonary diseases, the multimodal avidity distribution occurred as frequently as the unimodal distribution, suggesting greater avidity heterogeneity in these patients.
Our results suggest that in Vietnamese patients, avidity determination has more diagnostic value than measurement of the serum levels of antibodies alone, since there was a decrease in avidity in 73% of the 22 patients with active TB, whereas antibody levels increased in only 36% of these patients. The TB patients had a higher avidity index than the non-TB patients, but the numbers in each group were small.
One should keep in mind that our results cannot be simply extrapolated to other populations. A variety of factors can influence outcome, such as racial differences, geographic differences (e.g., low or high TB prevalence, exposure to environmental mycobacteria), and the duration of active disease.
We are now studying the avidity of anti-M. tuberculosis antibodies in TB patients at fixed times during treatment, with special attention to early changes in the first weeks of therapy. We are investigating whether changes in avidity at an early stage can predict successful treatment.
Acknowledgments
The Amsterdam Society and Research Fund for Prevention and Cure of Tuberculosis and the Scientific Research for the Tropics (WOTRO) fund of Nederlandse Organisatie voor Wetenschappelijk Onderzoek (NWO) financially supported this study.
REFERENCES
- 1.Altman, D. G. 1993. Practical statistics for medical research, p. 418. Chapman & Hall, Ltd., London, England.
- 2.Baccard-Longere, M., F. Freymuth, D. Cointe, J. M. Seigneurin, and L. Grangeot-Keros. 2001. Multicenter evaluation of a rapid and convenient method for determination of cytomegalovirus immunoglobulin G avidity. Clin. Diagn. Lab. Immunol. 8:429-431. [DOI] [PMC free article] [PubMed] [Google Scholar]
- 3.Bosio, C. M., D. Gardner, and K. L. Elkins. 2000. Infection of B cell deficient mice with CDC1551, a clinical isolate of Mycobacterium tuberculosis: delay in dissemination and development of lung pathology. J. Immunol. 164:6417-6425. [DOI] [PubMed] [Google Scholar]
- 4.Bothamley, G. H., R. Rudd, F. Festenstein, and J. Ivanyi. 1992. Clinical value of the measurement of Mycobacterium tuberculosis specific antibody in pulmonary tuberculosis. Thorax 47:270-275. [DOI] [PMC free article] [PubMed] [Google Scholar]
- 5.Bothamley, G. H. 1995. Serological diagnosis of tuberculosis. Eur. Respir. J. Suppl. 20:676s-688s. [PubMed]
- 6.Drowart, A., K. Huygen, J. De Bruyn, J. C. Yernault, C. M. Farber, and J. P. Van Vooren. 1991. Antibody levels to whole culture filtrate antigens and to purified P32 during treatment of smear-positive tuberculosis. Chest 100:685-687. [DOI] [PubMed] [Google Scholar]
- 7.Ferreira, M. U., and A. M. Katzin. 1995. The assessment of antibody affinity distribution by thiocyanate elution: a simple dose-response approach. J. Immunol. Methods 187:297-305. [DOI] [PubMed] [Google Scholar]
- 8.Goldblatt, D., A. R. Vaz, and E. Miller. 1998. Antibody avidity as a surrogate marker of successful priming by Haemophilus influenzae type b conjugate vaccines following infant immunization. J. Infect. Dis. 177:1112-1115. [DOI] [PubMed] [Google Scholar]
- 9.Hedman, K., and S. A. Rousseau. 1989. Measurement of avidity of specific IgG for verification of recent primary rubella. J. Med. Virol. 27:288-292. [DOI] [PubMed] [Google Scholar]
- 10.Hedman, K., M. Lappalainen, M. Söderlund, and L. Hedman. 1993. Avidity of IgG in serodiagnosis of infectious dieases. Rev. Med. Microbiol. 4:123-129. [Google Scholar]
- 11.Imaz, M. S., and E. Zerbini. 2000. Antibody response to culture filtrate antigens of Mycobacterium tuberculosis during and after treatment of tuberculosis patients. Int. J. Tuberc. Lung Dis. 4:562-569. [PubMed] [Google Scholar]
- 12.Macdonald, R. A., C. S. Hosking, and C. L. Jones. 1988. The measurement of relative antibody affinity by ELISA using thiocyanate elution. J. Immunol. Methods 106:191-194. [DOI] [PubMed] [Google Scholar]
- 13.Nedeljkovic, J., T. Jovanovic, and C. Oker-Blom. 2001. Maturation of IgG avidity to individual rubella virus structural proteins. J. Clin. Virol. 22:47-54. [DOI] [PubMed] [Google Scholar]
- 14.Pereira Arias-Bouda, L. M., L. N. Nguyen, L. M. Ho, S. Kuijper, H. M. Jansen, and A. H. J. Kolk. 2000. Development of an antigen detection assay for the diagnosis of tuberculosis using sputum samples. J. Clin. Microbiol. 38:2278-2283. [DOI] [PMC free article] [PubMed] [Google Scholar]
- 15.Pullen, G. R., M. G. Fitzgerald, and C. S. Hosking. 1986. Antibody avidity determination by ELISA using thiocyanate elution. J. Immunol. Methods 86:83-87. [DOI] [PubMed] [Google Scholar]
- 16.Rossi, C. 1998. A simple, rapid enzyme-linked immunosorbent assay for evaluating immunoglobulin G antibody avidity in toxoplasmosis. Diagn. Microbiol. Infect. Dis. 30:25-30. [DOI] [PubMed] [Google Scholar]
- 17.Samanich, K. M., J. T. Belisle, M. G. Sonnenberg, M. A. Keen, S. Zolla-Pazner, and S. Laal. 1998. Delineation of human antibody responses to culture filtrate antigens of Mycobacterium tuberculosis. J. Infect. Dis. 178:1534-1538. [DOI] [PubMed] [Google Scholar]
- 18.Samanich, K. M., M. A. Keen, V. D. Vissa, J. D. Harder, J. S. Spencer, J. T. Belisle, S. Zolla-Pazner, and S. Laal. 2000. Serodiagnostic potential of culture filtrate antigens of Mycobacterium tuberculosis. Clin. Diagn. Lab. Immunol. 7:662-668. [DOI] [PMC free article] [PubMed] [Google Scholar]
- 19.Sousa, A. O., A. Wargnier, Y. Poinsignon, N. Simonney, F. Gerber, F. Lavergne, J. L. Herrmann, and P. H. Lagrange. 2000. Kinetics of circulating antibodies, immune complex and specific antibody-secreting cells in tuberculosis patients during 6 months of antimicrobial therapy. Tuber. Lung Dis. 80:27-33. [DOI] [PubMed] [Google Scholar]
- 20.Teitelbaum, R., A. Glatman-Freedman, B. Chen, J. B. Robbins, E. Unanue, A. Casadevall, and B. R. Bloom. 1998. A MAb recognizing a surface antigen of Mycobacterium tuberculosis enhances host survival. Proc. Natl. Acad. Sci. USA 95:15688-15693. [DOI] [PMC free article] [PubMed] [Google Scholar]
- 21.Verbon, A., S. Kuijper, H. M. Jansen, P. Speelman, and A. H. J. Kolk. 1990. Antigens in culture supernatant of Mycobacterium tuberculosis: epitopes defined by monoclonal and human antibodies. J. Gen. Microbiol. 136:955-964. [DOI] [PubMed] [Google Scholar]
- 22.Verbon, A., G. J. Weverling, S. Kuijper, P. Speelman, H. M. Jansen, and A. H. J. Kolk. 1993. Evaluation of different tests for the serodiagnosis of tuberculosis and the use of likelihood ratios in serology. Am. Rev. Respir. Dis. 148:378-384. [DOI] [PubMed] [Google Scholar]
- 23.Ward, K. N., D. J. Turner, X. Couto Parada, and A. D. Thiruchelvam. 2001. Use of immunoglobulin G antibody avidity for differentiation of primary human herpesvirus 6 and 7 infections. J. Clin. Microbiol. 39:959-963. [DOI] [PMC free article] [PubMed] [Google Scholar]


