Abstract
In the last few years, the genomic sequence data for thousands of influenza A virus strains, including the 1918 pandemic strain, and hundreds of isolates of the avian influenza virus H5N1, which is causing an increasing number of human fatalities, have become publicly available. This large quantity of sequence data allows us to do comparative genomics with the human and avian versions of the virus. We find that the nucleotide compositions of influenza A viruses infecting the two hosts are sufficiently different that we can determine the host at almost 100% accuracy. This assignment works at the segment level, which allows us to construct the reassortment history of individual segments within each strain. We suggest that the different nucleotide compositions can be explained by a host-dependent mutation bias. To support this idea, we estimate the fixation rates for the different polymerase segments and the ratios of synonymous to nonsynonymous changes. Additionally, we provide evidence supporting the hypothesis that the H1N1 influenza virus entered the human population just prior to the 1918 outbreak, with an earliest bound of 1910.
Using the large number of available influenza virus sequences, we compared the nucleotide contents of avian and human strains. We found that mononucleotide composition is sufficient to separate the thousands of sequenced human and avian viruses with almost 100% accuracy. Higher-order compositions, including dinucleotide and trinucleotide compositions, etc., contribute minimal additional information, so we consider this effect unlikely to be due to codon usage bias. The four sets of strains that are incorrectly classified by our scheme are H5N1 Hong Kong, H9N2 Hong Kong, the recent H5N1 bird flu, and the 1918 H1N1 virus (6). These are all known to have been avian viruses that had recently entered the human population and were not able to be transmitted from human to human, with the sole exception of the 1918 H1N1 virus. Segment-by-segment analysis allows us to readily determine the reassortment of an avian segment into a human strain, such as the PB1 gene on segment 2 of the virus from the 1957 and 1968 pandemics (2).
The human viruses have a higher percentage of uracil and adenine in their genomes, while the avian viruses have a higher percentage of guanine and cytosine. Since one or more segments in each human strain likely came from a nonhuman, possibly avian, virus, the nucleotide composition has changed, probably due to a biased substitution rate, in human hosts relative to avian hosts. Because we have sequenced strains that span the last 90 years, we can actually detect the steady increase of U and A along with the decrease in C and G over time as the viral subtype evolved in the human host. A nice example is the H1N1 subtype, which entered the human population in 1918 or earlier. The original 1918 strain, recently sequenced from lung tissue found in several victims of the Spanish flu in Alaska (5), has a nucleotide composition similar to that of avian viruses in the set of statistically resolvable segments, which encode genes PB2, PB1, PA, and NP. As we analyzed the sequenced H1N1 strains from the next 90 years, the composition shifted until it reached the present day composition, which is entirely human. Computing the rate of substitution from the early strains, we determined the final steady-state nucleotide composition for this strain and found that the present-day strains are within the upper bound provided by this composition.
Results.
In order to categorize influenza virus strains by nucleotide composition, we employed a log-odds scoring system where the ratio of probabilities that we use for each nucleotide was taken from the fraction of that nucleotide in our set of sequenced human and avian strains:
 |
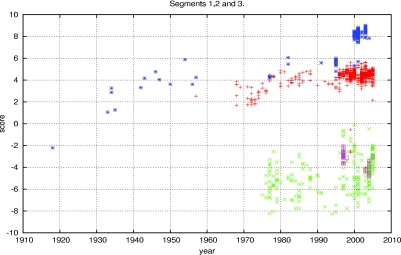
where PiH and PiA are the frequencies of nucleotide i found in the human and avian influenza A viruses, respectively, and ni is the number of nucleotides of type i in the segment or genome being scored. The results of the log-odds scoring applied to all sequenced human and avian strains of influenza A virus are found in Fig. 1. We used the RNA sequences from the largest three segments from each influenza virus strain in the scoring. When the strains are plotted by year against the log-odds score, the results are a near-perfect classifier. In Fig. 1, human strains are plotted in red and blue, while avian strains are plotted in green. Scores below zero classify the virus as avian, and those above zero correspond to human viruses. The purple boxes are avian strains that jumped to humans but were not able to spread from human to human, including the present H5N1 strains. Blue asterisks indicate the H1N1 strain, including the 1918 pandemic strain. When these criteria are used, the 1918 strain is clearly classified with the avian influenza viruses. The evolution of this subtype within humans is displayed in the strains between 1930 and 1960. As mentioned above, this evolution of log-odds score maps G→A and C→U changes in nucleotide composition. The red pluses represent the rest of the human subtypes whose sequences can be found in the National Center for Biotechnology Information (NCBI) database, containing the dominant H3N2 (1968) and H2N2 (1957) strains as well as a few viruses identified as H1N2 (US 2002) and H9N2 (Hong Kong 1999 of avian origin).
FIG. 1.
Log-odds scores of human and avian influenza A virus nucleotide composition from the coding sequences of the polymerase genes versus year. Blue asterisks represent human H1N1 strains, purple squares represent H5N1 found in humans, and red pluses represent the remaining human strains available from the NCBI database. Green crosses represent all the avian strains available in the NCBI database at the time of analysis.
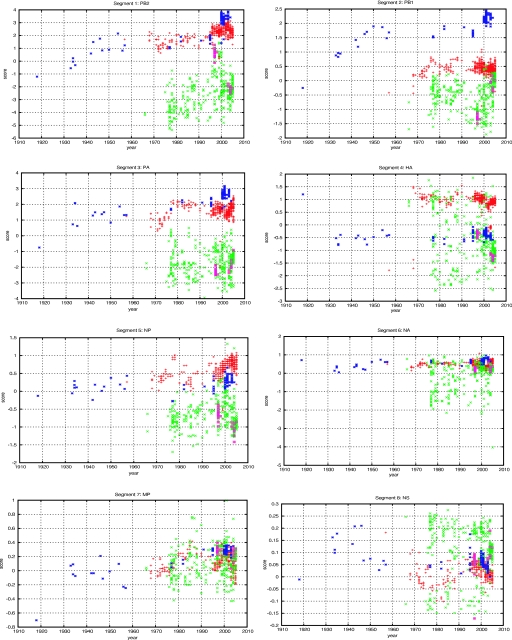
Because of reassortment, each of the segments for a particular strain can have an independent origin. It is instructive to repeat this analysis for each segment separately. The results are shown in Fig. 2. Chromosomal reassortment can readily be seen in this analysis. The PB1 gene, displayed in Fig. 2B, of the virus from the 1957 H2N2 pandemic is known to have reassorted from an avian virus and it clearly scores as avian. The same is true for H3N2 PB1 from the 1968 influenza virus. PB2 in Fig. 2A and PA in Fig. 2C derive from a prior human strain, which is also clearly visible in these figures. The 1918 H1N1 strain scores with the avian strains for all three of its largest segments. It is interesting that the hemagglutinin and neuraminidase gene scores (Fig. 2D and F, respectively) do not show the same pattern of nucleotide differences as the rest of the six segments. These two genes are under strong immunoselection, so we might have expected the nucleotide composition effect that we observe in the other segments to be drowned out in them. An interesting feature of Fig. 2F is that the human neuraminidase gene nucleotide composition is constant despite multiple known reassortments. Segment 5, containing NP (Fig. 2E), follows the same trend as segments 1, 2, and 3, which contain genes PB2, PB1, and PA, with a decaying signal due to its shorter length. The two final segments, 7 and 8, containing MP and NS (Fig. 2G and H), are very short and also code for multiple proteins, which constrains the nucleotide changes.
FIG. 2.
Same analysis as in Fig. 1, presented in segment-by-segment fashion for all eight influenza virus segments. Blue asterisks represent human H1N1 strains, purple squares represent H5N1 found in humans, and red pluses represent the remaining human strains available from the NCBI database. Green crosses represent all the avian strains available in the NCBI database at the time of analysis. HA, hemagglutinin gene; NA, neuraminidase gene. PB1, PB2, and PA, the three viral polymerase subunits; NP, nucleoprotein; MP, matrix protein; NS, nonstructural.
Using the 1918 and 1933 H1N1 sequences, where the spread in the data is minimal, we can compute the matrix of substitution rates as the H1N1 subtype evolved. Unlike the 1918 virus, which was frozen until sequencing, the 1933 H1N1 virus was passaged extensively, adding an error to this analysis. However, we expect this error to be small, as the virus was not passaged in a human host, where we find the bias. Our analysis is once again segment by segment for the three largest segments. Calculating the ratio of the number of nonsynonymous to synonymous changes, na/ns, for the three segments, we see that they are all ≪1: na1/ns1 = 0.22, na2/ns2 = 0.16, and na3/ns3 = 0.19, where the superscript numeral indicates the influenza virus segment. The changes we observe are dominated by synonymous substitutions. Given the assumption that the synonymous substitutions are mostly neutral, this implies that the overall substitution rates we compute are dominated by neutral contributions. A nice consistency check is that the substitution rate matrices from the three separate segments are statistically indistinguishable (Table 1).
TABLE 1.
Substitution rate matrices for three separate influenza virus segments
| Gene | Substitution rate (Pija) for:
|
|||
|---|---|---|---|---|
| U | C | G | A | |
| PB2 | 0.9977 | 0.0030 | 0.0009 | 0.0004 |
| 0.0018 | 0.9969 | 0 | 0 | |
| 0.0002 | 0.0001 | 0.9961 | 0.0027 | |
| 0.0003 | 0 | 0.0030 | 0.9969 | |
| PB1 | 0.9988 | 0.0032 | 0.0008 | 0.0001 |
| 0.0010 | 0.9968 | 0 | 0 | |
| 0.0001 | 0 | 0.9971 | 0.0012 | |
| 0.0001 | 0 | 0.0021 | 0.9987 | |
| PA | 0.9979 | 0.0029 | 0.0003 | 0 |
| 0.0018 | 0.9966 | 0 | 0 | |
| 0.0001 | 0 | 0.9973 | 0.0010 | |
| 0.0002 | 0.0005 | 0.0024 | 0.9990 | |
Pij is the number of substitutions per year, i is the nucleotide of the 1933 segment, and j is the nucleotide of the 1918 segment. The counting of nucleotides is done in the genomic sense (RNA−) and the order is U, C, G, A.
According to Kimura, the substitution rate is proportional to the mutation rate for neutral mutations assuming a sufficiently large number of generations (3). This implies that we can estimate the relative mutation rates from the matrices and the associated bias.
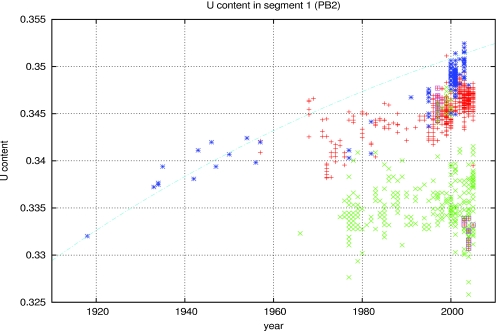
The rate matrix has an approximately block diagonal form, where the rates of fixation for G↔A and C↔U are much higher than the rate of changes that mix purines with pyrimidines. Focusing first on the two-by-two block diagonal for G and A (lower right block) (Table 1), we notice that the off-diagonal terms are almost equivalent. There is only a small bias of G→A over time. The other two-by-two block shows a strong bias for C→U (upper left block). The largest contribution to the log-odds score is contained in the relative U and C percentages. Evolving this two-by-two matrix, we can compute the curve of U content evolution. The steady-state U content should approach the eigenvector of this matrix with the larger eigenvalue. In reality, we expect this computation to give an upper bound on the long-term U content because we expect selective pressures to restrict the percent of U from becoming so high as to cause structural problems. Nonetheless, the curve is a good approximation to the data, as seen in Fig. 3. It is important to note that the H1N1 did not evolve for the 20-year period for which we have no data between 1957 and 1977, possibly because the strain was frozen in a laboratory and then rereleased 20 years after the H1N1 virus disappeared from the human population. Therefore, our curve is expected to fit the data with this period removed.
FIG. 3.
U content evolution of the PB2 gene on segment 1. Blue asterisks are human H1N1 strains, purple squares are H5N1 found in humans, and red pluses are the remaining human strains available from the NCBI database. Green crosses are all the avian strains available in the NCBI database at the time of analysis. The blue dashed line is the predicted evolutionary curve for U content change computed using the U-C block diagonal component of the substitution matrices. This matrix was derived from the nucleotide content of the 1918 H1N1 and 1933 H1N1 Wilson-Smith strains.
Extrapolating backwards from the 1918 flu, given the fixation rate matrices, we can put an upper bound on the length of time the H1N1 strain could have evolved within the human population prior to 1918. If the virus had been introduced to human hosts before 1910, the U content would be below the level found in any flu strain in the NCBI database for any host species. So the virus likely did not make the jump to humans more than 8 years before 1918, and probably less. We cannot say for certain that the virus moved straight from an avian to a human host without evolving in another organism for a period of time. However, the nucleotide composition of all the segments from the 1918 H1N1 strain is consistent with its being an avian virus.
Discussion.
The observed bias in the rates of fixation of nucleotides C and U in human versus avian influenza A viruses has three different potential explanations. One possibility is natural selection. The cellular environment in humans favors more Us and fewer Cs in the influenza virus than the avian cellular environment does. Perhaps this could be due to temperature differences which impact RNA structure. However, the evidence presented suggests that the changes are due to neutral evolution. Another possibility is that the RNA-RNA polymerase machinery includes different cellular components in human and avian cells, creating a relative mutation bias. The final possibility, although speculative, is that humans have a native defense against RNA viruses that operates similarly to the Apobec family of genes. The Apobec3G gene is known to cause deamination of cytosine, which results in a uracil during the retrotranscription of lentiviruses (1, 4, 7). The Apobec family does not appear to have orthologs in avian species.
Acknowledgments
We thank Michael Kransnitz and Matthew Kleban.
This work was supported by The Simons Foundation, the Ambrose Monell Foundation, and the Leon Levy Foundation. R.R. was supported in part by the U.S. Department of Energy, grant DE-FG02-90ER40542.
Footnotes
Published ahead of print on 20 September 2006.
REFERENCES
- 1.Cullen, B. R. 2006. Role and mechanism of action of the APOBEC3 family of antiretroviral resistance factors. J. Virol. 80:1067-1076. [DOI] [PMC free article] [PubMed] [Google Scholar]
- 2.Kawaoka, Y., S. Krauss, and R. G. Webster. 1989. Avian-to-human transmission of the PB1 gene of influenza A viruses in the 1957 and 1968 pandemics. J. Virol. 63:4603-4608. [DOI] [PMC free article] [PubMed] [Google Scholar]
- 3.Kimura, M. 1962. On the probability of fixation of mutant genes in a population. Genetics 47:713-719. [DOI] [PMC free article] [PubMed] [Google Scholar]
- 4.Sawyer, S. L., M. Emerman, and H. S. Malik. 2004. Ancient adaptive evolution of the primate antiviral DNA-editing enzyme APOBEC3G. PLoS Biol. 2:E275. [DOI] [PMC free article] [PubMed] [Google Scholar]
- 5.Taubenberger, J. K., A. H. Reid, R. M. Lourens, R. Wang, G. Jin, and T. G. Fanning. 2005. Characterization of the 1918 influenza virus polymerase genes. Nature 437:889-893. [DOI] [PubMed] [Google Scholar]
- 6.Tumpey, T. M., C. F. Basler, P. V. Aguilar, H. Zeng, A. Solorzano, D. E. Swayne, N. J. Cox, J. M. Katz, J. K. Taubenberger, P. Palese, and A. Garcia-Sastre. 2005. Characterization of the reconstructed 1918 Spanish influenza pandemic virus. Science 310:77-80. [DOI] [PubMed] [Google Scholar]
- 7.Yu, Q., R. Konig, S. Pillai, K. Chiles, M. Kearney, S. Palmer, D. Richman, J. M. Coffin, and N. R. Landau. 2004. Single-strand specificity of APOBEC3G accounts for minus-strand deamination of the HIV genome. Nat. Struct. Mol. Biol. 11:435-442. [DOI] [PubMed] [Google Scholar]


