Abstract
The worldwide increase in the prevalence of multi-antibiotic–resistant bacteria has threatened the physician’s ability to provide appropriate therapy for infections. The relationship between antimicrobial drug concentration and infecting pathogen population reduction is of primary interest. Using data derived from mice infected with the bacterium Pseudomonas aeruginosa and treated with a fluoroquinolone antibiotic, a mathematical model was developed that described relationships between antimicrobial drug exposures and changes in drug-susceptible and -resistant bacterial subpopulations at an infection site. Dosing regimens and consequent drug exposures that amplify or suppress the emergence of resistant bacterial subpopulations were identified and prospectively validated. Resistant clones selected in vivo by suboptimal regimens were characterized. No mutations were identified in the quinolone resistance–determining regions of gyrA/B or parC/E. However, all resistant clones demonstrated efflux pump overexpression. At base line, MexAB-OprM, MexCD-OprJ, and MexEF-OprN were represented in the drug-resistant population. After 28 hours of therapy, MexCD-OprJ became the predominant pump expressed in the resistant clones. The likelihood of achieving resistance-suppression exposure in humans with a clinically prescribed antibiotic dose was determined. The methods developed in this study provide insight regarding how mathematical models can be used to identify rational dosing regimens that suppress the amplification of the resistant mutant population.
Introduction
The rapid increase in the prevalence of antibiotic-resistant microorganisms is a global problem that has threatened the ability of physicians to treat serious infections. Studies have demonstrated that infections caused by antibiotic-resistant bacteria are more difficult to treat, resulting in excess morbidity and mortality as well as higher health care costs. Therefore, it is imperative to identify ways of suppressing the emergence of antibiotic-resistant mutants.
Current preclinical methods for assessing the efficacy of an antimicrobial agent most often evaluate the effect of selected dosages of the compound on the reduction in the total bacterial population at an infection site. The impact of drug pressure on the amplification of the drug-resistant subpopulation is ignored (1–3).
For some antibiotic dosages, the drug-susceptible population may be completely replaced with resistant mutants over time. Clinically, this may manifest as the failure of an infection to respond to therapy or a relapse of infection with drug-resistant mutants shortly after a prescribed course of antibiotic therapy is completed.
The probability that a resistant subpopulation exists within a predominantly drug-susceptible wild-type population is dependent on the number of organisms at the infection site (total population burden) and the mutational frequency to resistance to the antibiotic prescribed. Emergence of drug-resistant mutants with therapy is most often documented in patients who receive antibiotics for the treatment of pneumonia. This is because the bacterial burden found in a pneumonic lung often exceeds 1010 (4). The mutational frequency to resistance for mechanisms attributable to single point mutations is most frequently measured in the range of 10–6 to 10–8. When the total bacterial population burden exceeds the inverse of the mutational frequency to resistance by greater than an order of magnitude, there will be a very high probability that a resistant subpopulation will be present in the total population at base line, before any selective pressure is applied (5). In addition, amplification of a resistant subpopulation is also dependent on the dosage of antibiotic administered.
Blondeau et al. (6) demonstrated in vitro that single-step mutants can be selected from a wild-type bacterial population when the microorganism is cultured on agar that contains an antibiotic at concentrations above the minimum inhibitory concentration (MIC) of the drug. However, as the concentration of drug in the agar is increased, resistant mutants can no longer be identified. Zhou et al. (7) showed that a large diversity of mutations are amplified with low drug concentrations in vitro. As the drug concentration is increased, a progressively smaller diversity of mutations are amplified, until a concentration is reached at which no mutations are isolated. Clearly, these in vitro studies show that resistance amplification can be prevented with an appropriate drug concentration. These in vitro studies are important but employ a fixed drug concentration. They provide little guidance about selecting a clinical drug dose adequate to suppress the resistant subpopulation.
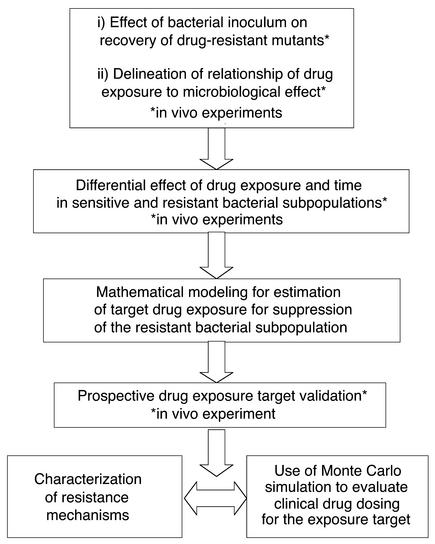
In the current study we modified a standard mouse-thigh bacterial infection model to characterize the effect of escalating doses of an antibiotic on the in vivo amplification and suppression of the drug-susceptible and -resistant populations over 24 hours. The flow of the experiments to elucidate this drug effect is presented in Figure 1. The effect of increasing the infection inoculum on selection of resistant mutants was defined, and the microbiological effect of increasing drug doses was examined. The time dependency of effect on the sensitive and resistant populations was examined. Using these in vivo data, we developed a mathematical model to predict the effect of any antibiotic dose on the suppression or amplification of the drug-susceptible and drug-resistant bacterial subpopulations as a function of drug dose and therapy duration. The mathematical model was prospectively validated in an extended 48-hour study in the mouse infection system using doses not previously examined. The validation study doses were predicted to maximally amplify and to suppress resistance. The resistance mechanisms selected throughout therapy were characterized (8–13). Finally, we wished to be able to translate the insights obtained in this investigation to drug-dose selection in clinical patients. Monte Carlo simulation allows the variability of drug exposure when an agent is administered to a large population to be examined. Using the target drug exposure that would be predicted to suppress resistance from this study, we determined the fraction of patients that would achieve the target exposure, accounting for the variability in drug exposure by Monte Carlo simulation, and for the variability in pathogen MIC to the drug in question by examining a large collection of MICs for the pathogen of interest.
Figure 1.
Flow diagram of the experimental design.
For this investigation, the bacterium Pseudomonas aeruginosa was used as the infecting pathogen, because this species is a common cause of nosocomial pneumonia, particularly in intensive care units. Furthermore, this pathogen frequently becomes resistant to the antibiotic prescribed during therapy. Levofloxacin, a fluoroquinolone antibiotic, was chosen as the antibiotic probe, because fluoroquinolones are commonly used in intensive care units.
While resistance among nosocomial pathogens has become a cause for great concern, little has been done with the choice of dose as a way of ameliorating this problem. We present here a paradigm for selecting drug doses for the clinic that will suppress emergence of resistance and thereby extend the useful lifetimes of new agents.
Methods
Organism.
P. aeruginosa (ATCC 27853; American Type Culture Collection, Rockville, Maryland, USA) was used in the mouse infection system. Aliquots of the bacteria were stored in skim milk at –70°C. For each study, fresh isolates were grown on blood agar plates (BBL Microbiology Systems Inc., Cockeysville, Maryland, USA) overnight at 35°C, then grown to log phase in Mueller-Hinton II broth (MHB; Difco Laboratories, Detroit, Michigan, USA).
Drug.
Levofloxacin powder (assay no. 85632; lot no. DW136; potency 97.2%) was supplied by R.W. Johnson Pharmaceutical Research Institute (Raritan, New Jersey, USA). Stock solutions of 1 mg/ml of drug were aliquoted and stored at –70°C. For each study a sample was thawed and diluted to the desired concentrations with MHB.
Determination of minimum inhibitory and bactericidal concentrations and mutational frequency to resistance at 3 × MIC.
Studies of MIC, defined as the lowest drug concentration that results in no visible growth after 24 hours of incubation at 35°C in ambient air, and minimum bactericidal concentration (MBC), defined as 99.9% bacterial-density reduction compared with the growth control, were conducted using the standard macrobroth-dilution method of the National Committee for Clinical Laboratory Standards (Wayne, Pennsylvania, USA; publication M7-A4, 1997). Serial twofold dilutions of drug were used to determine the geometric MIC (bacterial concentration 5 × 10⁵ CFUs/ml), followed by a narrower range of drug concentration to determine the arithmetic MIC (serial 0.2 mg/l increments in drug concentration). The arithmetic dilution series were conducted to more precisely identify the MIC. MBCs were determined by quantitative culturing of macrobroth-dilution tube material from MIC determination studies. Geometric MIC and MBC studies were conducted three times each by two independent technicians and six times for the arithmetic MIC determination.
The mutation frequency of the P. aeruginosa isolate to 3 × MIC of levofloxacin was determined by inoculation of 4 ml of a 2 × 10⁸–CFU/ml bacterial suspension onto Mueller-Hinton agar supplemented with the drug at 3 × MIC and onto drug-free agar. After 72 hours of incubation at 35°C, the colonies were counted and the mutation frequency was calculated by division of the CFUs/ml that grew on the surface of the drug-containing agar by the CFUs/ml that grew on the surface of the drug-free agar. A drug concentration of 3 × MIC was chosen for study because a single point mutation in the genes of gyrA/B and parC/E and efflux pump overexpression all increase the MIC four- to eightfold above that of the wild-type microorganism.
Animals.
Normal 24- to 26-g female outbred ICR/Swiss mice (Taconic Farms, Taconic, New York, USA) were used in all in vivo studies. Food and water were provided ad libitum. All animal experimentation procedures were approved by and conducted in accordance with the guidelines of the Institutional Animal Care and Use Committee of Albany Medical College.
Effect of bacterial inoculum on treatment outcome in infected mice.
The mouse-thigh infection model pioneered by Eagle and colleagues (1) and greatly expanded upon by Craig (2, 3) was used as our experimental disease system. Two groups of mice (n = 15 per group) were infected in each posterior thigh muscle by an intramuscular injection with 1 × 10⁷ or 1 × 10⁸ CFUs of P. aeruginosa (in 0.1-ml volumes). The densities of the bacterial inocula were confirmed by quantitative cultures. Two hours after bacterial inoculation, the mice were treated with a single intraperitoneal injection of one of several predetermined doses of drug, ranging from 0 to 1,000 mg/kg of body weight to provide 24-hour area under the concentration time curve/MIC (AUC/MIC) exposures of 0 to 650. Twenty-four hours later, the mice were humanely sacrificed. Both posterior thigh muscles were aseptically collected, homogenized, and washed with normal saline to prevent drug carry-over. The homogenates were serially diluted 1:10 in normal saline, then quantitatively cultured (detection limit = 50 CFUs/g of thigh muscle) onto drug-free agar plates and agar plates supplemented with 3 × MIC of levofloxacin to characterize the effect of therapy on the total (quantitation on drug-free agar) and drug-resistant (quantitation on drug-containing agar) populations. A concentration of 3 × MIC was identified by replica plating studies to reliably capture drug-resistant mutants. A separate group of infected mice was sacrificed just prior to initiation of therapy to determine the bacterial density in thigh muscles at the start of therapy. After the plates were incubated at 35°C for 72 hours, the colonies were enumerated.
The relationship between levofloxacin dose and the reduction in the total bacterial density in thigh muscles for each infection inoculum after 24 hours of therapy was evaluated by an inhibitory sigmoid Emax dose-response model using the identification module of the ADAPT II software package of D’Argenio and Schumitzky (14). Experimental data were weighted by the inverse of the observation variance. For each group, the doses (and consequent 24-hour AUC/MIC exposures) of drug needed to reduce the bacterial density in thigh muscle by 1, 2, and 3 log10 (CFUs/g) were calculated. The effect of drug exposure (AUC/MIC ratio) on the selection of the drug-resistant subpopulation for each group also was determined.
Differential effect of antibiotic pressure on drug-susceptible and -resistant bacterial populations over 24 hours in mice.
To develop a mathematical model that predicts the possible differential effect of drug doses on the drug-susceptible and -resistant bacterial populations as a function of time, four cohorts of animals (n ≥ 18 per group) were infected with 108 CFUs of P. aeruginosa in each posterior thigh muscle and then were treated with a single dose of 0, 90, 215, or 600 mg/kg of levofloxacin. These doses were chosen because they are on the steep part of the exposure-response curve. Mice were sacrificed (n ≥ 3 per group) at 0, 1, 4, 6, 11, and 24 hours after therapy initiation. Homogenates of the thigh muscles were washed, then quantitatively cultured onto drug-free agar plates for total-population enumeration, and onto drug-containing agar plates for drug-resistant subpopulation enumeration.
Determination of levofloxacin pharmacokinetics in the infected mouse.
To correlate the doses of drug administered to mice with AUC/MIC exposures, dose-range studies for levofloxacin were conducted to determine the pharmacokinetics of levofloxacin when administered as a single dose. Mice were treated 2 hours after infection by intraperitoneal injection of 25, 50, 150, 200, 250, and 350 mg/kg of levofloxacin. Three animals from each group were sacrificed at 0.25, 0.5, 1, 2, 3, 4, and 6 hours after drug administration. Blood was collected by cardiac puncture and allowed to clot on ice. The serum was obtained by centrifugation and stored at –70°C. The concentration of levofloxacin in each serum sample was determined using an HPLC assay adapted from Wong et al. (15). Levofloxacin was obtained as the hemihydrate powder (assay no. 85632; lot no. DW136; potency 97.2%) from the R.W. Johnson Pharmaceutical Research Institute. Ciprofloxacin, the internal standard, was obtained as the hydrochloride salt from Sigma-Aldrich (St. Louis, Missouri, USA). HPLC analysis was performed using a Hewlett-Packard Series 1100 system (Hewlett-Packard, Waldbronn, Germany). The detector wavelength was set at 330 nm. Quantitation of levofloxacin concentrations in plasma samples was based on linear regression analysis of peak area ratios of standard levofloxacin concentrations. Separation was accomplished on a Hewlett-Packard Eclipse XDB-C18 (5 μm; 250 × 4.6 mm internal diameter) column (Hewlett-Packard, Palo Alto, California, USA) maintained at 35°C. The isocratic mobile phase consisted of 5 mM copper (II) sulfate pentahydrate and 10 mM L-isoleucine in methanol (87.5:12.5, vol/vol) and was extracted with 4 ml of dichloromethane and reconstituted in 100 μl of HPLC mobile phase. The assay was linear over a range of 0.01–10 mg/l. Within-day coefficients of variation were less than 9%, and between-day coefficients of variation were less than 13%. The limit of quantitation was 0.01 mg/l.
Changes in drug concentration over time were analyzed by the nonparametric expectation maximization 2 (NPEM2) population pharmacokinetic modeling approach with one- and two-compartment open models with first-order elimination from the central compartment (i.e., serum) and a first-order input (16). Akaike’s information criterion (17) was used to discriminate between the models. The inverse of the SD of measured mean concentrations was used for weighting the pharmacokinetic data.
Population pharmacokinetic parameters including SCL (l/h), Vc (l), Ka (h–1), K23 (h–1), and K32 (h–1) were estimated by NPEM2. Definitions for these terms are as follows: SCL (l/h), rate of clearance of drug from serum (central compartment); Ka (h–1), first order absorption rate constant for the diffusion of drug from the peritoneal cavity into the central (serum) compartment; K23 (h–1) and K32 (h–1), first-order transfer constants between the central and peripheral compartments.
Mathematical-model development.
Details of the mathematical-model development are supplied in the supplementary online material (http://www.jci.org/cgi/content/full/112/2/275/DC1).
Determination of the differential effect of drug pressure on sensitive and resistant bacterial subpopulations using the mathematical model.
Determinations of sensitive and resistant populations of P. aeruginosa from all observations were simultaneously comodeled using the population modeling software program BigNPEM at the San Diego Supercomputer Center (University of California, San Diego; developed under NIH grant RO1-RR11526 to Roger Jelliffe). Briefly, the population pharmacokinetic parameters for drug disposition in the mouse, determined as described above, were applied to Equations 1–3 (see supplementary online material, http://www.jci.org/cgi/content/full/112/2/275/DC1). All determinations of sensitive and resistant subpopulations over time were comodeled using Equations 4–7. Initial conditions (numbers of total and resistant organisms present at base line) were identified as part of the model-fitting process.
Maximum a posteriori probability (MAP) Bayesian estimates of the system parameters were obtained for each of the regimens using the “population of one” utility of BigNPEM. Once estimated, the regimen-specific parameter values can be used to make model predictions of bacterial subpopulation responses.
Prospective validation of the mathematical-model analysis in the mouse infection system.
Using the parameters identified from the mathematical model, two doses and subsequent exposures were calculated. The first dosage was predicted to maximally amplify the resistant mutant subpopulation over 48 hours, when that dosage was given daily for 2 days (regimen 1, AUC/MIC ratio = 52:1). The second dosage was predicted to hold the resistant mutant population stable over 48 hours, again, with two doses (regimen 2, AUC/MIC ratio = 157:1). It should be recognized that the mathematical model was made to predict the future, as the original data used to define the mathematical model were generated over a 24-hour time frame. In this model-validation study, these dosing regimens were administered over 48 hours. Homogenates of thigh muscles collected from sacrificed mice were quantitatively cultured on antibiotic-free and levofloxacin-supplemented (3 × MIC) agar throughout the study to determine the effect of each drug regimen on the total and drug-resistant bacterial populations over time.
Determination of mechanism of levofloxacin resistance.
Resistance to quinolone antibiotics can occur via point mutations in gyrA, gyrB, parC, and parE or an overexpression of efflux pumps of the Mex-Opr system that pumps quinolones out of the bacterium. To define whether resistance was mediated through mutations in DNA, chromosomal DNA was obtained using the QIAGEN Blood & Cell Culture Mini Kit (QIAGEN Inc., Valencia, California, USA). PCR and DNA sequencing were performed for gyrA and parC using primer pairs described by Kureishi et al. (18) and Nakano et al. (19). For gyrB and parE analysis, the following primers were used: gyrB, GYRB forward (5′-GCGCGTGAGATGACCCGCCGT-3′) and reverse (5′-CTGGCGGTAGGAAGGTCAG-3′); parE, PARE forward (5′-CCTCTCGATGAAGATGCAGGA-3′) and reverse (5′-GAGGATACAGATCTTGCCGTA-3′). Analysis of the sequences of the quinolone resistance–determining region (QRDR) amplified segments was performed directly with purified PCR-amplified genomic DNA. The internal primers GYRA-INT forward (5′-ATGAGCGAGCTGGGCAACGAC-3′) and reverse (5′-CAGGTCCGCCAGCAGTTCGTG-3′) were used to sequence gyrA. In vitro–selected P. aeruginosa mutants carrying known mutations in gyrA and gyrA plus parC were used as positive controls in these studies.
For determination of the presence of Mex-Opr system pump overexpression, we used inhibitors of the different Mex-Opr system pumps (provided by Essential Therapeutics Inc., Mountain View, California, USA). Geometric levofloxacin MICs were determined for P. aeruginosa isolates by standard broth-microdilution method in 96-well plates. The final concentration of bacteria in each microbroth well was 1 × 10⁵ CFUs/ml. The MICs were performed in the presence of drug alone, drug plus individual efflux pump inhibitors, or drug plus combinations of efflux pump inhibitors (the MexAB system inhibitor was D83-91011, the MexCD system inhibitor was MC-272457, and the MexEF system inhibitor was MC-210368). Susceptibility evaluations were performed for isolates cultured from treated and untreated infected mice in parallel with wild-type test strains, engineered strains overexpressing a single Mex pump, and strains overexpressing different combinations of two or three efflux pumps. The efflux pump background of the drug-resistant mutants was determined on the basis of the similarity of the susceptibility profile of the in vivo isolate to that of the test strain when exposed to different drug-plus-efflux-pump-inhibitor conditions. Lomovskaya and Watkins (20) and Lomovskaya et al. (13) have confirmed the utility of these inhibitors in determining efflux pump overexpression, by validation with Western blot analysis using antibodies against the outer-membrane components of the pumps.
Monte Carlo simulations for bridging from mice to humans.
Monte Carlo simulation, when used in pharmacokinetic investigation, is a mathematical method used to define the variability seen in drug exposure when a large population receives a specific drug dose. This can be used to create AUC/MIC ratios for specific MIC values. The fraction of the population receiving the drug that achieves a specific exposure target (AUC/MIC ratio) can then be determined.
For the current study, Monte Carlo simulation was conducted to determine the likelihood that the clinically prescribed daily dose of 750 mg of levofloxacin would attain or exceed the 157:1 AUC24-h/MIC drug exposure predicted by our mathematical model to be necessary to suppress the amplification of the drug-resistant P. aeruginosa subpopulation. The observed pharmacokinetic mean and variance data were previously derived from a population pharmacokinetic analysis of 58 patients with nosocomial pneumonia who were treated intravenously with 750 mg/d levofloxacin in a phase III clinical trial (21). The mean parameter vector and full covariance matrix were embedded in Subroutine PRIOR of the ADAPT II package of software programs (14). A 10,000-subject Monte Carlo simulation was performed. Both normal and log-normal distributions were examined and differentiated by their ability to reproduce the mean parameter values and their measure of dispersion. A levofloxacin MIC distribution for 404 P. aeruginosa isolates was provided by Focus Technologies Inc. (TSN; http://www.focusanswers.com). An expectation was taken over the entire MIC distribution of 404 strains of P. aeruginosa for the MIC-specific target-attainment rates for a 750-mg/d intravenous dose of levofloxacin and the prevention-of-resistance target.
Results
Effect of fluoroquinolone treatment regimens on P. aeruginosa
MIC, MBC, and mutation-frequency values.
The arithmetic median MIC and MBC for P. aeruginosa were 0.8 mg/l (range 0.4–1.0 mg/l) and 1.6 mg/l (range 1.4–1.8 mg/l), respectively. The in vitro mutation frequency of this strain of P. aeruginosa was 0.1 × 10⁻⁶ to 2 × 10⁻⁶.
Exposure response in mice infected with different bacterial inocula.
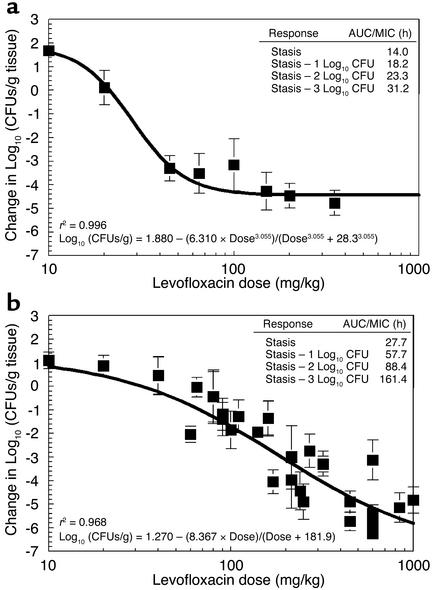
To examine the inoculum effects of the P. aeruginosa test strain on dose-response relationships, levofloxacin single-dose, dose-ranging studies were performed in mice infected with 107 or 108 organisms in both posterior thigh muscles. Quantitative cultures of infected thigh muscles collected from sacrificed mice at 24 hours after treatment administration showed that the relationship between exposure and reduction in bacterial load was inoculum dependent (Figure 2). There was a major difference between the AUC/MIC exposures needed to attain similar log10 killing for the inocula tested. The mutational frequency to resistance of the challenge strain explained the differences in antimicrobial response with different inocula. Drug-resistant P. aeruginosa mutants were readily isolated from treated and untreated animals infected with the higher inoculum. With the lower bacterial inoculum, resistant mutants were isolated only from the untreated controls (data not shown).
Figure 2.
P. aeruginosa dose response. Normal mice were inoculated with about 107 (a) or 108 (b) bacteria per thigh. The levofloxacin MIC and MBC were 0.8 μg/ml and 1.6 μg/ml, respectively. The x axis displays the exposures in mg/kg doses. The model allowed calculation of the dose necessary to achieve stasis (i.e., to return the colony counts at sacrifice to that used for the challenge), as well as 1, 2, and 3 log10 (CFUs/g) reductions in bacterial counts from the stasis point. These data are displayed in the inset as AUC/MIC ratio values for each of these degrees of drug effect. Comparison of microbiological outcome endpoints shows that levofloxacin treatment of P. aeruginosa infections is inoculum dependent. Isolation of drug-resistant P. aeruginosa mutants in vitro was common and occurred with a frequency of 0.1 × 10⁻⁶ to 2 × 10⁻⁶. At the higher infection inoculum, the microbial population burden significantly exceeded the mutation frequency. At exposures that killed the sensitive population, the resistant population was able to survive. This allowed this subpopulation to be selected and amplified by the drug pressure. Subsequently, a subpopulation of mutant organisms that behaved quite differently under antibiotic pressure emerged. Only with sufficient exposure to inhibit and kill the resistant subpopulation do we attain larger overall reduction of bacterial load.
Differential effect of drug exposure on the sensitive and resistant bacterial subpopulations in mice
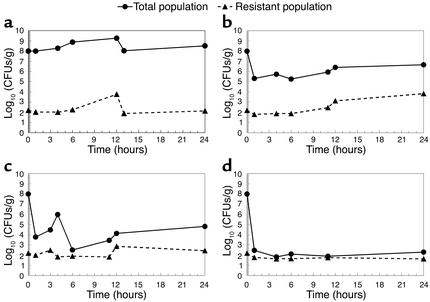
The effects of incremental antibiotic exposures on the drug-susceptible and -resistant bacterial populations at 1, 4, 6, 11, and 24 hours of treatment for four drug dosages are shown in Figure 3. In the placebo group, the proportion of drug-susceptible to drug-resistant populations remained stable throughout the 24-hour study. A dose of 90 mg/kg of antibiotic reduced the overall bacterial density. However, this dose amplified the resistant subpopulation. Higher doses of drug reduced the total bacterial population while holding the resistant mutants at their base-line concentration.
Figure 3.
Effect of four drug doses on the total and resistant bacterial populations over 24 hours. Drug doses were 0, 90, 215, and 600 mg/kg (a–d, respectively). The 90-mg/kg dose allowed amplification of the resistant population by almost 2 log10 (CFUs/g). The 215-mg/kg dose allowed only minimal amplification of resistant mutants.
Mouse pharmacokinetics.
Pharmacokinetic data (for Equations 1–3, see supplementary online material, http://www.jci.org/cgi/content/full/112/2/275/DC1) were obtained from single-dose, dose-ranging studies of levofloxacin in infected mice. Mean population-parameter estimates generated from the NPEM2 analysis were V = 0.022 liters, Ka = 35 h–1, K23 = 1.3 h–1, K32 = 0.86 h–1, and SCL = 0.048 l/h.
Mathematical-model results for the sensitive and resistant bacterial subpopulations
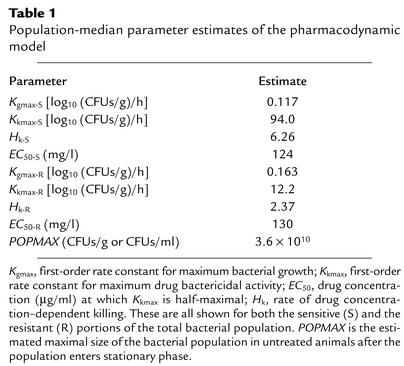
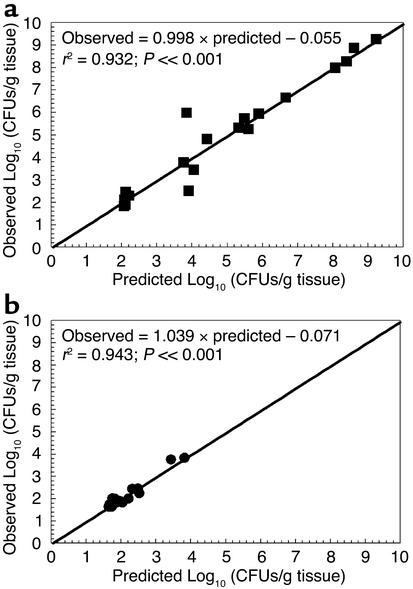
The mathematical model was fitted to the data obtained from the time-dependent effect of incremental doses of antibiotic on the drug-susceptible and -resistant bacterial populations, and the pharmacokinetic data generated in infected mice. Estimates of pharmacodynamic parameters are displayed in Table 1. Figure 4 shows the predicted-versus-observed plots following the generation of MAP Bayesian estimates for each regimen using the “population of one” utility of BigNPEM and employing the population-median values. The pharmacokinetic-pharmacodynamic model explained very well the survival and death kinetics for the total and resistant populations (r2 ≥ 0.93 for both total and resistant populations), demonstrating the utility of this model in describing the response of differentially susceptible pathogen subpopulations at the infection site upon experiencing antimicrobial exposure.
Table 1.
Population-median parameter estimates of the pharmacodynamic model
Figure 4.
Mathematical-model performance analysis. All regimens (n = 4) were simultaneously fit in a large population model (Equations 1–7, see supplementary material). The displayed graphs are the predicted-versus-observed plots for the total and resistant subpopulations following MAP Bayesian approximation. The model explained well the survival and bactericidal kinetics for the total (a) and resistant (b) populations (r2 ≥ 0.93 for total and resistant populations).
Calculation of regimens to amplify and suppress the initial resistant bacterial subpopulation.
Use of the MAP Bayesian parameter estimates from the population pharmacodynamic analysis allowed calculation of an AUC/MIC ratio that would optimally amplify the mutant subpopulation (52:1) as well as suppress its amplification (157:1). This allowed calculation of doses for our mouse model that could prospectively evaluate the predictions.
Prospective validation of the mathematical-model analysis in the mouse infection system.
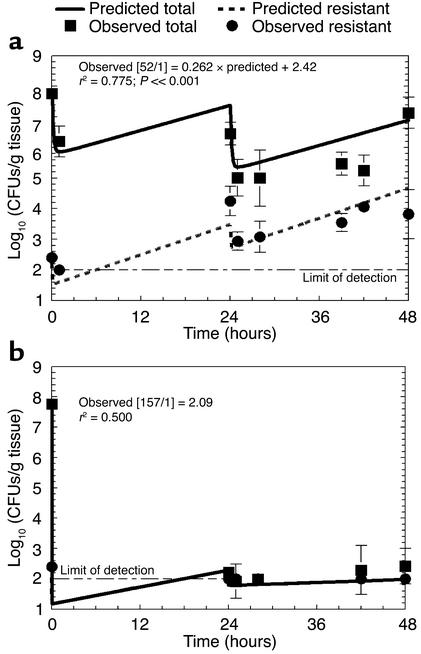
To prospectively validate and evaluate the reliability of the mathematical model, we studied, in the infected mouse, doses not previously studied that were predicted by the model (a) to encourage amplification of the resistant subpopulation (AUC/MIC ratio = 52:1), or (b) to result in no net change in the density of the resistant subpopulation from the level determined at the beginning of therapy (to suppress emergence of resistance, AUC/MIC ratio = 157:1). Furthermore, the treatment/observation period was extended from 24 to 48 hours. Predicted values of colony counts for the total population and the resistant subpopulation were calculated from MAP Bayesian estimates generated for each regimen. The results of this prospective validation are displayed in Figure 5. The continuous curves are not the best-fit curves, but rather the prospectively predicted curves of the effect of the drug doses on the total bacterial population and resistant subpopulation. The experimental results generated prospectively confirmed mathematical-model predictions. The regimen that was predicted to encourage amplification of the resistant subpopulation performed as predicted. The regimen predicted to suppress the resistant subpopulation maintained bacterial levels at or just above the limit of detection.
Figure 5.
Model validation. The emergence-of-resistance model developed in this study was prospectively evaluated and validated by generation of response predictions for doses not previously studied that would encourage selection of resistance (a) or suppress emergence of resistance (b). An exposure of an AUC/MIC ratio of 157:1 was calculated to prevent emergence of resistance. Experiments were performed to 48 hours, not 24 hours as in the studies performed to generate parameter estimates; conditions predicted by the model were used. Levofloxacin dosing occurred at time 0 and at 24 hours. The lines are model predictions (not best-fit curves). Squares represent experimental measurements of the total population. Circles represent experimental measurements of the resistant subpopulation. The model predicted changes in the resistant mutant population well at both exposures.
Mechanism of resistance.
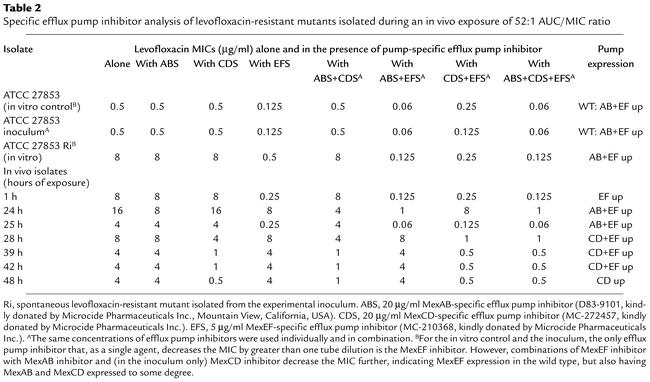
Examination of isolates recovered from the drug-containing plates after being exposed to a 52:1 AUC/MIC ratio failed to demonstrate any mutations from base line in the QRDRs of gyrA/B or parC/E.
In vitro evaluation of the wild-type P. aeruginosa strain (ATCC 27853) consistently showed that, as a single agent, the MexEF efflux pump inhibitor was most active, but that the addition of the MexAB-OprM inhibitor had an MIC effect over and above that shown by MexEF alone. This suggests that the MexAB-OprM and MexEF-OprN efflux systems are present in the wild-type population (Table 2). After therapy initiation, isolates from treated animals were predominantly MexEF-OprN overexpressors, but with some evidence for MexAB-OprM overexpression. However, isolates harvested from time points after 28 hours (after the second levofloxacin dose that produced an AUC/MIC ratio of 52:1) were determined to be predominantly MexCD-OprJ overexpressors, but with some additional MexEF-OprN overexpression. By hour 48, only MexCD-OprJ expression was seen.
Table 2.
Specific efflux pump inhibitor analysis of levofloxacin-resistant mutants isolated during an in vivo exposure of 52:1 AUC/MIC ratio
Bridging from mice to humans: Monte Carlo simulation
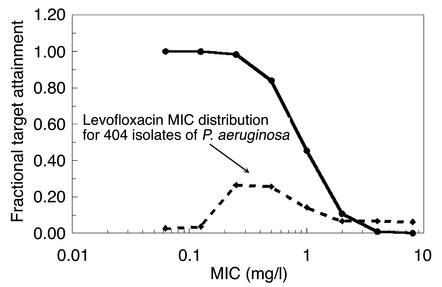
A 10,000-subject Monte Carlo simulation was performed. The distribution of AUCs was derived from a pharmacokinetic database of patients treated with 750 mg levofloxacin once daily for nosocomial pneumonia. For each MIC in a doubling diluting series from 0.06 mg/l to 8 mg/l, the fraction of the subjects that achieved the target AUC/MIC ratio that was shown to suppress the amplification of the resistant mutant subpopulation (157:1) was calculated. This is presented in Figure 6. In addition, we obtained the MIC distribution to levofloxacin from a group of 404 isolates of P. aeruginosa provided by The Surveillance Network (TSN). We then calculated the overall expected AUC/MIC target-attainment rate for the drug dose, employing the MIC distribution and also employing the target-attainment rate as indexed to MIC. This was calculated to be 61.2%. Monte Carlo simulations were also performed for ciprofloxacin for regimens of 200 mg IV every 12 hours and for 400 mg IV every 8 hours. The outcomes for these regimens were target-attainment rates of 24.8% and 61.8%, respectively.
Figure 6.
Target-attainment analysis. The fraction of 10,000 simulated subjects that attained an AUC/MIC ratio of 157:1 (target for suppression of resistance) is displayed as a function of the MIC for a distribution of 404 isolates of P. aeruginosa.
Discussion
There are certain resistance mechanisms in which a random mutation occurs to provide a phenotype that renders the clone more resistant to a specific class of drugs. In this case, if the bacterial population load is large enough and substantially exceeds the inverse of the mutation frequency, there will be a high probability of such clones being present in the population at the initiation of drug therapy. Drug pressure can then amplify the resistant portion of the population differentially from the more susceptible population. This can result in emergence of resistance, even during drug therapy. As an example of this, Chow and colleagues (22) reported that patients with Enterobacter bacteremia treated with third-generation cephalosporins had emergence of resistance during therapy, most likely through stable derepression of an ampC β-lactamase, in over 19% of instances. Importantly, once the resistant clone is amplified, it can be spread horizontally.
We wished to examine an animal infection model to determine whether a dosing regimen could be chosen that would suppress the resistant subpopulation. We chose fluoroquinolones, because of clinical relevance and because the major mechanisms of resistance (target mutations and pump overexpression) cause an increase in MIC usually on the order of two- to eightfold and could possibly be suppressed by regimen choice.
Early experiments demonstrated that response to drug therapy was influenced by the size of the bacterial burden at the primary infection site (Figure 2). When increased by a factor of 10 from about 107 to about 108 CFUs/g, it required two to six times as much drug exposure (AUC/MIC ratio) to obtain the same degree of bacterial effect. We hypothesize that this is because the increase in infection burden also increases the size of the resistant population tenfold. These experiments evaluated the bacterial population only at base line and 24 hours.
We also wished to examine the temporal effect of drug pressure on both the more and the less drug-susceptible bacterial populations. We developed a mathematical model system (see supplementary online material, Equations 1–7, http://www.jci.org/cgi/content/full/112/2/275/DC1) to study this problem. Temporal changes in infection burden showed that sensitive and resistant populations at an infection site responded differently to antimicrobial pressure. An infection initiated with 108 organisms per thigh harbored approximately 50–1,000 spontaneously drug-resistant mutants. With suboptimal doses, levofloxacin was active against the sensitive population, while it permitted the resistant population to amplify. At higher doses, levofloxacin allowed less resistant mutant population growth and, if dosed at a sufficiently high level, prevented the resistant subpopulation from amplifying beyond the number present at the initiation of therapy. These results show that population burden, along with the drug dose employed, determines the response of the infection to drug therapy. Emergence of resistance and overall outcome may be altered by drug exposure.
Use of the model parameters identified in the analysis (Table 1) allowed calculation of an exposure that would optimally amplify the resistant subpopulation (AUC/MIC ratio = 52:1) and an exposure (157:1) that was predicted to hold the population at or near the numbers present at therapy initiation. This prospective validation employed doses not used before and a time frame longer than that examined in the original experiment (48 vs. 24 hours), so that we were, in effect, truly predicting the future. The model predictions were shown to be correct. Figure 5 shows the predicted time course of the total and resistant bacterial subpopulations (lines) and also the observed values from the validation experiment superimposed on the predicted lines. This is, to our knowledge, the first prospective validation of this sort performed in vivo for suppression of resistance.
When we examined the mechanism of resistance, we were surprised by the absence of any target mutations in any of the QRDRs. Instead, type-specific efflux pump inhibitors alone and in combination allowed us to verify the central role that pumps were playing in the initial emergence of resistance. We also found that the duration of drug pressure had an impact on the type of pump that was ultimately selected. Drug pressure and the hostile environment posed by the infection site modulate efflux pump dominance. With therapy, early time points saw the selection of the MexEF-OprN pump. Later time points demonstrated that the predominant pump system overexpressed was MexCD-OprJ. We hypothesize that this is the most efficient pump for levofloxacin. Kohler et al. demonstrated, in an in vitro investigation, findings similar to those reported here. In the short term, quinolone drug exposure selected more resistant clones that lacked target mutations and that overexpressed pumps (23). Indeed, they showed that the parent drug of levofloxacin (ofloxacin, the 50:50 racemate) selected primarily MexCD-OprJ.
We demonstrated that it is possible to suppress the amplification of the fluoroquinolone-resistant subpopulation in P. aeruginosa at least early on in therapy. We wished to extend this finding into the clinic. We calculated the extent to which current drugs and dosing regimens for patients also suppress the emergence of resistance in this pathogen. Data from our laboratory have demonstrated that drug exposures in animals that drive a specific degree of microbiological effect are predictive of the necessary exposures in humans (24–26). A 10,000-subject Monte Carlo simulation predicted that the overall attainment of the target exposure for suppression of Pseudomonas resistance was 61.2% for a levofloxacin regimen of 750 mg intravenously daily. To put this into perspective, we performed a similar simulation for ciprofloxacin (another fluoroquinolone antimicrobial) for a regimen of 400 mg IV every 8 hours (27), with a target-exposure attainment of 61.8%. Both simulations were derived from data collected from patients with nosocomial pneumonia. No other fluoroquinolone, at any approved dose, would attain this target at a higher rate.
Indeed, the technique of Monte Carlo simulation predicts well. We could not verify our prediction derived from the Monte Carlo simulation from clinical study data with levofloxacin (21), because, when P. aeruginosa was identified in the course of that study, a second drug was added. However, Peloquin et al. studied ciprofloxacin alone at a dose of 200 mg intravenously every 12 hours (28). They reported a resistance rate of 70% for P. aeruginosa (n = 10) in patients with nosocomial pneumonia and reported the ciprofloxacin MICs. We performed a second ciprofloxacin Monte Carlo simulation for this dose and schedule. It predicts that an AUC/MIC ratio of 157 will be attained at a rate of 24.8% (likelihood of resistance 75.2%). This is in good concordance with the observed outcome that seven of ten patients had emergence of pseudomonal resistance. Likewise, a study by Fink et al. (29) employed a ciprofloxacin dose of 400 mg intravenously every 8 hours. The prediction for prevention of Pseudomonas resistance was 61.8% (see above), while the observed resistance rate was 33% (12/36; 67% not resistant).
Other laboratories, particularly Drlica’s, have noted the importance of addressing the issue of suppression of resistance (7, 30). Their studies were in vitro. Our study investigated the development of fluoroquinolone resistance in a Gram-negative pathogen, P. aeruginosa, in vivo. A mathematical model that describes changes in drug concentrations and bacterial subpopulations over time was developed and prospectively validated. The model enabled (a) the description of the change over time with different drug doses in bacterial subpopulations, (b) the determination of a dose and subsequent exposure that prevent the amplification of the resistant subpopulation by drug pressure, and, most importantly, (c) accurate prediction of subpopulation responses to time frames of therapy and doses not previously studied. The identified target values associated with suppression of resistance in a mouse infection model were used to evaluate clinical drug doses using Monte Carlo simulation. The probability of prevention of emergence of resistance was estimated for clinical patients.
Clearly, while the search continues for new classes of antimicrobial agents to which no resistance currently exists, development of drug-dosing methods to prevent or delay the emergence of resistance like the one described in this study will prolong the utility of currently available anti-infective agents. Such rational dosing-regimen design preserves the sensitivity of the infecting flora to the drug, thus benefiting subsequent patients. Horizontal transmission is minimized, because the first-stage mutants are suppressed. The approach is quite general and may be applied for any new drug to determine the optimal doses that minimize emergence of resistance. This is simply done by identifying the resistance-suppression drug-exposure target and employing population pharmacokinetic information to evaluate candidate doses for their ability to achieve the drug-exposure target over the range of clinically observed MIC values.
Supplementary Material
Acknowledgments
This study was supported by a grant from Ortho-McNeil Pharmaceutical.
Footnotes
Conflict of interest: George L. Drusano is a consultant to both Johnson & Johnson Pharmaceutical Research & Development and Ortho-McNeil Pharmaceutical and receives research support from both companies. Karen Bush is an employee of Johnson & Johnson Pharmaceutical Research & Development and owns stock and stock options. James B. Kahn is an employee of Ortho-McNeil Pharmaceutical and owns stock and stock options.
Nonstandard abbreviations used: minimum inhibitory concentration (MIC); Mueller-Hinton II broth (MHB); minimum bactericidal concentration (MBC); area under the concentration time curve (AUC); nonparametric expectation maximization 2 (NPEM2); maximum a posteriori probability (MAP); quinolone resistance–determining region (QRDR).
References
- 1.Eagle H, Fleischman R, Levy M. Continuous versus discontinuous therapy with penicillin: the effect of interval between injections on therapeutic efficacy. N. Engl. J. Med. 1953;248:481–488. doi: 10.1056/NEJM195303192481201. [DOI] [PubMed] [Google Scholar]
- 2.Craig WA. Pharmacokinetic/pharmacodynamic parameters: rationale for antibiotic dosing of mice and men. Clin. Infect. Dis. 1998;26:1–10. doi: 10.1086/516284. [DOI] [PubMed] [Google Scholar]
- 3.Craig WA. Does the dose matter? Clin. Infect. Dis. 2001;33(Suppl. 3):S233–S237. doi: 10.1086/321854. [DOI] [PubMed] [Google Scholar]
- 4.Jourdain B, et al. Role of quantitative cultures of endotracheal aspirates in the diagnosis of nosocomial pneumonia. Am. J. Respir. Crit. Care Med. 1995;152:241–246. doi: 10.1164/ajrccm.152.1.7599831. [DOI] [PubMed] [Google Scholar]
- 5.Lipsitch M, Levin BR. The population dynamics of antimicrobial chemotherapy. Antimicrob. Agents Chemother. 1997;41:363–373. doi: 10.1128/aac.41.2.363. [DOI] [PMC free article] [PubMed] [Google Scholar]
- 6.Blondeau JM, Zhao X, Hansen G, Drlica K. Mutant prevention concentrations of fluoroquinolones for clinical isolates of Streptococcus pneumoniae. Antimicrob. Agents Chemother. 2001;45:433–438. doi: 10.1128/AAC.45.2.433-438.2001. [DOI] [PMC free article] [PubMed] [Google Scholar]
- 7.Zhou J, et al. Selection of antibiotic-resistant bacterial mutants: allelic diversity among fluoroquinolone-resistant mutants. J. Infect. Dis. 2000;182:517–525. doi: 10.1086/315708. [DOI] [PubMed] [Google Scholar]
- 8.Drlica K, Engle EC, Manes SH. DNA gyrase on the bacterial chromosome: possibility of two levels of action. Proc. Natl. Acad. Sci. U. S. A. 1980;77:6879–6883. doi: 10.1073/pnas.77.11.6879. [DOI] [PMC free article] [PubMed] [Google Scholar]
- 9.Paulsen IT, Brown MH, Skurray RA. Proton-dependent multidrug efflux systems. Microbiol. Rev. 1996;60:575–608. doi: 10.1128/mr.60.4.575-608.1996. [DOI] [PMC free article] [PubMed] [Google Scholar]
- 10.Munoz R, De La Campa AG. ParC subunit of DNA topoisomerase IV of Streptococcus pneumoniae is a primary target of fluoroquinolones and cooperates with DNA gyrase A subunit in forming resistance phenotype. Antimicrob. Agents Chemother. 1996;40:2252–2257. doi: 10.1128/aac.40.10.2252. [DOI] [PMC free article] [PubMed] [Google Scholar]
- 11.Nikaido H. Prevention of drug access to bacterial targets: permeability barriers and active efflux. Science. 1994;264:382–388. doi: 10.1126/science.8153625. [DOI] [PubMed] [Google Scholar]
- 12.Ng EY, Trucksis M, Hooper DC. Quinolone resistance mutations in topoisomerase IV: relationship to the flqA locus and genetic evidence that topoisomerase IV is the primary target and DNA gyrase is the secondary target of fluoroquinolones in Staphylococcus aureus. Antimicrob. Agents Chemother. 1996;40:1881–1888. doi: 10.1128/aac.40.8.1881. [DOI] [PMC free article] [PubMed] [Google Scholar]
- 13.Lomovskaya O, et al. Identification and characterization of inhibitors of multidrug resistance efflux pumps in Pseudomonas aeruginosa: novel agents for combination therapy. Antimicrob. Agents Chemother. 2001;45:105–116. doi: 10.1128/AAC.45.1.105-116.2001. [DOI] [PMC free article] [PubMed] [Google Scholar]
- 14.D’Argenio, D.Z., and Schumitzky, A. 1997. ADAPT II. A program for simulation, identification, and optimal experimental design. User manual. Biomedical Simulations Resource, University of Southern California, Los Angeles, California, USA. http://bmsr.usc.edu/.
- 15.Wong FA, Juzwin SJ, Flor SC. Rapid stereospecific high-performance liquid chromatographic determination of levofloxacin in human plasma and urine. J. Pharm. Biomed. Anal. 1997;15:765–771. doi: 10.1016/s0731-7085(96)01890-0. [DOI] [PubMed] [Google Scholar]
- 16.Schumitzky A, Jelliffe R, van Guilder M. NPEM: a program for pharmacokinetic population analysis. Clin. Pharmacol. Ther. 1994;55:163. (Abstr.) [Google Scholar]
- 17.Yamaoko K, Nakagawa T, Uno T. Application of Akaike’s Information Criterion in the evaluation of linear pharmacokinetic equations. J. Pharmacokinet. Biopharm. 1978;6:165–175. doi: 10.1007/BF01117450. [DOI] [PubMed] [Google Scholar]
- 18.Kureishi A, Diver JM, Beckthold B, Schollardt T, Bryan LE. Cloning and nucleotide sequence of Pseudomonas aeruginosa DNA gyrase gyrA gene from strain PAO1 and quinolone-resistant clinical isolates. Antimicrob. Agents Chemother. 1994;38:1944–1952. doi: 10.1128/aac.38.9.1944. [DOI] [PMC free article] [PubMed] [Google Scholar]
- 19.Nakano M, et al. Mutations in the gyrA and parC genes in fluoroquinolone-resistant clinical isolates of Pseudomonas aeruginosa. Antimicrob. Agents Chemother. 1997;41:2289–2291. doi: 10.1128/aac.41.10.2289. [DOI] [PMC free article] [PubMed] [Google Scholar]
- 20.Lomovskaya O, Watkins W. Inhibition of efflux pumps as a novel approach to combat drug resistance in bacteria. J. Mol. Microbiol. Biotechnol. 2001;3:225–236. [PubMed] [Google Scholar]
- 21.Drusano, G.L., et al. 2002. Target attainment analysis for levofloxacin 750 mg IV daily for nosocomial pneumonia using Monte Carlo simulation for common Gram-negative pathogens. Proceedings of the 43rd Interscience Conference on Antimicrobial Agents and Chemotherapy. September 25–29, 2002, San Diego, California, USA. American Society for Microbiology, Washington, DC, USA. Abstract A-638.
- 22.Chow J, et al. Enterobacter bacteremia: clinical features and emergence of antibiotic resistance during therapy. Ann. Intern. Med. 1991;115:585–590. doi: 10.7326/0003-4819-115-8-585. [DOI] [PubMed] [Google Scholar]
- 23.Kohler T, Michea-Hamzehpour M, Plesiat P, Kahr A-L, Pechere J-C. Differential selection of multidrug efflux systems by quinolones in Pseudomonas aeruginosa. Antimicrob. Agents Chemother. 1997;41:2540–2543. doi: 10.1128/aac.41.11.2540. [DOI] [PMC free article] [PubMed] [Google Scholar]
- 24.Drusano GL, Johnson DE, Rosen M, Standiford HC. Pharmacodynamics of a fluoroquinolone antimicrobial in a neutropenic rat model of Pseudomonas sepsis. Antimicrob. Agents Chemother. 1993;37:483–490. doi: 10.1128/aac.37.3.483. [DOI] [PMC free article] [PubMed] [Google Scholar]
- 25.Preston SL, et al. Pharmacodynamics of levofloxacin: a new paradigm for early clinical trials. JAMA. 1998;279:125–129. doi: 10.1001/jama.279.2.125. [DOI] [PubMed] [Google Scholar]
- 26.Drusano GL, et al. Use of preclinical data for the choice of a Phase II/III dose for evernimicin with application to decision support for identification of a preclinical MIC breakpoint. Antimicrob. Agents Chemother. 2001;45:13–22. doi: 10.1128/AAC.45.1.13-22.2001. [DOI] [PMC free article] [PubMed] [Google Scholar]
- 27.Forrest A, Ballow CH, Nix DE, Birmingham MC, Schentag JJ. Development of a population pharmacokinetic model and optimal sampling strategies for intravenous ciprofloxacin. Antimicrob. Agents Chemother. 1993;37:1065–1072. doi: 10.1128/aac.37.5.1065. [DOI] [PMC free article] [PubMed] [Google Scholar]
- 28.Peloquin CA, Cumbo TJ, Nix DE, Sands MF, Schentag JJ. Evaluation of intravenous ciprofloxacin in patients with nosocomial lower respiratory tract infections: impact of plasma concentration and clinical condition on bacterial eradication. Arch. Intern. Med. 1989;149:2269–2273. [PubMed] [Google Scholar]
- 29.Fink MS, et al. Treatment of severe pneumonia in hospitalized patients: results of a randomized, double-blind trial comparing intravenous ciprofloxacin with imipenem-cilastatin. Antimicrob. Agents Chemother. 1994;38:547–557. doi: 10.1128/aac.38.3.547. [DOI] [PMC free article] [PubMed] [Google Scholar]
- 30.Sindelar G, et al. Mutation prevention concentration as a measure of fluoroquinolone potency against Mycobacteria. Antimicrob. Agents Chemother. 2000;44:3337–3343. doi: 10.1128/aac.44.12.3337-3343.2000. [DOI] [PMC free article] [PubMed] [Google Scholar]
Associated Data
This section collects any data citations, data availability statements, or supplementary materials included in this article.


