

Abstract
Objective: To show the relationship between direct measurements of tibial-calcaneal bone motion and instrumented measurements of ankle-subtalar-joint–complex laxity using a portable ankle arthrometer; to assess within and between-tester measurement reliability; and to determine if the ankle arthrometer can detect increased mechanical laxity of the ankle-subtalar-joint–complex after simulated injury of the lateral ankle ligaments.
Design and Setting: We used linear regression analysis to examine the relationship between direct measurements of tibial-calcaneal bone motion and instrumented measurements of ankle-subtalar-joint–complex laxity. An intraclass correlation coefficient (2,1) was calculated to determine intratester and intertester reliability for instrumented measurements of ankle-subtalar-joint–complex laxity. In addition, 2 separate, one-way, repeated-measures analyses of variance were used to compare instrumented measures of anteroposterior displacement and inversion-eversion rotation among the intact ankles after sectioning the anterior talofibular ligament and both the anterior talofibular and calcaneofibular ligaments. Data were collected in a biomechanics laboratory setting.
Subjects: Six fresh-frozen human-cadaver ankle specimens were studied.
Measurements: Testing involved the concurrent measurement of tibial-calcaneal bone motion and ankle-subtalar-joint–complex motion during the application of external loads. An instrumented ankle arthrometer was used to load the ankle in a controlled manner. Two spatial kinematic linkages measured the 3-dimensional motion of the calcaneus relative to the tibia and the motion of the arthrometer's footplate relative to the tibia.
Results: The correlation between tibial-calcaneal bone motion and instrumented measurement for anterior-posterior displacement was .878 (P = .0001). Its linear relationship with bone motion accounted for approximately 77% of the variance of the instrumented measurement. The correlation between tibial-calcaneal bone motion and instrumented measurement for inversion-eversion rotation was .858 (P = .0001), with approximately 74% of the variance of the instrumented measurement accounted for by its linear relationship with bone motion. High intratester and intertester reliability coefficients (ICC [2,1] = .80 to .97) were observed for instrumented measurements of ankle-subtalar-joint–complex laxity. In addition, ligamentous sectioning resulted in significantly increased ankle-subtalar-joint–complex laxity. When compared with the intact condition, sectioning both the anterior talofibular and calcaneofibular ligaments produced significant increases in anterior-posterior displacement (P = .0001) and inversion-eversion rotation (P = .002).
Conclusions: We found a strong relationship between tibial-calcaneal bone motion and arthrometric measurements of ankle-subtalar-joint–complex laxity. The instrumented ankle arthrometer may be suitable as a diagnostic tool for the evaluation of lateral ankle-ligament laxity.
Keywords: mechanical laxity measurement, ankle instability, ankle sprain, ankle displacement
Lateral ankle-ligament sprains frequently involve an inversion mechanism or ankle hypersupination as the ankle undergoes abnormal plantar flexion, inversion, and internal rotation in the weight-bearing position.1,2 Although we treat most lateral ankle sprains effectively with physical rehabilitation and nonoperative treatment, more severe sprains involving complete tears of the anterior talofibular ligament (ATFL) and calcaneofibular ligament (CFL) may lead to chronic instability and subsequent disability.3–5 These injuries can often be treated satisfactorily with late repair or reconstruction.6–8, However, despite surgical intervention, some patients continue to experience chronic disability, including mechanical and functional instability, pain, motion loss, or weakness.9, 10–14
Incompetence of the lateral talocrural ligaments has been shown to affect normal talocrural (ankle) joint motion. Lateral ankle instability can disrupt the normal gliding motion during the swing phase of walking and produce anterolateral rotational instability that permits the talus to rotate internally and subluxate anteriorly on the tibia.15–18 Associated injuries found in chronic lateral ankle instability include anterolateral impingement lesion, attenuated peroneal retinaculum, and ankle synovitis.12 Furthermore, the lateral ligaments of the talocalcaneal (subtalar) joint may also be injured during lateral ankle sprain, leading to subtalar-joint instability.1,16,17,19,20
In detecting lateral-ligament abnormalities in patients with suspected acute and chronic ankle-subtalar instability, several diagnostic methods are helpful for making treatment and surgical decisions. Magnetic resonance imaging provides significant anatomic detail to evaluate disorders of the soft tissues and osseous structures of the ankle,21 and magnetic resonance imaging arthrography is a sensitive technique for detecting tears of the lateral collateral ligaments.22,23 Although these diagnostic tools are recognized as the modalities of choice for assessing pathologic conditions of the ankle, treatment is often based on the amount of ankle instability observed during the clinical examination.
Clinical assessment of ankle-joint and subtalar-joint laxity typically involves manual examination techniques such as the anterior drawer, talar tilt, and inversion-eversion stress tests.1,24–28 The inherent subjectivity of manual examination along with limitations in differentiating the degree of lateral ankle-ligament stability make manual stress tests inaccurate for diagnosing specific ligament involvement.29 In addition, stress radiography for assessing ankle mechanical laxity has been shown to be unreliable despite its use in numerous ankle-ligament injury studies.1,15–17,30–34 Stress radiography using a calibrated loading device allows for reproducible force application and patient positioning but does not provide direct linear and angular measurements. Subjective evaluation can lead to inadequate treatment after lateral ankle injury, which can result in chronic instability. Therefore, accurate clinical diagnosis is imperative in differentiating mechanical laxity among grades of lateral ankle sprain. Further investigation using other reliable and quantifiable techniques for measuring lateral ankle laxity is needed.
Ankle-subtalar-joint–complex laxity has been studied using 3-dimensional kinematics, pneumatic loading, and spatial kinematic methods by applying forces and moments across the joint and measuring the resulting displacements.35–43 Recently, a 6-degrees-of-freedom, spatial kinematic instrumented linkage has been described as a suitable evaluation tool for ankle-ligament laxity.35,36,44 We35 reported on an instrumented ankle arthrometer for clinical use that quantifies the anteroposterior load-displacement and inversion-eversion rotational laxity characteristics of the ankle-subtalar-joint complex. The arthrometer measures all components of ankle-subtalar-joint complex36,42,43 motion: 3 rotations and 3 translations.35,36,44,45 A foot-clamp frame is secured to the patient's foot, and a point of reference is established on the tibia with a shin pad secured to the calf by restraining straps. During measurement, the force and torque loads produced via the arthrometer's loading handle are transferred to the skeletal and soft tissues of the ankle-subtalar-joint complex. The spatial kinematic linkage attached to the overlying skin via the ankle arthrometer measures the relative motion between the arthrometer footplate and the reference pad placed on the tibia.44,45
We35 have reported ankle-subtalar-joint–complex laxity in uninjured subjects using a portable ankle arthrometer. High intratester reliability coefficients for anteroposterior (AP) displacement (range, .82 to .89) and inversion-eversion (I-E) rotation (range, .86 to .97) were found. However, measurement validity and intertester reliability have not been examined. In this paper, we report the relationship between tibial-calcaneal bone motion (skeletal motion) and instrumented measurement of ankle-subtalar-joint–complex laxity. To measure skeletal motion, the spatial kinematic linkage must be attached directly to bone to follow and monitor the relative positions between the 2 bone segments to which it is attached. We theorized that the arthrometric measures of displacement and rotation would be greater but associated with skeletal motion because of the ankle arthrometer attached to the overlying skin of the foot and the soft tissues located between the arthrometric device and the skeleton.36,44,46,47
The load-displacement and mobility characteristics of the ligamentous structures of the ankle complex and their individual contributions to the mechanical stability of the joint have traditionally been studied by sequential sectioning of the lateral ligamentous structures. In cadaveric studies, researchers24,25,36,41,48–52 have documented the motion patterns of the ankle joint, subtalar joint, and ankle-subtalar-joint complex, first with intact ligaments and then after sectioning the ATFL and CFL. It is possible to distinguish among grades of lateral ligamentous damage by examining bone-to-bone motion along with ankle-subtalar-joint–complex laxity. The load-displacement and laxity characteristics of the ankle-subtalar-joint complex before and after sectioning of the ATFL and CFL have not been shown using the ankle arthrometer.
Objective and reliable measurements of mechanical laxity could provide a greater understanding of ankle-subtalar-joint–complex laxity after injury. Our major goal was to assess a portable instrumented ankle arthrometer as a tool in the evaluation of lateral ankle ligamentous laxity. The primary objective was to show the relationship between direct measurements of tibial-calcaneal bone motion and instrumented measurements of ankle-subtalar-joint–complex laxity. The second objective was to assess intratester and intertester measurement reliability to determine the applicability of the ankle arthrometer for clinical use. The third objective was to determine if the ankle arthrometer can detect increased ankle-subtalar-joint–complex laxity after simulated injury of the lateral ankle ligaments.
METHODS
Our experimental protocol involved the concurrent measurement of tibial-calcaneal bone (skeletal) motion and instrumented ankle-subtalar-joint–complex laxity during the application of external loads to human-cadaveric ankle specimens. An instrumented ankle arthrometer was used to load the ankle in a controlled manner (Figure 1). Each session consisted of testing the intact ankle first, followed by 2 simulated injury conditions that involved sectioning the ATFL and then the CFL.
Figure 1.

Specimen testing position and instrumentation set-up showing the portable ankle arthrometer and the bone-to-bone 6-degrees-of-freedom (D.O.F.) spatial kinematic linkage.
Specimens
Six fresh-frozen human-cadaveric ankles (mean donor age, 67 years) without clinical evidence of ligamentous injury were harvested for study. The lower leg was separated from the rest of the limb approximately 25 cm above the ankle joint and frozen at −20°C.
Instrumentation
In order to measure tibial-calcaneal bone motion and ankle-subtalar-joint–complex laxity, 2 separate spatial kinematic linkages were used. A spatial kinematic linkage is a 6-degrees-of-freedom electrogoniometer that measures 3-dimensional motion.35,36,44,45 A bone linkage was attached directly to the tibia and the calcaneus, and a second linkage was incorporated into the instrumented ankle arthrometer. The bone spatial linkage measured motion of the 2 ends of the linkage, thus measuring calcaneal motion relative to the tibia (ie, ankle and subtalar bone motion) (Figure 2).36,44,45 The arthrometer spatial linkage connected the tibial pad to the footplate and measured the motion of the footplate relative to the tibial pad.35,36 The arthrometric measurements reflect relative motion of the bones and underlying soft tissues of the ankle-subtalar-joint complex.36
Figure 2.

Tibial-calcaneal bone 6-degrees-of-freedom (D.O.F.) spatial kinematic linkage.
The ankle arthrometer consisted of an adjustable plate fixed to the foot, a load-measuring handle attached to the footplate through which the load was applied, and a tibial pad attached to the tibia. A computer with an analog-to-digital converter was used to simultaneously calculate and record the data. The resulting AP displacement (millimeters) and I-E rotation (degrees of range of motion) from the tibial-calcaneal bone linkage and instrumented arthrometer linkage, along with the corresponding AP load and I-E torque, were recorded. We used a custom software program written in LabVIEW (National Instruments Corp, Austin, TX) for data collection.
Experimental Setup
The specimen was thawed to room temperature before testing and a tibial rod screwed into the medullary cavity of the tibia down to 3 to 5 cm above the ankle joint. The rod was further fixed into the bone with screws inserted perpendicular through the tibia and the rod. Before mounting, the muscles and the soft tissues of the posterior calf were dissected to expose the posterior tibia and calcaneus. This allowed for the attachment of the bone spatial kinematic linkage via bone plates that were screwed into the calcaneus and the tibia (see Figure 2). Each specimen was secured in a vice so that the lower leg was positioned parallel to the floor and the foot was positioned vertically (0° flexion angle) to the floor so that it extended over the edge of the table. A restraining strap attached to the support bar beneath the ankle was secured around the distal lower leg 1 cm above the malleoli and tightened to prevent lower leg movement during testing (see Figure 1). The specimens were mounted at the proximal end of the tibial rod to a table clamp that allowed full freedom of motion of the ankle and subtalar joints.
Test Protocol
One examiner (J.E.K.) tested all ankles following a testing protocol previously described.35 The examiner placed the bottom of the foot onto the footplate and adjusted a dorsal foot clamp on the forefoot until it compressed the heel against a posterior heel pad. Medial and lateral heel clamps were then adjusted to grip the sides of the calcaneus. The dorsal foot clamp rested over the area of the talonavicular joint and secured the foot posteriorly and distally. The dorsal foot clamp, in combination with the plate under the plantar surface of the foot and the medial, lateral, and posterior heel pads, held the hindfoot and midfoot securely. The tibial pad was then positioned 5 cm above the ankle malleoli and secured to the lower leg using restraining straps. In order to minimize the variation among the forces applied to the ankles, the arthrometer was oriented in a similar manner on each foot for all tests.
The ankles were positioned at zero AP load and zero I-E moment at a neutral (0°) flexion angle, which was defined as the measurement reference position.35,36 The other degrees of freedom (internal-external, medial-lateral, and proximal-distal) were also maintained at their zero-load neutral position during testing. Thus, the measurement reference position represented zero moment and force loads. Foot motion anterior to the measurement reference position was defined as anterior displacement and motion posterior to that position as posterior displacement. Total AP displacement was the sum of the anterior and posterior translation at a given force load. Total I-E rotation was the sum of the inversion and eversion rotation for a given torque load. High reliability of measurement has been shown for total laxity versus one-way laxity around the neutral, unloaded ankle-joint complex.37 Thus, total AP displacement and total I-E rotation are reported as ankle-subtalar-joint–complex laxity.
The ankles were loaded first in AP drawer and then in heel I-E at neutral (0° flexion angle). This angle was measured from the plantar surface of the foot relative to the anterior tibia and determined by the 6-degrees-of-freedom electrogoniometer within the instrumented linkage. Anteroposterior loading, I-E torque, and the flexion angle were applied through the load handle in line with the footplate by the examiner. For AP displacement, the ankles were loaded to 125 N with both anterior and posterior forces. Starting at the neutral position, anterior loading was applied first, followed by posterior loading. Displacement of the calcaneus (mm) in AP motion, as applied by the load handle, was recorded along with the load. Total AP displacement at the 125-N force load was recorded and defined as AP laxity. For I-E rotation, the ankles were loaded to 4000 N-mm with inversion and eversion torque. Starting at the neutral position, inversion loading was applied first, followed by eversion loading. Rotation (degrees of range of motion) of the calcaneus, as applied by the load handle, was recorded along with the torque. Total I-E rotation at 4000 N-mm was recorded and defined as I-E laxity. By watching the computer monitor, the examiner could visualize the applied load to obtain a maximum of 125 N for AP displacement and 4000 N-mm for I-E rotation35 (Figure 3).
Figure 3.
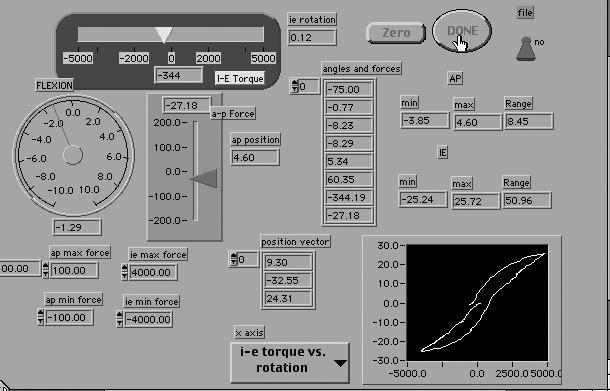
Screen image of ankle arthrometer program.
Procedure for Intratester and Intertester Measurements
To determine intratester and intertester reliability of the ankle ligament arthrometer, 2 examiners (J.E.K. and J.M.H.) tested the intact ankles, with the order of testing randomly assigned between the examiners. Anteroposterior loading was performed first, followed by I-E loading. The ankle arthrometer was removed after both AP and I-E loading sequences were completed and was reapplied by the examiner before the measurement was repeated.
Procedure for Simulated Lateral-Ankle Injury
After testing the intact ankle-subtalar-joint complex, the ATFL was sectioned, simulating injury, and the testing repeated. The ATFL was visualized along its length from the anterior edge of the lateral malleolus to the lateral aspect of the talar neck. Calcaneofibular-ligament sectioning followed, and the testing was repeated. The CFL was visualized along its length from the anterior edge of the fibular malleolus obliquely distal, posterior, and medial to the midlateral surface of the calcaneus.53 Minimal soft tissue dissection was performed to expose the ligaments, with each ligament sectioned between midsubstance and its proximal attachment.
Statistical Analysis
A linear regression analysis was conducted to evaluate the relationship between tibial-calcaneal bone motion and instrumented measurements for AP displacement and I-E rotation. An intraclass correlation coefficient (ICC 2,1) was used to determine intratester and intertester reliability for instrumented measurement of AP displacement and I-E rotation. An intraclass correlation coefficient of .75 or greater was considered high reliability.54 The standard error of measurement was also calculated to provide an estimate of measurement precision.55
Two separate, one-way, repeated-measures analyses of variance were calculated to determine the effects of ligamentous injury on instrumented measures of AP displacement and I-E rotation. The independent variable, ankle-subtalar-joint integrity, had 3 levels: intact ankle, ATFL sectioned, and ATFL and CFL sectioned. The dependent variables were total AP displacement (mm) and I-E rotation (degrees of range of motion). The Bonferroni post hoc procedure was used to identify differences between injury conditions. An α level of P < .05 was set for all analyses.
RESULTS
Bone Motion and Arthrometric Correlations
Total AP displacement and I-E rotation between tibial-calcaneal bone motion and instrumented measurements of ankle-subtalar-joint–complex laxity are presented in Table 1.
Table 1. Total Anteroposterior Displacement (mm) and Inversion-Eversion Rotation (Degrees) for Skeletal Motion (Tibial-Calcaneal Bone Motion) and Instrumented Measurements of Ankle-Subtalar-Joint–Complex Laxity*
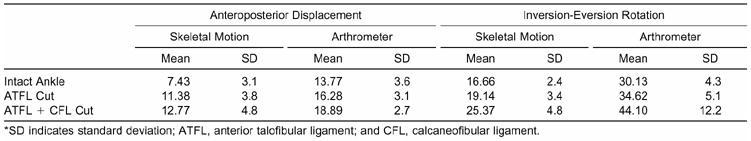
The linear regression analyses showed a strong relationship between tibial-calcaneal bone motion and arthrometric measurements of ankle-subtalar-joint–complex laxity: .878, t16 = 7.36, P = .001. Approximately 77% of the variance of the instrumented measurement was accounted for by its linear relationship with bone motion. The correlation between tibial-calcaneal bone motion and instrumented measurement for I-E rotation was .858, t16 = 6.67, P = .001. Approximately 74% of the variance of the instrumented measurement was accounted for by its linear relationship with bone motion.
Arthrometric Measurement Reliability
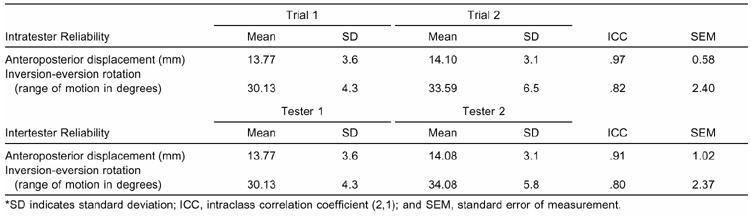
The AP displacement and I-E rotation correlation coefficients indicated high reliability ([ICC 2,1] = .80 to .97) for both the intratester and intertester trials. Means (±SD) and reliability coefficients for instrumented measures of AP displacement and I-E rotation are presented in Table 2.
Table 2. Intratester and Intertester Measurements for Anteroposterior Displacement and Inversion-Eversion Rotation*
Arthrometric Measurements After Simulated Injury
The AP laxity analysis of variance revealed a significant main effect for ankle-subtalar-joint–complex integrity (F2,10 = 18.81, P = .001, η2 = .79). Compared with the intact condition, sequentially cutting the ATFL and the ATFL + CFL produced significant increases in total AP laxity. Ankle-subtalar-joint–complex laxity increased 2.51 mm (Bonferroni P = .046) in AP displacement after the ATFL was sectioned and 5.12 mm (Bonferroni P = .003) after the CFL was sectioned. An example of AP-displacement differences between the intact ankle and after sectioning the ATFL for 1 specimen is shown in Figure 4.
Figure 4.

Anteroposterior force-displacement curve of the intact ankle and after sectioning the anterior talofibular ligament (ATFL) from 1 specimen. Total laxity is the displacement (mm) between +125 (anterior) and −125 (posterior) N force loads. Note: Observe the large increase in anterior displacement after sectioning the ATFL versus the intact ankle.
For I-E loading, the injury effect was significant (F2,10 = 12.64, P = .002, η2 = .716). In total I-E rotation, range of motion increased significantly by 4.5° (Bonferroni P = .013) after ATFL sectioning compared with the intact ankle. With sectioning of the CFL in addition to the ATFL, range of motion increased significantly by 13.97° (Bonferroni P = .026) compared with the intact ankle. Figure 5 shows I-E rotation differences between the intact ankle and after sectioning the ATFL and CFL for 1 specimen.
Figure 5.

Inversion-eversion moment rotation curve of the intact ankle and after sectioning the anterior talofibular (ATFL) and calcaneofibular (CFL) ligaments from 1 specimen. Total laxity is the rotation (range of motion in degrees) between +4000 (inversion) and −4000 (eversion) N-mm torque loads. Note: Observe the large increase in inversion rotation after sectioning the ATFL + CFL versus the intact ankle.
DISCUSSION
The ATFL and CFL primarily maintain lateral joint stability in the normal ankle. Important changes occur in ankle stability with tearing of one or both of these ligaments. The relative magnitudes of the changes induced by these disruptions are often difficult to quantify and evaluate.29,52 Manual techniques for assessing ankle-subtalar-joint–complex laxity involve applying unknown forces and moments to the ankle and observing the resulting displacements and rotations. Although many clinicians become skilled in evaluating ligamentous injuries and develop a qualitative “feel” for laxity, the examination procedure is largely subjective, and its reliability depends on the skill and experience of the examiner.56,57 Our findings support the use of the ankle arthrometer to quantifiably measure ankle-subtalar-joint–complex laxity.
The use of the portable ankle arthrometer to quantify ankle-subtalar-joint–complex laxity is possible due to the development of an instrumented spatial linkage that measures 3-dimensional ankle motion. Because all joints of the human body permit 6 degrees of freedom to varying extents, all 6 must be taken into account to accurately measure motion at the joint.44,45 The spatial linkage connected to the ankle arthrometer measured the 6-degrees-of-freedom motion of the footplate relative to the tibial pad. Skeletal motion was also of interest, and the bone spatial linkage was attached directly to the bone, thereby measuring tibial-calcaneal bone motion. The 2 linkage systems followed and monitored the relative positions between the 2 body segments to which each was attached. The motion measurements obtained from the ankle-arthrometer linkage system were higher than the skeletal motions due to motion within the soft tissue, between the arthrometer pads, and of the bones.45–47 Between 74% and 77% of the variance of the arthrometric measurement about the mean resulted from joint motion, as measured by the bone-to-bone linkage. Therefore, the variation in arthrometer measurement was due primarily to variations in bone-to-bone motion. Because the ankle arthrometer was attached to the overlying skin, the linkage measured relative motions between the tibial pad and the footplate. Thus, the compliance characteristics of the overlying soft tissues were measured along with joint motion. Ankle-subtalar-joint–complex laxity, as measured by the ankle arthrometer, included both bone-to-bone motion and soft tissue motion. This accounts for the systematic differences observed between the tibial-calcaneal bone motion and arthrometric measurements of ankle-subtalar-joint–complex laxity.
The clinical use of instrumented arthrometry for detecting and differentiating lateral ligamentous laxity of the ankle-subtalar-joint–complex requires the establishment of reliable measurements.35,38,40 Theoretically, instrumented measurement of ankle-complex laxity might be used to determine the appropriate direction of treatment for the patient, whether it be operative or nonoperative. Also, objective measurement may be used to quantitatively assess outcome in terms of joint stability after treatment of the ankle injury. If used as a tool to determine treatment and outcome for the individual patient, the ankle arthrometer must be found to be reliable before clinical use can be justified. Two reports have examined in vivo test-retest reliability of the portable ankle arthrometer for measuring ankle-subtalar-joint–complex laxity. Kovaleski et al35 reported reliability coefficients and joint-laxity characteristics of 82 ankles with no previous history of ankle injury. High reliability coefficients were found across different force loads for total AP displacement (range, .82 to .89) and I-E rotation (range, .86 to .97). DiSanto et al40 examined measurement reliability using the instrumented ankle arthrometer in 44 subjects with either stable or unstable ankles. Correlation coefficients for AP displacement (r = .44 to .87) and inversion-eversion rotation (r = .82 to .95) were generally high. In comparison with these 2 earlier studies, the intratester and intertester measurements of reliability in the current study are comparable with the within-tester measurements we previously reported35 and somewhat higher than those reported by DiSanto et al.40
We also determined standard errors of measurement for AP displacement (intratester = 0.58 mm, intertester = 1.02 mm) and I-E rotation (intratester = 2.4°, intertester = 2.37°). The low standard error scores (AP displacement = 1.94 mm, I-E rotation = 2.84 degrees) reported from our earlier study in vivo,35 along with the small standard error scores obtained in the present study, lend support to the precision of instrumented measurement of ankle-subtalar-joint–complex laxity. This suggests that any inconsistency of measurement (intratester or intertester) occurs in an acceptably small range of laxity values. However, our reliability findings are limited to the 6 cadaveric samples studied.
We identified several factors that could affect reliability measurement of ankle-subtalar-joint–complex laxity and might explain clinical-measurement differences. These factors include ankle-flexion angle, magnitude of loading, direction of the displacement or rotation force, and limb muscle tonus (relaxation).35,36,45 Examiner experience with instrumented measurement of joint laxity can also result in measurement differences. Two testers experienced in using the ankle arthrometer for assessing ankle-subtalar-joint–complex laxity examined all specimens in the current study. Together, the high reliability coefficients and low standard errors of measurement demonstrated small measurement differences between testers.
Simulated Injury
In several in vitro biomechanical studies, researchers* have examined the effects of ligament sectioning on laxity of the ankle and subtalar joints. Less research is reported on the effects of ligament sectioning on ankle-subtalar-joint–complex laxity.36,38,41,50,60 Measuring the relationship between ligament damage and mechanical laxity by simulating ligamentous injury could improve our understanding of ankle motion and the effect ligament damage has in producing ankle-subtalar-joint instability. Therefore, we believed it clinically important to examine this device using cadaver specimens in which we could study different imposed laxity conditions.
Ankle lateral-ligament injury produced statistically significant changes in ankle-subtalar-joint–complex laxity. The ankle arthrometer can detect changes in mechanical laxity produced by damage to the ATFL and CFL. Sectioning the ATFL significantly increased mean AP displacement by 15.4% and sequentially sectioning the CFL increased mean AP displacement by 27.1% compared with the intact ankle. Inversion-eversion rotation significantly increased 13.0% after sectioning the ATFL and 31.7% after sectioning the ATFL and CFL when compared with the intact ankle. After the CFL was sectioned, AP displacement increased 13.8% and I-E rotation increased 21.5% compared with the ATFL-sectioned condition. These findings agree with other experimental studies that showed increased ankle-subtalar-joint–complex laxity after sectioning the lateral ankle ligaments.36,41,50
Hollis et al36 found significant increases in mechanical laxity after sectioning of the ATFL with both AP and I-E loading. In addition, they reported that sectioning of the CFL and the ATFL produced a large increase in I-E rotation but little change in AP displacement. Kjaersgaard-Anderson et al50 found that sectioning of the ATFL increased AP laxity and sectioning of the CFL increased inversion laxity. In addition, Lapointe et al41 reported that isolated sectioning of the ATFL increased anterior flexibility by 60% and combined damage to the ATFL and CFL increased flexibility by 57% in total inversion and eversion of the ankle-subtalar-joint complex. Direct comparisons of our data using comparable force or moment loading with those in the literature are difficult because the other in vitro investigations that examined ankle-subtalar-joint–complex laxity did not use the same loads. Loading the ankle-subtalar-joint complex with 50 N of AP force and 1000 N-mm of I-E force resulted in bone-laxity values 3 to 4 times greater than those we observed.36 Despite the lower magnitude of loading used, differences in dissection of the soft tissues from the ankle down to the level of the joint capsule and ligaments likely accounted for the larger laxity values reported.
Ankle-laxity values produced with the same force and moment loads we used have been reported with the portable ankle arthrometer.35,40 In a recent study,61 mean AP displacement was 18.29 mm (±4.39 mm) for uninjured ankles. In our earlier study of uninjured ankles, mean AP displacement was 17.51 mm (±5.4 mm), compared with 13.77 mm (±3.6 mm) for the intact ankles in the present study.35 In contrast, DiSanto et al40 reported a mean AP displacement of 10.62 mm (±2.6 mm) in uninjured ankles. The relatively large standard deviations indicate sizable variations in AP laxity among normal ankles. For I-E loading, range of motion was very similar among the studies. In the current study, we found a mean range of motion of 44.10° (±12.2°), which was only slightly less than the 46.19° (±12.2°) and 48.20° (±9.0°) range of motion reported by Kovaleski et al35 and DiSanto et al,40 respectively. Our current results are based on cadaveric ankles in which muscle action did not contribute to stability. In clinical practice, when partial tears or ruptures of the lateral ligaments are encountered, the muscular component of stability will also be present, at least to some extent. The in vivo laxity values, therefore, should be expected to be similar to or lower than those reported for the current study.
CONCLUSIONS
The development of a 6-degrees-of-freedom instrumented spatial kinematic linkage allows for measurement of the mechanical-laxity characteristics of the ankle-subtalar-joint complex. We used a portable ankle arthrometer to load and measure ankle-subtalar-joint laxity. Strong relationships between tibial-calcaneal bone motion and arthrometric measurements of ankle-subtalar-joint–complex laxity were shown. Sectioning the anterior talofibular ligament significantly increased anteroposterior displacement, and the sequential sectioning of the calcaneofibular ligament significantly increased inversion-eversion rotation. The observed increases in mechanical laxity show that the ankle arthrometer is capable of detecting ligamentous injury. Future investigations are warranted to establish the diagnostic merit of the ankle arthrometer through testing of uninjured and ligamentously injured ankles to evaluate the sensitivity and specificity of this device to accurately predict ankle-integrity status.
Footnotes
REFERENCES
- Hertel J, Denegar C R, Monroe M M, Stokes W L. Talocrural and subtalar joint instability after lateral ankle sprain. Med Sci Sports Exerc. 1999;31:1501–1508. doi: 10.1097/00005768-199911000-00002. [DOI] [PubMed] [Google Scholar]
- Rasmussen O, Kromann-Andersen C. Experimental ankle injuries: analysis of the traumatology of the ankle ligaments. Acta Orthop Scand. 1983;54:356–362. doi: 10.3109/17453678308996584. [DOI] [PubMed] [Google Scholar]
- Harrington K D. Degenerative arthritis of the ankle secondary to long-standing lateral ligament instability. J Bone Joint Surg Am. 1979;61:354–361. [PubMed] [Google Scholar]
- Karlsson J, Bergsten T, Lansinger O, Peterson L. Lateral instability of the ankle treated by the Evans procedure: a long-term clinical and radiological follow-up. J Bone Joint Surg Br. 1988;70:476–480. doi: 10.1302/0301-620X.70B3.3372575. [DOI] [PubMed] [Google Scholar]
- Gerber J P, Williams G N, Scoville C R, Arciero R A, Taylor D C. Persistent disability associated with ankle sprains: a prospective examination of an athletic population. Foot Ankle Int. 1998;19:653–660. doi: 10.1177/107110079801901002. [DOI] [PubMed] [Google Scholar]
- Colville M R. Surgical treatment of the unstable ankle. J Am Acad Orthop Surg. 1998;6:368–377. doi: 10.5435/00124635-199811000-00005. [DOI] [PubMed] [Google Scholar]
- Kaikkonen A, Lehtonen H, Kannus P, Jarvinen M. Long-term functional outcome after surgery of chronic ankle instability: a 5-year follow-up study of the modified Evans procedure. Scand J Med Sci Sports. 1999;9:239–244. doi: 10.1111/j.1600-0838.1999.tb00240.x. [DOI] [PubMed] [Google Scholar]
- Povacz P, Unger S F, Miller W K, Tockner R, Resch H. A randomized, prospective study of operative and non-operative treatment of injuries of the fibular collateral ligaments of the ankle. J Bone Joint Surg Am. 1998;80:345–351. doi: 10.2106/00004623-199803000-00006. [DOI] [PubMed] [Google Scholar]
- Yeung M S, Chan K, So C H, Yuan W Y. An epidemiological survey on ankle sprain. Br J Sports Med. 1994;28:112–116. doi: 10.1136/bjsm.28.2.112. [DOI] [PMC free article] [PubMed] [Google Scholar]
- Kannus P, Renstrom P. Treatment for acute tears of the lateral ligaments of the ankle: operation, cast, or early controlled mobilization? J Bone Joint Surg Am. 1991;73:305–312. [PubMed] [Google Scholar]
- Peters J W, Trevino S G, Renstrom P A. Chronic lateral ankle instability. Foot Ankle. 1991;12:182–191. doi: 10.1177/107110079101200310. [DOI] [PubMed] [Google Scholar]
- DiGiovanni B F, Fraga C J, Cohen B E, Shereff M J. Associated injuries found in chronic lateral ankle instability. Foot Ankle Int. 2000;21:809–815. doi: 10.1177/107110070002101003. [DOI] [PubMed] [Google Scholar]
- Hertel J. Functional instability following lateral ankle sprain. Sports Med. 2000;29:361–371. doi: 10.2165/00007256-200029050-00005. [DOI] [PubMed] [Google Scholar]
- Liu W, Siegler S, Techner L. Quantitative measurement of ankle passive flexibility using an arthrometer on sprained ankles. Clin Biomech (Bristol, Avon) 2001;16:237–244. doi: 10.1016/s0268-0033(00)00088-7. [DOI] [PubMed] [Google Scholar]
- Brantigan J W, Pedegana L R, Lippert F G. Instability of the subtalar joint: diagnosis by stress tomography in three cases. J Bone Joint Surg Am. 1977;59:321–324. [PubMed] [Google Scholar]
- Ishii T, Miyagawa S, Fukubayashi T, Hayashi K. Subtalar stress radiography using dorsiflexion and supination. J Bone Joint Surgery Br. 1996;78:56–60. [PubMed] [Google Scholar]
- Louwerens J W, Ginai A Z, van Linge B, Snijders C J. Stress radiography of the talocrural and subtalar joints. Foot Ankle Int. 1995;16:148–155. doi: 10.1177/107110079501600308. [DOI] [PubMed] [Google Scholar]
- Sammarco J. Biomechanics of the ankle, I: surface velocity and instant center of rotation in the sagittal plane. Am J Sports Med. 1977;5:231–234. doi: 10.1177/036354657700500603. [DOI] [PubMed] [Google Scholar]
- Karlsson J, Eriksson B I, Renstrom P A. Subtalar ankle instability: a review. Sports Med. 1997;5:337–346. doi: 10.2165/00007256-199724050-00005. [DOI] [PubMed] [Google Scholar]
- Pisani G. Chronic laxity of the subtalar joint. Orthopedics. 1996;19:431–437. doi: 10.3928/0147-7447-19960501-13. [DOI] [PubMed] [Google Scholar]
- Timins M E. MR imaging of the foot and ankle. Foot Ankle Clin. 2000;5:83–101. [PubMed] [Google Scholar]
- Trnka H J, Ivanic G, Trattnig S. Arthrography of the foot and ankle: ankle and subtalar joint. Foot Ankle Clin. 2000;5:49–62. [PubMed] [Google Scholar]
- Chandnani V P, Harper M T, Ficke J R, et al. Chronic ankle instability: evaluation with MR arthrography, MR imaging, and stress radiography. Radiology. 1994;192:189–194. doi: 10.1148/radiology.192.1.8208935. [DOI] [PubMed] [Google Scholar]
- Tohyama H, Beynnon B D, Renstrom P A, Theis M J, Fleming B C, Pope M H. Biomechanical analysis of the ankle anterior drawer test for anterior talofibular ligament injuries. J Orthop Res. 1995;13:609–614. doi: 10.1002/jor.1100130417. [DOI] [PubMed] [Google Scholar]
- Bahr R, Pena F, Shine J, et al. Mechanics of the anterior drawer and talar tilt tests: a cadaveric study of lateral ligament injuries of the ankle. Acta Orthop Scand. 1997;68:435–441. doi: 10.3109/17453679708996258. [DOI] [PubMed] [Google Scholar]
- Black H M, Brand R L, Eichelberger M R. An improved technique for the evaluation of ligamentous injury in severe ankle sprains. Am J Sports Med. 1978;6:276–282. doi: 10.1177/036354657800600510. [DOI] [PubMed] [Google Scholar]
- Marder R A. Current methods for the evaluation of ankle ligament injuries. J Bone Joint Surg Am. 1994;76:1103–1111. [Google Scholar]
- Rubin G, Witten M. The talar-tilt angle and the fibular collateral ligaments: a method for the determination of talar tilt. J Bone Joint Surg Am. 1960;42:311–326. [Google Scholar]
- Fujii T, Luo Z P, Kitaoka H B, An K N. The manual stress test may not be sufficient to differentiate ankle ligament injuries. Clin Biomech (Bristol, Avon) 2000;15:619–623. doi: 10.1016/s0268-0033(00)00020-6. [DOI] [PubMed] [Google Scholar]
- Van Hellemondt F J, Louwerens J WK, Sijbrandij E S, van Gils A P. Stress radiography and stress examination of the talocrural and subtalar joint on helical computed tomography. Foot Ankle Int. 1997;18:482–488. doi: 10.1177/107110079701800805. [DOI] [PubMed] [Google Scholar]
- Christensen J C, Dockery G L, Schuberth J M. Evaluation of ankle ligamentous insufficiency using the Telos ankle stress apparatus. J Am Podiatr Med Assoc. 1986;76:527–531. doi: 10.7547/87507315-76-9-527. [DOI] [PubMed] [Google Scholar]
- Frost S C, Amendola A. Is stress radiography necessary in the diagnosis of acute or chronic ankle instability? Clin J Sport Med. 1999;9:40–45. doi: 10.1097/00042752-199901000-00008. [DOI] [PubMed] [Google Scholar]
- Rijke A M, Jones B, Vierhout P A. Stress examination of traumatized lateral ligaments of the ankle. Clin Orthop. 1986;210:143–151. [PubMed] [Google Scholar]
- Martin D E, Kaplan P A, Kahler D M, Dussault R, Randolph B J. Retrospective evaluation of graded stress examination of the ankle. Clin Orthop. 1996;328:165–170. doi: 10.1097/00003086-199607000-00026. [DOI] [PubMed] [Google Scholar]
- Kovaleski J E, Gurchiek L R, Heitman R J, Hollis J M, Pearsall A W. Instrumented measurement of anteroposterior and inversion-eversion laxity of the normal ankle joint complex. Foot Ankle Int. 1999;20:808–814. doi: 10.1177/107110079902001210. [DOI] [PubMed] [Google Scholar]
- Hollis J M, Blasier R D, Flahiff C M. Simulated lateral ankle ligamentous injury: change in ankle stability. Am J Sports Med. 1995;23:672–677. doi: 10.1177/036354659502300606. [DOI] [PubMed] [Google Scholar]
- Siegler S, Wang D, Plasha E, Berman A T. Technique for in vivo measurement of the three-dimensional kinematics and laxity characteristics of the ankle joint complex. J Orthop Res. 1994;12:421–431. doi: 10.1002/jor.1100120315. [DOI] [PubMed] [Google Scholar]
- Siegler S, Lapointe S, Nobilini R, Berman A T. A six-degrees-of-freedom instrumented linkage for measuring the flexibility characteristics of the ankle joint complex. J Biomech. 1996;29:943–947. doi: 10.1016/0021-9290(95)00165-4. [DOI] [PubMed] [Google Scholar]
- Kirk T, Saha S, Bowman L S. A new ankle laxity tester and its use in the measurement of the effectiveness of taping. Med Eng Phys. 2000;22:723–731. doi: 10.1016/s1350-4533(01)00008-x. [DOI] [PubMed] [Google Scholar]
- DiSanto T J, Swanik C B, Swanik K A, Straub S J. Quantitative measurements of ankle laxity with an ankle arthrometer [abstract] J Athl Train. 2001;36(suppl):S-76. [Google Scholar]
- Lapointe S J, Siegler S, Hillstrom H, Nobilini R R, Mlodzienski A, Techner L. Changes in the flexibility characteristics of the ankle complex due to damage to the lateral ligaments: an in vitro and in vivo study. J Orthop Res. 1997;15:331–341. doi: 10.1002/jor.1100150304. [DOI] [PubMed] [Google Scholar]
- Siegler S, Chen J, Schneck C D. The three-dimensional kinematics and flexibility characteristics of the human ankle and subtalar joints—part I: kinematics. J Biomech Eng. 1988;110:364–373. doi: 10.1115/1.3108455. [DOI] [PubMed] [Google Scholar]
- Chen J, Siegler S, Schneck C D. The three-dimensional kinematics and flexibility characteristics of the human ankle and subtalar joint—part II: flexibility characteristics. J Biomech Eng. 1988;110:374–385. doi: 10.1115/1.3108456. [DOI] [PubMed] [Google Scholar]
- Hollis J M. Blue Bay Research, assignee. Ankle laxity measurement system. US patent 5 402 800. Apr 4, 1995.
- Kinzel G L, Hall A S, Jr, Hillberry B M. Measurement of the total motion between two body segments, I: analytical development. J Biomech. 1972;5:93–105. doi: 10.1016/0021-9290(72)90022-x. [DOI] [PubMed] [Google Scholar]
- Tranberg R, Karlsson D. The relative skin movement of the foot: a 2-D roentgen photogrammetry study. Clin Biomech. 1998;13:71–76. doi: 10.1016/s0268-0033(97)00052-1. [DOI] [PubMed] [Google Scholar]
- Leardini A, O'Connor J J, Catani F, Giannini S. The role of the passive structures in the mobility and stability of the human ankle joint: a literature review. Foot Ankle. 2000;21:602–615. doi: 10.1177/107110070002100715. [DOI] [PubMed] [Google Scholar]
- Kjaersgaard-Andersen P, Wethelund J O, Nielsen S. Lateral talocalcaneal instability following section of the calcaneofibular ligament: a kinesiologic study. Foot Ankle. 1987;7:355–361. doi: 10.1177/107110078700700612. [DOI] [PubMed] [Google Scholar]
- Kjaersgaard-Andersen P, Wethelund J O, Helmig P, Nielsen S. Effect of the calcaneofibular ligament on hindfoot rotation in amputation specimens. Acta Orthop Scand. 1987;58:135–138. doi: 10.3109/17453678709146459. [DOI] [PubMed] [Google Scholar]
- Kjaersgaard-Andersen P, Frich L H, Madsen F, Helmig P, Sogard P, Sojbjerg J O. Instability of the hindfoot after lesion of the lateral ankle ligaments: investigations of the anterior drawer and adduction maneuvers in autopsy specimens. Clin Orthop. 1991;266:170–179. [PubMed] [Google Scholar]
- Stephens M M, Sammarco G J. The stabilizing role of the lateral ligament complex around the ankle and subtalar joints. Foot Ankle. 1992;13:130–136. doi: 10.1177/107110079201300304. [DOI] [PubMed] [Google Scholar]
- Kerkhoffs G M, Blankevoort L, van Poll D, Marti R K, van Dijk C N. Anterior lateral ankle ligament damage and anterior talocrural-joint laxity: an overview of the in vitro reports in literature. Clin Biomech (Bristol, Avon) 2001;16:635–643. doi: 10.1016/s0268-0033(01)00054-7. [DOI] [PubMed] [Google Scholar]
- Burks R T, Morgan J. Anatomy of the lateral ankle ligaments. Am J Sports Med. 1994;22:72–77. doi: 10.1177/036354659402200113. [DOI] [PubMed] [Google Scholar]
- Shrout P E, Fleiss J L. Intraclass correlation: uses in assessing rater reliability. Psychol Bull. 1979;86:420–428. doi: 10.1037//0033-2909.86.2.420. [DOI] [PubMed] [Google Scholar]
- Denegar C R, Ball D W. Assessing reliability and precision of measurement: an introduction to intraclass correlation and standard error of measurement. J Sport Rehabil. 1993;2:35–42. [Google Scholar]
- Van Dijk C N, Mol B W, Lim L S, Marti R K, Bossuyt P M. Diagnosis of ligament rupture of the ankle joint: physical examination, arthrography, stress radiography and sonography compared in 160 patients after inversion trauma. Acta Orthop Scand. 1996;67:566–570. doi: 10.3109/17453679608997757. [DOI] [PubMed] [Google Scholar]
- Baker J M, Ouzounian T J. Complex ankle instability. Foot Ankle Clin. 2000;5:887–896. [PubMed] [Google Scholar]
- Cass J R, Settles H. Ankle instability: in vitro kinematics in response to axial load. Foot Ankle Int. 1994;15:134–140. doi: 10.1177/107110079401500308. [DOI] [PubMed] [Google Scholar]
- Parlasca R, Shoji H, D'Ambrosia R D. Effects of ligamentous injury on the ankle and subtalar joints: a kinematic study. Clin Orthop. 1979;140:266–272. [PubMed] [Google Scholar]
- Hollis J M, Blasier R D, Flahiff C M, Hofmann O E. Biomechanical comparison of reconstruction techniques in simulated lateral ankle ligament injury. Am J Sports Med. 1995;23:678–682. doi: 10.1177/036354659502300607. [DOI] [PubMed] [Google Scholar]
- Hubbard T J, Kaminski T W, Kovaleski J E. Do those with functional ankle instability have associated mechanical instability as measured by instrumented ankle arthrometry? [abstract] J Athl Train. 2002;37(suppl):S-21. [Google Scholar]