

Abstract
Objective: To measure and compare latency, electromechanical delay, and speed of motor response of the peroneus longus muscle in a large sample of subjects with healthy or unstable ankles.
Design and Setting: Subjects with healthy or unstable ankles underwent identical test procedures consisting of 6 consecutive, sudden 50° ankle-inversion movements in the standing position with full weight on the tested leg. Latency, first and second decelerations, and total inversion time were monitored. In a separate setting, electromechanical delay was measured during a voluntary ankle eversion.
Subjects: We tested 81 subjects (27 males, 54 females) with healthy ankles or unilateral or bilateral ankle instability: 40 individuals with 48 unstable ankles (18 males, 22 females; age range, 18 to 23 years), and 41 individuals with 46 healthy ankles (9 males, 32 females; age range 15 to 29 years).
Measurements: Using surface electromyography, the latency of the peroneus longus muscle was measured during sudden inversion. Simultaneously, using accelerometry, first and second decelerations were measured. Separately, the electromechanical delay was measured using electromyography and accelerometry.
Results: The time of the first deceleration was significantly shorter in subjects with unstable ankles (25.5 milliseconds versus 28.4 milliseconds for those with healthy ankles). The latency, total inversion time, second deceleration time, and electromechanical delay were not shown to be significantly different between healthy and unstable ankles.
Conclusions: The significantly shorter first deceleration during sudden inversion in the standing position in subjects with unstable ankles compared with subjects with healthy ankles is explained by less control of inversion speed in the first phase of the sudden inversion in unstable ankles. Our study does not confirm the results of the systematic literature search showing a longer latency in subjects with unstable ankles.
Keywords: standing ankle inversion, electromyography, latency, accelerometry, peroneal muscles, proprioception
Evidence-based reasoning in designing rehabilitation programs for patients with complaints of ankle instability can be documented if researchers can identify objective causes of the health problem. One plausible explanation of ankle instability is based on a low level of effective control during sudden ankle inversion. Control during sudden inversion can have active and passive components, active being the control through muscle intervention and passive being the control through resistance of soft tissue tension.
Active control can be evaluated through measurement of muscle strength or reflex speed of the muscles decelerating a possibly harmful ankle inversion. Using latency of the peroneal muscles as a measure of insufficient control can help us to recognize causes of instability. Two studies1,2 confirmed the reliability of the peroneal latency measurement during standing inversion. Latency of the peroneal muscles has been measured by a number of research teams in comparable experimental setups using sudden inversion in the standing position to document differences among subjects with healthy, sprained, and unstable ankles. A common characteristic for these studies is the invoked inversion angle of about 30°.3–13 The published results are controversial. A number of investigators have shown significantly lower peroneal latency in ankles after inversion-sprain trauma when compared with healthy ankles, whereas other investigations did not confirm those results.
Understanding the normal control mechanisms of a sudden joint-inversion movement, based on measuring and analyzing alterations of these mechanisms in affected ankles, is a prerequisite to evaluating treatment outcome. The aims of our study were to add original data for latency measured in a 50° sudden-inversion setting and to introduce other dependent variables, such as total inversion time, first and second deceleration times, and electromechanical delay.
METHODS
Experimental Design and Subjects
The experimental part of this study was a so-called ex-post facto design in which the behavior of subjects with unstable ankles was compared with that of subjects with healthy ankles during sudden inversion. The subjects' age range was 15 to 29 years. Inclusion criteria for the experimental group were a history of a traumatic lateral ankle sprain followed by pain, swelling, and inability to participate in recreational or other activities for at least 3 weeks; complaints of repetitive lateral ankle sprains causing pain and swelling for at least 48 hours; and having an insecure feeling of the ankle “giving way.” The exclusion criteria for the experimental group were having had a traumatic lateral ankle sprain or surgery to the ankle in the last 3 months; a lower extremity injury preventing the subject from putting full body weight on the tested ankle; and ankle inflammation at the time of testing.
All the criteria except the last one were verified by means of a questionnaire.3 The last criterion was assessed by clinical examination at the time of testing.
The inclusion criterion for the control group was having no history of an ankle injury or complaints in the foot and ankle. Subjects with a lower extremity injury were excluded.
The experimental group consisted of 40 individuals (18 males, 22 females; age range, 18 to 23 years) with ankle instability based on complaints of repetitive sprains after an inversion ankle trauma. The control group consisted of 41 individuals (9 males, 32 females; age range, 15 to 29 years) with healthy ankles. In the experimental group, 48 unstable ankles were tested, while in the control group, 46 healthy ankles were tested. All the subjects signed a written informed consent approved by Vrije Universiteit, Brussels, Belgium, which also approved the study.
Testing Procedure
The subjects stood on a custom-designed inversion platform, with both feet tightly fixed on independently movable trapdoors.3,14 Each foot was strapped with hook-and-loop tape strips in a sport shoe, which was fixed to the footplate of the platform in 40° of plantar flexion and 15° of adduction (Figure 1). The subject was asked to put full body weight on the unstable ankle.
Figure 1.
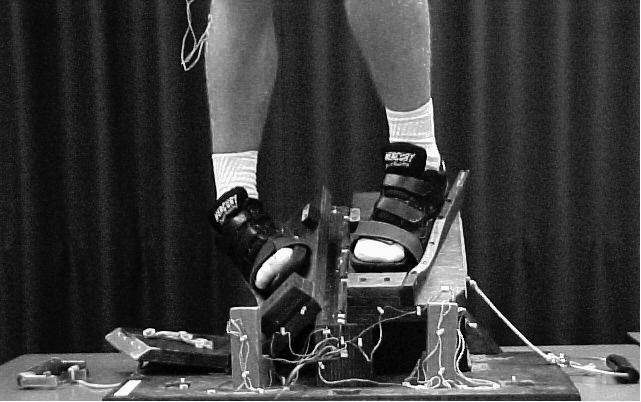
Inversion platform. Note the position in 40° of plantar flexion and 15° of inversion of the left foot (starting position). The end position of the sudden movement is 50° of inversion (right foot).
The operator, who was situated behind the subject, visually controlled if the knee of the tested leg was in extension and if the opposite knee was unloaded. That is, after the subject was instructed to put full weight on the tested leg and unload the opposite leg, the operator verified that these actions had occurred. The operator then launched a sudden inversion of 50°. The tilting of the platform occurred without warning, while the subject wore earphones and listened to music. Subjects were not allowed any external support before or during the perturbation. During the inversion, the acceleration and deceleration of the tilting trapdoor were measured with an accelerometer (model 4393, Brüel and Kjör, Naerum, Denmark) mounted on the platform. The accelerometer signal was amplified and subsequently integrated to a velocity signal using a charge amplifier (model 2635, Brüel and Kjör). The combined accelerometer and conditioning amplifier produced error values of ±3%. The change in velocity and the position in time of the falling platform are presented in 2 graphs on the computer screen (Figure 2).
Figure 2.

Electromyographic activity of the peroneus longus muscle (μV) and accelerometeric graph of inversion (milliseconds). 1, latency (milliseconds); 2, total inversion time (milliseconds); 3, time of first deceleration; and 4, time of second deceleration.
During the sudden inversion, electromyographic (EMG) activity of the peroneus longus muscle was recorded using an electromyograph (model 34, Siemens-Elema-Schonander, Erlangen, Germany) and silver surface electrodes (13 mm in diameter, 1-cm center-to-center distance). The electrodes were fixed at the level of the motor point of the peroneus longus. Upper and lower cut-off frequencies were 700 Hz and 25 Hz, respectively. In order to enhance electric conductance, the skin was shaved and rubbed with alcohol before electrode fixation, and an electrolyte paste was used between the skin and electrodes. The criterion for the onset of recording of the peroneus longus muscle EMG activity during the sudden inversion was an increase in the signal more than twice the noise level (see Figure 2).
The electromechanical delay (EMD) was measured in an additional experimental set-up. This EMD can be defined as the time lapse between the onset of EMG from the peroneus longus muscle and the start of the eversion movement recorded by the accelerometer. The instant of appearance of this movement (motor response), decelerating inversion during the sudden balance disturbance, was calculated by adding the EMD (measured during voluntary contraction) to the latency of the peroneus longus muscle (measured during standing inversion). At present, the EMD can only be measured during a concentric voluntary contraction. To measure the EMD of the peroneus longus muscle, subjects were seated with the lower leg supported by a chair and the foot in a relaxed position, not touching the chair. After an auditory signal, subjects were asked to move the foot as quickly as possible from a resting position into an everted position. We recorded the voluntary peroneal muscle movement using the accelerometer, which was attached to the forefoot with tape, and we recorded the latency of the movement via EMG.
In each set-up, all the signals were sampled simultaneously at 1000 Hz using a 12-bit A/D converter on a Macintosh II computer (Apple, Cupertino, CA) fitted with a data-acquisition card (model NB-M10–16, National Instruments Corp, Austin, TX) and LabVIEW data-processing software (version 2.0, National Instruments Corp). The chosen sampling rate gave a time-scale resolution of about 2 milliseconds, and time intervals were measured with accuracy of better than 3 milliseconds.
Safety was based on preliminary testing of subjects with healthy and unstable ankles showing no discomfort during and after the tests. At least 3 and no more than 6 inversions were recorded from each ankle.
Variables
An observer who was blinded to the identity of the participating individuals measured the following variables using the accelerometer and the EMG recording:
Total inversion time (milliseconds), or the total time between the start and the end of the tilting of the inversion platform (see Figure 2, line 2)
Timing of the first deceleration point (milliseconds), or the time interval between the start of the inversion and the occurrence of the first upward deflection of the velocity graph (see Figure 2, line 3)
Timing of the second deceleration point (milliseconds), or the time interval between the start of the inversion and the occurrence of the second upward deflection of the velocity graph during the sudden inversion (see Figure 2, line 4)
Latency of the peroneus longus muscle, or the time interval between the start of the inversion and the onset of EMG activity in the peroneus longus muscle (see Figure 2, line 1)
Electromechanical delay of the peroneus longus muscle (ms), measured in the sitting position as described above, as the time elapsed between the start of the EMG activity and the beginning of the movement of the foot into eversion
Motor response of the peroneus longus muscle, calculated as the sum of its latency (standing inversion) and its EMD (voluntary movement).
Data Analysis
Normality of the distributions was assessed with the Kolmogorow-Smirnow goodness-of-fit test, with the significance level set at P < .05. For each variable, we performed a t test for independent variables, in which differences between healthy and unstable ankles were calculated. The significance level was set at P < .05. F tests were used to ascertain homogeneity of variances.
RESULTS
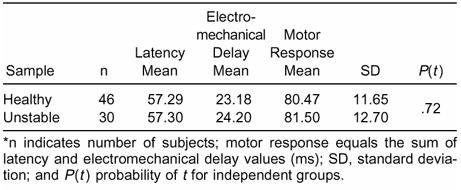
We found no significant difference (P = .27) in total inversion time between healthy and unstable ankles (Table 1). A significantly shorter mean time of appearance of the first deceleration point was noted in unstable ankles. This first deceleration time is responsible for protecting the ankle very quickly after the onset of inversion. Unstable ankles showed no significant differences for the time of the second deflection point or for latency when compared with healthy ankles. Electromechanical delay during voluntary eversion was not significantly different when comparing healthy (n = 46) with unstable ankles (Table 2; only 30 of the 48 were measured). The calculated motor response (latency + EMD) between the 2 groups was not significantly different (Table 3).
Table 1. Total Inversion Time, First Deceleration Point, Second Deceleration Point, and Latency Measured During Sudden Standing Ankle Inversion in Healthy (Control) and Unstable Ankles*
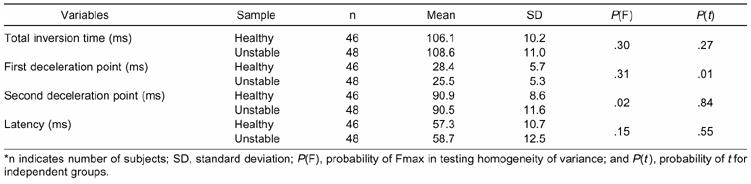
Table 2. Voluntary Electromechanical Delay Values (ms) in Seated Position of a Control Sample of Subjects with Healthy Ankles Compared with Subjects with Unstable Ankles
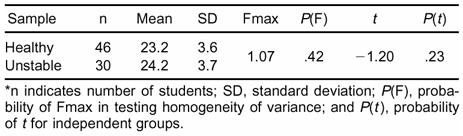
Table 3. Responses in Healthy (Control) and Unstable Ankles*
DISCUSSION
Systematic Literature Search
We searched MEDLINE and Web of Science for 1980–2001 using the key words human, latency, ankle instability, inversion, peroneal muscle, and electromyography. The retrieved studies were subsequently screened based on the following inclusion criteria: standing inversion, comparison of healthy and affected ankles, and posttraumatic or unstable ankles. Studies concerning the effectiveness of therapy, reliability of EMG, external ankle support, tape, and brace were excluded. Using this procedure, we included 11 studies.
In 5 of 11 comparable studies, latency of the peroneus longus muscle during a sudden inversion was significantly different between healthy ankles and affected ankles, while in 6 studies, it was not3–13 (Table 4). Latencies were significantly longer in affected ankles.
Table 4. Latencies of the Peroneus Longus Muscle as Reported in Studies Comparing Healthy and Unstable Ankles*
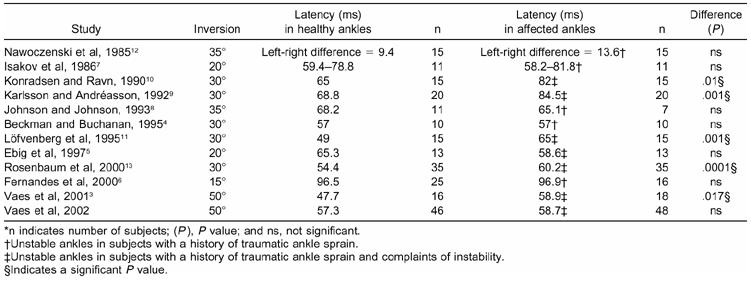
In 5 studies (marked † in Table 4), posttraumatic ankles were included without specifications concerning complaints of chronic instability. No significant difference was found between healthy and posttraumatic ankles in any of these studies. After eliminating these studies and considering only those specifying “functionally unstable ankles” as the affected ankles, only one nonsignificant result remains.5 Thus, a significantly longer latency in functionally unstable ankles compared with healthy was noted in 5 of 6 studies.
Peroneal Latency
According to Karlsson et al,15 10% to 20% of grade III sprained ankles develop instability. In 5 studies of normal subjects and those with posttraumatic ankles and complaints of instability, latency was not different between the groups during standing inversions of 18 to 35° (see Table 4). This could mean that muscle response, if it is affected at all, is not permanently delayed by the traumatic inversion.
Functional instability was described by Karlsson et al9 as “the subjective complaint of a patient; this is recurrent giving way of the ankle joint, apprehension or recurrent ligament sprain.” Of the 7 sets of authors studying sudden standing inversion in subjects with functionally unstable ankles (including our study), 5 showed significant longer peroneus longus muscle latency in unstable ankles. (see Table 4.)
When investigating the possible cause of the lack of consensus among the 7 studies, differences in defining the clinical characteristics are apparent. The criteria for selection of subjects reveal differences in methods. Although not the focus of this study, the criteria used to clinically define ankle instability should be understood. The following citations from 6 studies and the study presented here involving chronically unstable ankles illustrate how the selection of unstable and control ankles differed.
“Functional instability was considered to be present in subjects who complained of frequent sprains and or sensations of the ankle giving way. [Fifteen] had complaints of severe instability and used tape or ankle orthoses whenever participating in sports.” Controls were healthy subjects with functionally stable ankles.10
“Twenty individuals with unilateral ankle joint instability were tested. All these patients had a reduced activity level due to functional instability. All the patients had mechanical instability of the functionally unstable ankle, verified by standardized radiographic measurements….” Controls were contralateral unaffected ankles of the subjects presenting unilateral instability.9
“Thirteen patients with chronic lateral instability of the ankle for at least 12 months were included.” Matched control group had no history of ankle instability.11
“Active individuals with a history of unilateral inversion type ankle sprain were selected (questionnaire). Each subject's self-perception of a chronic, functionally unstable ankle, in addition to the history, was used as a means to identify suitability for inclusion into the study.” Controls were contralateral uninjured ankles of the subjects presenting unilateral instability.5
“Sixty-five patients with self reported ankle instability… detailed questionnaire was used to evaluate the patients history of instability and the frequency of inversion traumata.” Controls were contralateral stable legs of the subjects presenting unilateral ankle instability.13
“Subjects were categorized as having unstable ankles if they suffered from at least 1 traumatic ankle sprain that needed immobilization, with complaints of pain, swelling or stiffness lasting at least 3 weeks. The first trauma had to be followed by at least 2 ankle sprains, with complaints of pain and swelling lasting at least 2 days, or by a feeling of instability or complaints of repetitive sprains. A questionnaire (5 questions) was used to identify individuals with functionally unstable ankles.” Controls were subjects with bilateral stable ankles and unaffected contralateral ankles of subjects presenting unilateral instability.14
Another source of the observed bias may be the fact that controls can either be individuals with healthy ankles or the unaffected, contralateral ankles of subjects with unilateral unstable ankles. Evidence is growing for a difference in proprioception—as measured through kinesthesia or joint position sense—between bilaterally stable ankles and a unilateral stable ankle.16 This leads us to the following suggestions for further research:
Gravity of traumatic inversion sprain(s) in the history of included individuals should be stated;
A standard questionnaire should be used to recognize reliable criteria for chronic ankle instability (ie, how many sprains must a patient experience to be recognized as having an unstable ankle?);
Control subjects should preferably have bilateral healthy ankles;
Standing inversion tests should be standardized: maximal inversion angle, speed of inversion, construction of platform, distance between feet, weight on the tested ankle or on both feet, unexpected launching (headphones);
Comparability with “true sprain” remains to be questioned; when an individual sprains an ankle, the weight is not on both legs, and the individual is not standing but walking, running, or landing after a jump.
Total Inversion Time, First and Second Deceleration Times, and Electromechanical Delay
Standing with full body weight on 1 ankle and then suddenly having the support removed, provoking ankle inversion, initiates a fall that one could expect to be accelerating all the way down. The accelerometric screening of this movement, however, shows that this is not the case (see Figure 2). In all ankles, one can observe a systematic pattern of acceleration-deceleration-acceleration and deceleration before landing (ie, 2 deceleration points influencing total inversion time).
The total time between the start and the end of the trapdoor movement, or the total inversion time, informs us about the average speed of the inversion movement. Longer or shorter total inversion time indicates better or worse control of the inversion, respectively. A shorter total inversion time shows worse control of inversion because of higher inversion speed. This slower or faster inversion can be further analyzed using first and second deceleration times, based on the accelerometric graph.
Measuring first deceleration time can offer information about the strategy used by body motor control to avoid tissue damage during the first phase of the standing inversion. At this moment, inversion speed reduces. The time between the start of the inversion movement and the occurrence of the first upward deflection of the velocity curve is measured. Comparing the time of the first deceleration with the latency clarifies that this first deceleration cannot be caused by active muscle intervention.
Nevertheless, if the sum of the latency plus the EMD is shorter than the total inversion time (see Table 3), the muscles have time to contract and help protect ankle cartilage, joint capsule, and ligaments before the inversion causes tissue damage or to lessen the severity of the damage. Isakov et al,7 Johnson and Johnson,8 and Konradsen et al,17,18 however, claimed that muscle intervention is too slow to control ankle sprain. This statement seems to be clearly countered by our findings of accelerometric and EMG analysis of the 50° standing inversion.3 The total inversion time is estimated to be between 105 and 110 milliseconds, whereas the calculated motor response takes about 80 milliseconds. Yet one should be careful with this interpretation, considering that an ample recruitment of motor units is needed to generate sufficient power to actually decelerate the falling body weight.
The first deceleration point registered by the accelerometer could be due to passive slowing down of the inversion, and the observed second deceleration point could be an objective measure of active protection against the high-speed stretching during sudden inversion. Peroneus longus motor response could be responsible for this initiation of the inversion speed decrease as measured with the accelerometer. Looking at Tables 3 and 4, we can conclude that motor response, calculated at 80.47 and 81.50 milliseconds in stable and unstable ankles, respectively, comes very close to the 90.5 and 90.9 milliseconds of the second deceleration point. The question, “Is 10 milliseconds sufficient to recruit enough motor units?” could be a topic for further research.
The significantly shorter first deceleration during sudden inversion in the standing position in unstable compared with healthy ankles can be explained by less control of inversion speed in the first phase of the sudden inversion in unstable ankles. The initially passive control is shown to be less efficient in unstable ankles, which causes a very high inversion speed of up to 600°·s−1 in the first 25 milliseconds of the inversion.14,19
CONCLUSIONS
Our findings did not confirm the results of the systematic literature search showing a longer latency during sudden standing inversion in subjects with unstable ankles. No difference was found in latency comparing subjects with healthy and chronically unstable ankles using 50° of inversion. The early timing of the first deceleration points to a possible higher inversion speed in unstable ankles. This documents the need for early control of inversion, which is lacking in unstable ankles. Our results suggest that the motor response time is shorter than the total inversion time, possibly leaving time for the start of a protective muscle intervention before the inversion reaches 50°. Further research involving standardized testing procedures and clearly described inclusion criteria for subjects with unstable ankles should be conducted to determine if the time left is sufficient to recruit the necessary motor units.
Acknowledgments
ACKNOWLEDGMENTS
The research was supported by the Research Council of the Vrije Universiteit Brussel (OZR 96 N 1 95 3231 280).
REFERENCES
- Benesch S, Putz W, Rosenbaum D, Becker H. Reliability of peroneal reaction time measurements. Clin Biomech (Bristol, Avon) 2000;15:21–28. doi: 10.1016/s0268-0033(99)00026-1. [DOI] [PubMed] [Google Scholar]
- Hopper D, Allison G, Fernandes N, O'Sullivan L, Wharton A. Reliability of the peroneal latency in normal ankles. Clin Orthop. 1998;350:159–165. [PubMed] [Google Scholar]
- Vaes P, Van Gheluwe B, Duquet W. Control of acceleration during sudden ankle supination in people with unstable ankles. J Orthop Sports Phys Ther. 2001;31:741–752. doi: 10.2519/jospt.2001.31.12.741. [DOI] [PubMed] [Google Scholar]
- Beckman S M, Buchanan T S. Ankle inversion injury and hypermobility: effect on hip and ankle muscle electromyography onset latency. Arch Phys Med Rehabil. 1995;76:1138–1143. doi: 10.1016/s0003-9993(95)80123-5. [DOI] [PubMed] [Google Scholar]
- Ebig M, Lephart S M, Burdett R G, Miller M C, Pincivero D M. The effect of sudden inversion stress on EMG activity of the peroneal and tibialis anterior muscles in the chronically unstable ankle. J Orthop Sports Phys Ther. 1997;26:73–77. doi: 10.2519/jospt.1997.26.2.73. [DOI] [PubMed] [Google Scholar]
- Fernandes N, Allison G T, Hopper D. Peroneal latency in normal and injured ankles at varying angles of perturbation. Clin Orthop. 2000;375:193–201. doi: 10.1097/00003086-200006000-00023. [DOI] [PubMed] [Google Scholar]
- Isakov E, Mizrahi J, Solzi P, Susak L, Lotem L. Response of the peroneal muscles to sudden inversion of the ankle during standing. J Sport Biomech. 1986;2:100–109. [Google Scholar]
- Johnson M, Johnson C. EMG response of peroneal muscles in surgical and non-surgical injured ankles during sudden inversion. J Orthop Sports Phys Ther. 1993;18:497–501. doi: 10.2519/jospt.1993.18.3.497. [DOI] [PubMed] [Google Scholar]
- Karlsson J, Andréasson G O. The effect of external ankle support in chronic lateral ankle joint instability: an electromyographic study. Am J Sports Med. 1992;20:257–261. doi: 10.1177/036354659202000304. [DOI] [PubMed] [Google Scholar]
- Konradsen L, Ravn J B. Ankle instability caused by prolonged peroneal reaction time. Acta Orthop Scand. 1990;61:388–390. doi: 10.3109/17453679008993546. [DOI] [PubMed] [Google Scholar]
- Löfvenberg R, Kärrholm J, Sundelin G, Ahlgren O. Prolonged reaction time in patients with chronic lateral instability of the ankle. Am J Sports Med. 1995;23:414–417. doi: 10.1177/036354659502300407. [DOI] [PubMed] [Google Scholar]
- Nawoczenski D A, Owen M G, Ecker M L, et al. Objective evaluation of peroneal response to sudden inversion stress. J Orthop Sports Phys Ther. 1985;7:107–109. doi: 10.2519/jospt.1985.7.3.107. [DOI] [PubMed] [Google Scholar]
- Rosenbaum D, Becker H-P, Gerngross H, Claes L. Peroneal reaction times for diagnosis of functional ankle instability. Foot Ankle Surg. 2000;6:31–38. [Google Scholar]
- Vaes P, Duquet W, Casteleyn P P, Handelberg F, Opdecam P. Static and dynamic roentgenographic analysis of ankle stability in braced and nonbraced stable and functionally unstable ankles. Am J Sports Med. 1998;26:692–702. doi: 10.1177/03635465980260051601. [DOI] [PubMed] [Google Scholar]
- Karlsson J, Peterson L, Andréasson G, Högfors C. The unstable ankle: a combined EMG and biomechanical modeling study. Int J Sport Biomech. 1992;8:145–151. [Google Scholar]
- Waddington G, Adams R. Discrimination of active plantarflexion and inversion movements after ankle injury. Aust J Physiother. 1999;45:7–13. doi: 10.1016/s0004-9514(14)60335-4. [DOI] [PubMed] [Google Scholar]
- Konradsen L, Voigt M, Hojsgaard C. Ankle inversion injuries: the role of the dynamic defense mechanism. Am J Sports Med. 1997;25:54–58. doi: 10.1177/036354659702500110. [DOI] [PubMed] [Google Scholar]
- Konradsen L, Ravn J B, Sörensen A I. Proprioception at the ankle: the effect of anaesthetic blockade of ligament receptors. J Bone Joint Surg Br. 1993;75:433–436. doi: 10.1302/0301-620X.75B3.8496215. [DOI] [PubMed] [Google Scholar]
- Lynch S A, Eklund U, Gottlieb D, Renström P A, Beynnon B. Electromyographic latency changes in the ankle musculature during inversion moments. Am J Sports Med. 1996;24:362–369. doi: 10.1177/036354659602400319. [DOI] [PubMed] [Google Scholar]