

Abstract
Purpose
Cell adhesion molecule integrin αvβ3 is an excellent target for tumor interventions because of its unique expression on the surface of several types of solid tumor cells and on almost all sprouting tumor vasculatures. Here, we describe the development of near-infrared (NIR) fluorochrome Cy7-labeled RGD peptides for tumor integrin targeting.
Procedures
Mono-, di-, and tetrameric RGD peptides were synthesized and conjugated with Cy7. The integrin specificity of these fluorescent probes was tested in vitro for receptor binding assay and fluorescence microscopy and in vivo for subcutaneous U87MG tumor targeting.
Results
The tetrameric RGD peptide probe with the highest integrin affinity showed the highest tumor activity accumulation and strongest tumor-to-normal tissue contrast. This uptake is integrin-specific as the signal accumulated in the tumor can be effectively blocked by unconjugated RGD peptide antagonist of integrin αvβ3.
Conclusions
Noninvasive NIR fluorescence imaging is able to detect and semiquantify tumor integrin expression based upon the highly potent tetrameric RGD peptide probe.
Keywords: Near-infrared fluorescence imaging, Cy7, Integrin αvβ3, RGD peptide, Polyvalency
Introduction
Integrins are a family of adhesion molecules consisting of two noncovalently bound transmembrane subunits (α and β), both type I membrane proteins with large extracellular segments that pair to create heterodimers with distinct adhesive capabilities [1, 2]. In mammals, 18 α and 8 β subunits assemble into 24 different receptors. Increasing amounts of evidence now imply that integrin signaling plays a key role in tumor angiogenesis and metastasis [3–5]. Integrins expressed on endothelial cells modulate cell migration and survival during angiogenesis while integrins expressed on carcinoma cells potentiate metastasis by facilitating invasion and movement across blood vessels. Efficient tumor invasion requires partial degradation of the extracellular matrix (ECM) at the invasion front. Matrix metalloproteinases (MMPs) are the major proteases involved in remodeling the ECM [6]. The αvβ3 integrin, which binds to arginine–glycine–aspartic acid (RGD)-containing components of the interstitial matrix (such as vitronectin, fibronectin, and thrombospondin), is significantly up-regulated on endothelium during angiogenesis but not on quiescent endothelium [2, 5, 7]. The special role of integrin αvβ3 in tumor invasion and metastasis arises from its ability to recruit and activate MMP-2 and plasmin, which degrade components of the basement membrane and interstitial matrix [8]. Research has shown that tumor expression of integrin αvβ3 correlates well with tumor progression in several malignancies such as melanoma [9], glioma [10], and ovarian [11] and breast cancer [12, 13]. Inhibition of αv integrin activity by monoclonal antibodies (mAbs), cyclic RGD peptide antagonists, and peptidomimetics has also been shown to induce endothelial cell apoptosis [14], inhibit angiogenesis, and increase endothelial monolayer permeability [15].
The ability to noninvasively visualize and quantify integrin αvβ3 expression level will provide new opportunities to document tumor (tumor cells and sprouting tumor vasculature) integrin expression, to more appropriately select patients for anti-integrin treatment and to monitor treatment efficacy in integrin-positive patients [16]. Contrast-enhanced ultrasound with microbubbles targeted to αv integrins expressed on the neovascular endothelium has been used to image tumor integrin status in addition to tumor microvascular blood volume and blood velocity, which can be easily detected with nontargeted microbubbles [17, 18]. Paramagnetic nanoparticles have also been coated with either antibodies or small peptidic/peptidomimetic integrin αvβ3 antagonists to visualize leaky tumor neo-vasculature and proliferative angiogenic vessels in atherosclerosis [19, 20]. Various RGD peptides have also been labeled with gamma-emitting radioisotopes (such as 99mTc and 111In) for single-photon emission computed tomography (SPECT) and with positron-emitting radionuclides (such as 18F and 64Cu) for positron emission tomography (PET) imaging applications [10, 12, 13, 21–25].
Recently, we and others [26–28] have shown that near-infrared (NIR) fluorescent dyes conjugated cyclic RGD peptides were able to visualize subcutaneously inoculated integrin-positive tumors. In vivo imaging with a prototype three-dimensional small-animal imaging system allowed delineation of U87MG glioblastoma xenograft with high contrast with a wide range of concentrations of Cy5.5-labeled monomeric RGD peptide c(RGDyK) [26]. Another RGD peptide with slightly different sequences c(RGDfK) was also coupled with Cy5.5 for KS167 Kaposi’s sarcoma and with IRDye800 for M21 melanoma imaging with success [27, 28]. It is also noteworthy that a presumably inactive linear hexapeptide GRDSPK, after conjugation with an NIR carbocyanine molecular probe (Cypate), turns into a previously undescribed bioactive ligand (Cyp-GRD) that targets integrin-positive tumors [29].
Monomeric RGD peptide with moderate integrin receptor affinity after being labeled with radionuclides or fluorescent dyes resulted in relatively low tumor uptake and tumor-to-background contrast [10, 12, 24, 25]. Since the monomeric RGD peptide in the bent configuration has already been optimized to fit into the deep cleft between the α and β units of integrin αvβ3, it is very unlikely that one can further improve integrin affinity and selectivity of the monomer by fine-tuning the pentapeptide configuration [2, 30]. Polyvalency effect [31, 32] has thus been applied to develop dimeric and tetrameric RGD peptides, with repeating cyclic pentapeptide units connected by glutamates. The dimeric RGD peptide E[c(RGDyK)]2 with almost 1 order-of-magnitude higher binding affinity than the corresponding monomer c(RGDyK) was then labeled with 18F and 64Cu. Significantly increased tumor uptake and prolonged activity accumulation of the dimeric RGD peptide tracers [13, 22, 23] in the integrin-positive tumors prompted us to develop a tetrameric RGD peptide E{E[c(RGDfK)]2}2 [33]. Noninvasive microPET imaging studies with 64Cu-DOTA-E{E [c(RGDfK)]2}2 showed significant tumor uptake (up to 10% ID/g) and excellent tumor-to-background contrast of this radiotracer in the subcutaneous tumor-bearing mice. The presumed polyvalency effect and suitable apparent size of this tetrameric RGD peptide make it a superior ligand for integrin targeting in vivo. Despite the obviously improved tumor targeting efficacy of radiolabeled RGD tetramer as opposed to the dimers and monomers, fluorescent dye Cy5.5-conjugated tetramer had only moderate improvement of imaging character than the corresponding monomeric counterpart [34]. In this study, we wanted to assess whether dimeric and tetrameric RGD peptides, when labeled with NIR fluorescent dye Cy7, will be superior to the monomeric RGD peptide probe Cy7-c (RGDyK) in terms of tumor targeting efficacy and in vivo pharmacokinetics.
Materials and Methods
Materials
All 9-Fluorenylmethoxycarbonyl (Fmoc) amino acids, O-benzotri-azole-N,N,N′,N′-tetramethyl-uronium-hexafluoro-phosphate (HBTU), benzotriazol-1-yloxytris(dimethylamino) phosphonium hexafluoro-phosphate (BOP), N-hydroxybenzotriazole (HOBt), and 2-chlorotrityl chloride resin were purchased from Novabiochem (San Diego, CA, USA). N,N-Diisopropylethylamine (DIPEA), 1,1,1,3,3,3-hexafluoro-2-propanol (HFIP), anisole, N-hydroxysuccinimide (NHS), dicyclco-hexylcarbodiimide (DCC), sodium borate, and trifluoroacetic acid (TFA) were purchased from Sigma-Aldrich (St. Louis, MO, USA). Monofunctional hydroxysuccinimide of indocyanine 7 (Cy7-NHS) was obtained from GE Healthcare (Piscataway, NJ, USA), and all solvents were purchased from Fisher Scientific (Houston, TX, USA).
Synthesis of Cyclic Pentapeptide c(RGDyK)
Monomeric cyclic RGD peptide c(RGDyK) was synthesized as previously reported [35] with slight modification. The fully protected linear pentapeptide H-D-Tyr(OtBu)-Lys(Boc)-Arg(Pbf)-Gly-Asp(OtBu)-OH was cleaved from the resin by HFIP/DCM (3:7, v:v) without affecting the side-chain protecting groups. Head-to-tail cyclization was carried out in DMF solution (1 mg/mL) with BOP (3 eq.), HOBt (3 eq.), and DIPEA (6.6 eq.) at pH ~8.5. All side-chain protecting groups were then removed by TFA/H2O/anisole/DCM (90:5:2.5:2.5) at room temperature for one hour. The crude cyclic pentapeptide was purified by preparative reversed-phase high-performance liquid chromatography (HPLC, Dionex Summit® HPLC system; Dionex Corporation, Sunnyvale, CA, USA) using a Vydac protein and peptide column (218TP101522, 10–15 μm, 250 × 22 mm). The flow rate was 10 mL/min with the mobile phase changing from 95% solvent A (0.1% TFA in water) and 5% solvent B (0.1% TFA in acetonitrile) (0–10 minutes) to 35% solvent A and 65% solvent B at 40 minutes UV absorbance was monitored at 218 nm. MALDI-TOF MS: m/z = 620.2 for [M + H]+ (C28H43N9O8, calculated MW = 619.3).
Synthesis of Dimeric and Tetrameric RGD Peptides
Boc–Glu(OSu)–OSu
To a solution of Boc-protected glutamic acid (0.247 g, 1.0 mmol) in 5 mL DMF, we added NHS (0.253 g, 2.2 mmol) and DCC (0.453 g, 2.2 mmol). The resulting mixture was stirred at room temperature for 10 hours. The dicyclohexylurea (DCU) by-product was filtered off. The filtrate was evaporated to dryness under vacuum and then taken up in 3 mL methylene chloride. The remaining DCU was again filtered off. The filtrate was concentrated to about 1 mL and added dropwise into 30 mL ether. The desired product precipitated as white solid and was dried under vacuum (0.27 g, 61% yield). 1H NMR (CDCl3, δ): 5.23 (br s, 1H, NH), 4.82 (m, 1H, CH), 2.85 (m, 8H, succinimide group), 2.44–2.25 (m, 2H, CH2CO), 1.52 (m, 2H, CH2CH2CO), 1.46 (s, 9 H, t-Bu).
Dimeric RGD Peptide: E[c(RGDyK)]2
To a solution of Boc–Glu(OSu)–OSu (4.4 mg, 0.01 mmol) in anhydrous DMF (1 mL) was added c(RGDyK) (18.6 mg, 0.03 mmol). The pH of the resulting mixture was adjusted to 8.5 with DIPEA. The reaction was stirred at room temperature overnight. Without purification, the Boc group was removed by TFA/H2O/DCM (90:5:5). The solution was concentrated under vacuum and the crude product was purified HPLC (95% yield). MALDI-MS: m/z = 1,351 for [M + H]+ (C59H87N19O18, calculated MW = 1,350).
Tetrameric RGD Peptide: E{E[c(RGDyK)]2}2
The synthesis was carried out in a similar fashion as described above (92% yield). MALDI-MS: m/z = 2,801 for [M + H]+ (C121H177N39O39, calculated MW = 2,800).
Synthesis of Cy7-RGD Conjugates
RGD peptides c(RGDyK), E[c(RGDyK)]2, and E{E[c(RGDyK)]2}2 (1 μmol) in 0.25 mL of 0.1 mol/L sodium borate (Na2B4O7) buffer (pH = 8.5) were mixed with Cy7-NHS (1.2 mg, 1.1 μmol) in H2O (0.25 mL) at 4°C. The reaction vessel was wrapped under aluminum foil and the mixture was allowed to warm up to room temperature and react for two hours. The reaction was then quenched by adding 20 μL of 1% TFA. After HPLC purification, the Cy7-RGD conjugates were redissolved in saline at a concentration of 1 mg/mL, and stored in the dark at −20°C until use. The purified Cy7-RGD conjugates were characterized by MALDI-TOF MS. Cy7-c(RGDyK): m/z = 1,243.4 for [M + H]+ (C59H75N11O15S2, calculated MW = 1,242.42); Cy7-E[c(RGDyK)]2: m/z = 2,015.6 for [M + Na + K]+ (C90H118N21O25S2, calculated MW = 1,956.8); Cy7-E{E[c(RGDyK]2}2: m/z = 3,475.6 for [M + 2Na]+ (C155H212N41O45S2, calculated MW = 3,431.5).
Cell Culture
Human glioblastoma U87MG cell line was obtained from American Type Culture Collection (Manassas, VA, USA) and was cultured at 37°C in a humidified atmosphere containing 5% CO2 in Iscove’s modified Dulbecco’s medium supplemented with 5% fetal bovine serum (Life Technologies, Inc., Grand island, NY, USA) and 1 mM sodium pyruvate.
Cell Integrin Receptor Binding Assay
In vitro integrin-binding affinities and specificities of the Cy7-conjugated RGD peptides were evaluated via displacement cell-binding assays using 125I-echistatin as the integrin-specific radioligand. U87MG cells were harvested, washed twice with phosphate-buffered saline (PBS), and resuspended (2 × 10⁶ cells/ mL) in binding buffer (20 mM Tris, pH = 7.4, 150 mM NaCl, 2 mM CaCl2, 1 mM MgCl2, 1 mM MnCl2, and 0.1% bovine serum albumin). 96-well multiscreen DV plates (filter pore size: 0.65 μm; Millipore, Billerica, MA, USA) were seeded with 105 cells and incubated with 125I-echistatin (30,000 cpm/well) in the presence of increasing concentrations of different Cy7-conjugated RGD peptides (0–1,000 nM). The final volume was adjusted to 200 μL/well. After the cells were incubated for two hours at room temperature, the binding buffer was removed by vacuum. Receptor–ligand complex trapped on filters was washed three times with 200 μL ice-cold binding buffer. The hydrophilic PVDF filters were collected and the radioactivity was measured by using a NaI(Tl) gamma counter (Packard, Meriden, CT, USA). The best-fit IC50 values were calculated by fitting the data by nonlinear regression using GraphPad Prism™ (GraphPad Software, Inc., San Diego, CA, USA). Experiments were carried out twice with triplicate samples.
Cell Staining
U87MG cells were seeded on 35 mm MatTek glass bottom culture dishes. After 48 hours, the cells were washed twice with warm binding buffer and then incubated at 37°C with appropriate Cy7-RGD conjugate (1 μM) in binding buffer for 30 minutes. For the blocking study, unconjugated RGD peptide c(RGDyK) (20 μM) was added to the culture medium before the addition of Cy7-RGD conjugates. After incubation for 30 minutes, the cells were washed three times with ice-cold binding buffer. Fluorescence microscopy experiments were carried out by using a Zeiss Axiovert 200M fluorescence microscope (Carl Zeiss MicroImaging, Inc., Thornwood, NY, USA). A custom Cy7 filter set was used (excitation: 730/40 nm; emission: 770/40 nm; dichroic mirror: 760 nm; Omega Optical, Brattleboro, VT, USA).
Animal Models
Animal studies were performed according to a protocol approved by Stanford’s Administrative Panel on Laboratory Animal Care (A-PLAC). Female athymic nude mice (nu/nu) (four to six weeks old; Harlan, Inc., Indianapolis, IN, USA) were housed five per cage and fed with sterilized pellet chow and sterilized water. Mice were anesthetized in an isoflurane chamber before being injected subcutaneously in the right foreleg with 5 × 10⁶ U87MG cells suspended in 50 μL sterile PBS. Three to four weeks after inoculation, when the tumors reached 0.5–0.8 cm in diameter, the mice were used for in vivo imaging studies.
In vivo NIR Fluorescence Imaging
In vivo NIR fluorescence imaging was performed with an Xenogen IVIS™ 200 small animal imaging system (Xenogen, Alameda, CA, USA) with a Cy7 filter set (excitation: 680/30 nm; emission: 775/ 30 nm). The surface fluorescence intensity of the animal was measured and normalized to photons per second per centimeter squared per steradian (p/s/cm2/sr). Mice (n = 3 for each Cy7-RGD conjugate) were injected via tail vein with 500 pmol Cy7-RGD (mono-, di-, or tetramer), anesthetized, and imaged at various time points postinjection (p.i.). All fluorescence images were acquired with one second exposure (f/stop = 4). For receptor specificity study, mice injected with 500 pmol of the Cy7-RGD conjugate with or without coinjection of unconjugated c(RGDyK) (200 μg/mouse) were imaged at two hours, p.i., and then immediately euthanized by inhalation of carbon dioxide. The tumors and major organs and tissues were dissected and imaged again. The total fluorescence flux (p/s/cm2/sr) for each organ was measured. For quantitative comparison, regions of interests (ROIs) were drawn over tumor and normal tissues and the results were presented as mean ± standard deviation (SD) for a group of three animals.
Serum Stability
Cy7-RGD conjugate was incubated at 37°C in complete mouse serum (Sigma, St. Louis, MO, USA) and the fluorescence intensity was measured by using a FluoroMax-3 instrument (Jobin Yvon Inc., Edison, NJ, USA). Excitation wavelength was set at 720 nm and emission scan range was 750–790 nm. Relative fluorescence intensity at 775 nm over time was plotted.
Statistical Analysis
One-way analysis of variance (ANOVA) was used for statistical evaluation. Means were compared by using Student’s t-test. P value of <0.05 was considered significant.
Results
Synthesis of Cy7–RGD Conjugates
Cy7-labeled RGD peptides (Fig. 1) were synthesized by conjugation of Cy7-NHS with the ɛ-amino group of the lysine residue (in the case of monomeric RGD peptide) or the α-amino group of glutamine residue (in the cases of dimeric and tetrameric RGD peptides). HPLC retention time was 22.3, 26.7, and 26.3 minutes for Cy7-c(RGDyK), Cy7-E[c(RGDyK)]2, and Cy7-E{E[c(RGDyK)]2}2, respectively. The UV absorption and emission spectra of Cy7-RGD conjugates were similar to that of Cy 7 in aqueous solution, and no significant change in quantum yield was observed after conjugation (data not shown). Cy7 was chosen for this study because of its deeper tissue penetration, less scattering, and lower background autofluorescence compared to Cy5.5 (excitation/emission: 675/694 nm).
Fig. 1.
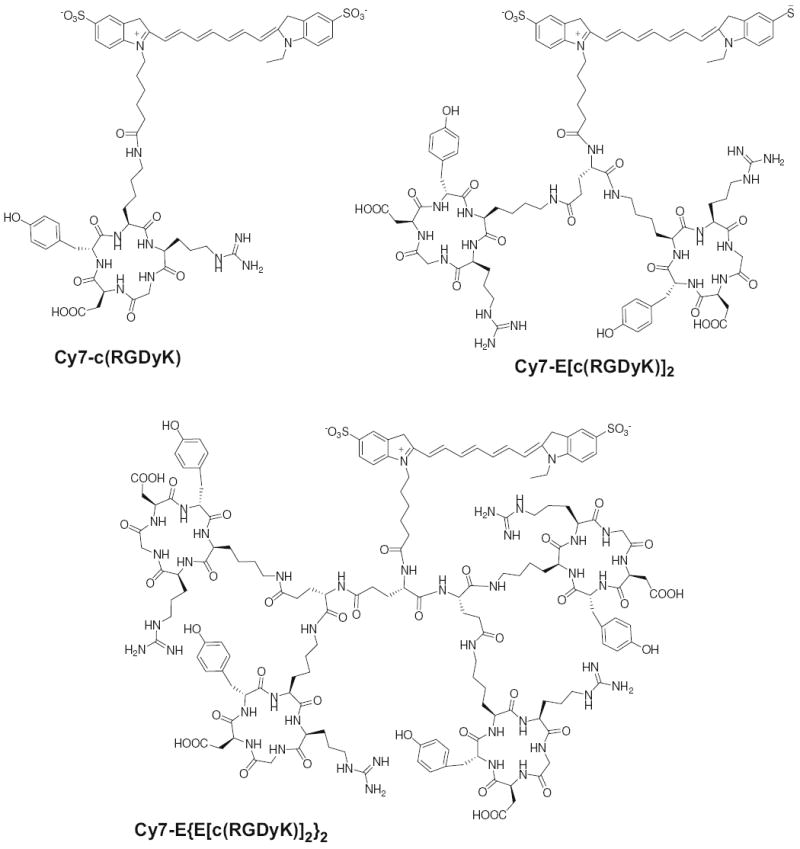
Chemical structures of Cy7-c(RGDyK), Cy7-E[c(RGDyK)]2, and Cy7-E{E[c(RGDyK)]2}2.
Cell Integrin Receptor Binding Assay
Receptor binding assay using integrin-positive U87MG cells and 125I-echistatin as radioligand revealed that all the peptides inhibited the binding of 125I-echistatin to the cell surface integrin receptor [24] (results are shown in Fig. 2). The affinity of the RGD peptides for integrin αvβ3 follows the order of E{E[c(RGDyK)]2}2 > E[c(RGDyK)]2 > c(RG DyK). Cy7 conjugation had minimal disturbance on the receptor affinity of all three peptides. IC50 values for Cy7-c(RGDyK), Cy7-E[c(RGDyK)]2, and Cy7-E{E[c(RGDyK)]2}2 were 70.1 ± 5.3, 28.2 ± 2.8, and 23.1 ± 2.1 nM, respectively (Table 1). P values were less than 0.01 when comparing Cy7-c(RGDyK) with the other two conjugates, whereas the IC50 values for Cy7-E[c(RGDyK)]2 and Cy7-E{E[c(RGDyK)]2}2 was not statistically different (P = 0.10).
Fig. 2.
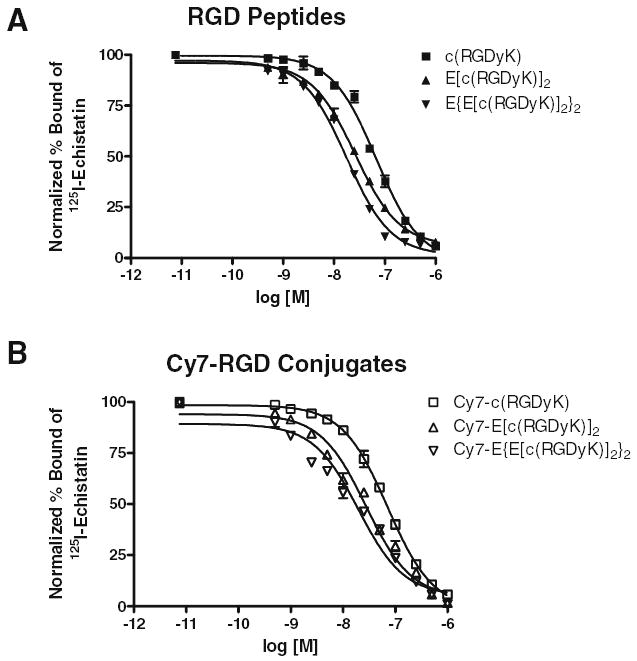
(A) In vitro inhibition of 125I-echistatin binding to integrin αvβ3 expressed on U87MG cells by c(RGDyK) (▪), E[c(EGDyK)]2 (▴), and E{E[c(EGDyK)]2}2 (▾). (B) In vitro inhibition of 125I-echistatin binding to integrin αvβ3 expressed on U87MG cells by Cy7-c(RGDyK) (□), Cy7-E[c(RGDyK)]2 (▵), and Cy7-E{E[c(RGDyK)]2}2 (▽). All data points were acquired from triplicates.
Table 1.
IC50 values of RGD peptides and Cy7-RGD conjugates on human glioblastoma U87MG cells
| Compounds | IC50 (nM) |
|---|---|
| c(RGDyK) | 67.9 ± 6.1 |
| E[c(RGDyK)]2 | 26.2 ± 1.7 |
| E{E[c(RGDyK)]2}2 | 17.7 ± 1.5 |
| Cy7-c(RGDyK) | 70.1 ± 5.3 |
| Cy7-E[c(RGDyK)]2 | 28.2 ± 2.8 |
| Cy7-E{E[c(RGDyK)]2}2 | 23.1 ± 2.5 |
Cell Staining
We examined the αvβ3 integrin specificity of the three Cy7-RGD conjugates. Prominent fluorescence signal was observed for cells stained with each of the three conjugates (Fig. 3F–H). In contrast, only weak signal was detected when the cells were incubated with the unconjugated Cy7 dye (Fig. 3E). It is also of note that fluorescence intensity of the stained cells follows the order of Cy7-E{E[c(RGDyK)]2}2 > Cy7-E[c(RGDyK)]2 > Cy7-c(RGDyK), corresponding with the integrin binding affinity of the conjugates. Incubation of cells with Cy7-RGD probes in the presence of a blocking dose of monomeric RGD peptide c(RGDyK) (20 μM) led to complete disappearance of cell-associated fluorescence (Fig. 3N–P). However, the RGD peptide had virtually no affect on the cellular uptake of Cy7 (Fig. 3M). This result further confirms the integrin αvβ3 specific binding of all three Cy7–RGD conjugates.
Fig. 3.
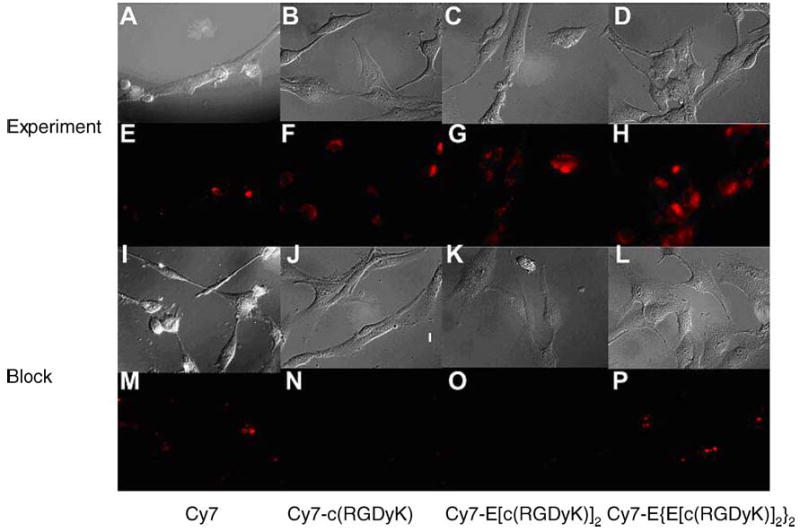
Fluorescence microscopy images of U87MG cells stained with 1 μM of Cy7, Cy7-c(RGDyK), Cy7-E[c(RGDyK)]2, and Cy7-E{E[c(RGDyK)]2}2 without (Experiment A–D: brightfield images; Experiment E–H: fluorescence images) and with (Block I–L: brightfield images; Block M–P: fluorescence images) 20 μM c(RGDyK).
In vivo NIR Fluorescence Imaging
Mice bearing subcutaneous U87MG tumor were intravenously injected with Cy7-c(RGDyK), Cy7-E[c(RGDyK)]2, Cy7-E{E[c(RGDyK)]2}2, or Cy7 at a dose of 500 pmol/mouse, and imaged at various time points p.i. (30 minutes, 1, 2, 4, and 24 hours). Fluorescence signal was clearly visualized in the U87MG tumor as early as 30 minutes p.i. for all three Cy7–RGD conjugates and the unconjugated Cy7 dye (Fig. 4). The fluorescence intensity in the tumor as a function of time is plotted in Fig. 5A. As can be seen from Figs. 4 and 5A, the fluorescence intensity in the tumor reached early maxima and slowly washed out. Cy7-E {E[c(RGD yK)]2}2 exhibited significantly higher accumulation in the tumor than the other three probes (P < 0.01). There is no noticeable difference between the tumor fluorescence intensity of Cy7-c(RGDyK)- and Cy7-E[c(RGDyK)]2-injected mice at early time points (0–4 hours, p.i.). However, due to the faster clearance rate of Cy7-c(RGDyK), the tumor-to-normal tissue (T/N) ratio is significantly lower than Cy7-E[c(RGDyK)]2 at 24 hours, p.i. (P < 0.005, Fig. 5B). The T/N ratio for Cy7-E{E[c(RGDyK)]2}2 peaked at two hours p.i. (4.35 ± 0.26), and kidneys were also clearly visualized due to renal clearance. It is of note that unconjugated Cy7 also have appreciable tumor uptake. Specific in vivo binding of Cy7–RGD conjugates to αvβ3 integrin was demonstrated by coinjection of unconjugated c(RGDyK) (200 μg/mouse) (Fig. 6A). Tumor contrast as quantified by ROI analysis of noninvasive optical imaging indicated that the T/N ratio was reduced from 2.50 ± 0.15 to 1.61 ± 0.08 for the monomer Cy7-c(RGDyK), 2.72 ± 0.08 to 1.58 ± 0.01 for the dimer Cy7-E[c(RGDyK)]2, and 4.35 ± 0.26 to 1.95 ± 0.02 for the tetramer Cy7-E{E[c(RGDyK)]2}2, respectively (Fig. 7A). Ex vivo evaluation of dissected organs at two hours p.i. of Cy7-RGD peptide conjugates with (block) or without (experiment) coinjection of c(RGDyK) revealed that fluorescence signal observed in the pelvis area during in vivo fluorescence imaging mainly originated from the probe uptake in the kidneys, liver, and gastrointestinal tracts (Figs. 6B and 7B). Accumulation of Cy7-E[c(RGDyK)]2 and Cy7-E{E[c (RGDyK)]2}2 is significantly higher in the kidneys than Cy7-c(RGDyK) due to the renal clearance of these two conjugates. Comparing Fig. 7A and B, it can be clearly seen that the difference in tumor fluorescence intensity between the “Experiment” and “Block” animals is significantly larger ex vivo (Fig. 7B) than in vivo (Fig. 7A), attributed to the absence of autofluorescence and scattering by the skin. Serum stability experiments demonstrated that the fluorescence signal of all three Cy7-RGD conjugates remained stable for 24 hours (Fig. 7C), clearly indicating that the fluorescence signal loss over time was attributable to the clearance of the Cy7-RGD conjugates.
Fig. 4.
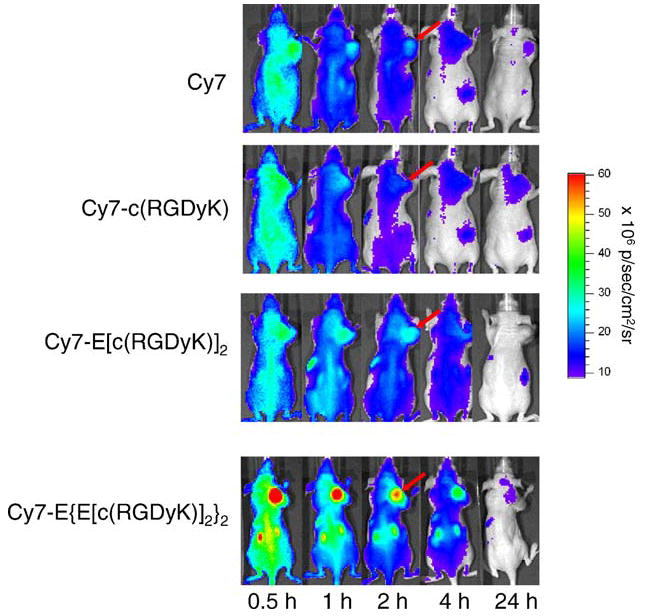
Direct comparison of whole-body NIR fluorescence imaging of subcutaneous U87MG tumor-bearing mice injected with 500 pmol Cy7, Cy7-c(RGDyK), Cy7-E[c(RGDyK)]2, or Cy7-E{E[c(RGDyK)]2}2 at 30 minutes, 1 hour, 2 hours, 4 hours, and 24 hours, p.i. Tumors are indicated by arrows and all images are normalized to the same scale.
Fig. 5.
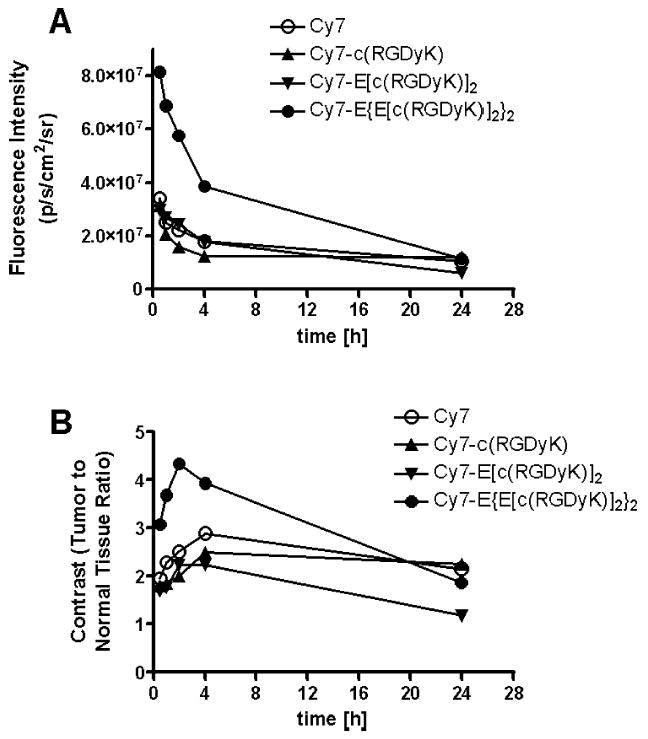
(A) Fluorescence intensity (p/s/cm2/sr) of the tumor as a function of time after injection of Cy7 (○), Cy7-c(RGDyK) (▴), Cy7-E[c(RGDyK)]2 (▾), or Cy7-E{E[c(RGDyK)]2}2 (•). (B) Tumor contrast (tumor/normal tissue ratio) as a function of time postadministration of the Cy7-RGD conjugates.
Fig. 6.
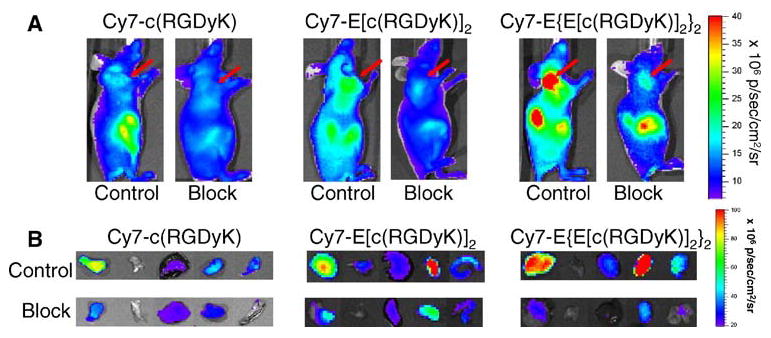
(A) Representative in vivo NIR fluorescence imaging (90° mounting angle) of U87MG tumor-bearing mice injected with Cy7-RGD conjugates (500 pmol) with (Block) and without (Control) coinjection of 200 μg/mouse of c(RGDyK) at 2 hours, p.i. Tumors are indicated by arrows. (B) Representative fluorescence images of dissected U87MG tumor and major organs and tissues after noninvasive imaging at 2 hours p.i.. From left to right: U87MG tumor, muscle, liver, kidney, and intestine.
Fig. 7.
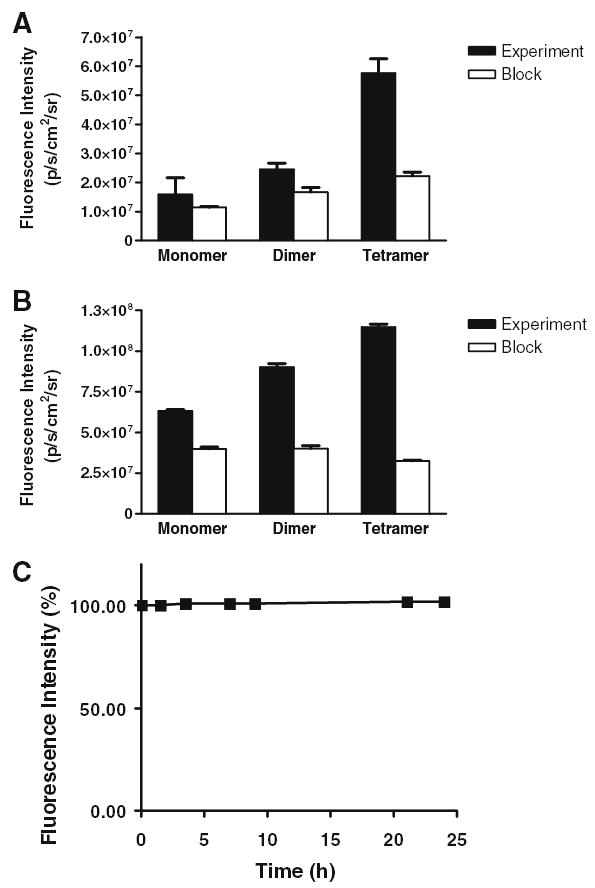
(A) ROI analysis of fluorescence intensity in vivo of U87MG tumor with (Block) and without (Experiment) coinjection of blocking dose of c(RGDyK) at 2 hours, p.i. (B) ROI analysis of dissected tumors of the same mice described in A. (C) Serum stability of Cy7-c(RGDyK). Fluorescence intensity at 775 nm over time was plotted (excitation: 720 nm).
Discussion
Despite the fact that integrin αvβ3 affinity of the three RGD peptide follows the order of tetramer > dimer > monomer, separate docking studies based on the crystal structure of the extracellular segment of integrin αvβ3 [30] and its complex with cyclic RGD peptide c(RGDf(NMe)V) [2] did not show the advantage of dimeric and tetrameric RGD peptides over monomeric RGD peptide based on the similar docking space (our unpublished results). We speculate that the observed higher affinity of tetramer over dimer, and dimer over monomer is likely related to receptor clustering. It has been shown that integrin clustering [36] is able to assemble multiple cytoplastic regulatory and structural proteins at sites of aggregated integrin cytoplasmic domains, activating certain intracellular signaling pathways. The presence of an integrin ligand with multimeric receptor binding sites also results in more efficient clustering of the ligand-bound integrins compared to the same surface density of ligand presented individually. We reason that dimeric and tetrameric RGD peptides tethered through glutamate linker(s) may locate the ligand in a manner in which binding of the first cyclic RGD peptide to one receptor will enhance the binding of the remaining RGD peptides in the vicinity to the other binding domains of the same receptor or to other closely clustered receptor subunits.
It is also of note that unconjugated Cy7 dye gives prominent tumor-to-background contrast. It has been reported that some fluorescent dyes are capable of tumor accumulation and have been investigated as potential contrast agents for the detection of tumors in both animal models and in humans. Such contrast is most likely attributable to passive targeting where bulky dye molecules diffuse more into the more permeable tumor vasculature as compared to normal vessels [37–39]. On the other hand, the fact that RGD peptide failed to block the tumor contrast induced by unconjugated Cy7 confirms the passive targeting of the fluorescent dye (data not shown).
The fluorescence intensity of the dissected tumors was significantly higher than that measured by ROI analysis of the noninvasive images. The extent of difference for the Cy7 conjugates, however, is less than that found for the Cy5.5 analogs [26]. This can be explained by the fact that Cy7 with longer wavelength absorption and emission provides deeper tissue penetration than Cy5.5 [40], which leads to less attenuation of fluorescence signal in vivo as compared to ex vivo quantification. Tumor-to-muscle ratio by ex vivo analysis was also much higher than the T/N ratio by analyzing the in vivo imaging data (Fig. 7A and B). Higher tumor/muscle contrast ex vivo may be explained by the more effective fluorescence detection of excised organs and tissues without attenuation of the excitation and emission light in and out of the skin as well as the scattering caused by the skin.
Cy7-conjugated RGD peptides exhibit more rapid tumor washout compared to the Cy5.5 analogs. Because Cy7 has only two sulfonate groups while Cy5.5 has four sulfonates on the aromatic rings, Cy5.5 is more hydrophilic than Cy7 and thus has reduced plasma protein binding and slower clearance by the liver, resulting in prolonged tumor retention of Cy5.5 than Cy7. Further development of NIR fluoro-chromes with better bioavailability (metabolic stability and hydrophilicity) and optical properties (high quantum yield and large Stokes shift) is needed to achieve better tumor integrin targeting of RGD peptide-based optical probes. It is also worth mentioning that we applied 2D imaging technology in this study. The imaging result can only be interpreted semiquantitatively. Fluorescence-mediated tomography [41] that is able to recover the spatial distribution of light emitting fluorophore and to quantify the nonuniform quantum yield distribution/fluorophore absorption within biological tissue may give more quantitative results.
Conclusions
The expression of integrin αvβ3 on sprouting capillary cells and its interactions with specific matrix ligands is essential for tumor angiogenesis and metastasis. Noninvasive imaging of integrin expression plays a key role in evaluating tumor angiogenesis and assessing antiangiogenic treatment efficacy. The studies described above demonstrate that it is feasible to detect and semiquantify tumor integrin status by noninvasive near-infrared fluorescence imaging. The tumor contrast of the resulting optical probes is related to the receptor affinity, overall molecular size, hydrophilicity, and fluorescence efficiency. Despite the limited penetration of light through tissue, this approach provides opportunities for rapid and cost-effective preclinical evaluation in animal models before the more costly radionuclide-based imaging techniques. In clinical settings, NIR fluorescence imaging may still be useful to delineate lesions that are near the surface (such as melanoma and breast cancer). Such technique will also be useful for fluorescence-guided surgery [42] via sensitive, specific, and real-time intraoperative visualization of molecular features of normal and diseased processes.
Acknowledgments
This work was supported, in part, by National Cancer Institute (NCI) Grant R21 CA102123, National Institute of Biomedical Imaging and Bioengineering (NIBIB) Grant R21 EB001785, Department of Defense (DOD) Breast Cancer Research Program (BCRP) IDEA Award W81XWH-04-1-0697, DOD Ovarian Cancer Research Program (OCRP) Award OC050120, DOD Prostate Cancer Research Program (PCRP) New Investigator Award (NIA) DAMD1717-03-1-0143, American Lung Association California (ALAC), the Society of Nuclear Medicine Education and Research Foundation, National Cancer Institute (NCI) Small Animal Imaging Resource Program (SAIRP) grant R24 CA93862, NCI In vivo Cellular Molecular Imaging Center (ICMIC) grant P50 CA114747, and NCI Centers of Cancer Nanotechnology Excellence (CCNE) U54 grant.
References
- 1.Ruoslahti E. RGD and other recognition sequences for integrins. Annu Rev Cell Dev Biol. 1996;12:697–715. doi: 10.1146/annurev.cellbio.12.1.697. [DOI] [PubMed] [Google Scholar]
- 2.Xiong JP, Stehle T, Zhang R, et al. Crystal structure of the extracellular segment of integrin αvβ3 in complex with an Arg–Gly–Asp ligand. Science. 2002;296:151–155. doi: 10.1126/science.1069040. [DOI] [PubMed] [Google Scholar]
- 3.Brooks PC, Clark RA, Cheresh DA. Requirement of vascular integrin αvβ3 for angiogenesis. Science. 1994;264:569–571. doi: 10.1126/science.7512751. [DOI] [PubMed] [Google Scholar]
- 4.Kumar CC. Integrin αvβ3 as a therapeutic target for blocking tumor-induced angiogenesis. Curr Drug Targets. 2003;4:123–131. doi: 10.2174/1389450033346830. [DOI] [PubMed] [Google Scholar]
- 5.Hood JD, Cheresh DA. Role of integrins in cell invasion and migration. Nat Rev Cancer. 2002;2:91–100. doi: 10.1038/nrc727. [DOI] [PubMed] [Google Scholar]
- 6.Egeblad M, Werb Z. New functions for the matrix metal-loproteinases in cancer progression. Nat Rev Cancer. 2002;2:161–174. doi: 10.1038/nrc745. [DOI] [PubMed] [Google Scholar]
- 7.Jin H, Varner J. Integrins: Roles in cancer development and as treatment targets. Br J Cancer. 2004;90:561–565. doi: 10.1038/sj.bjc.6601576. [DOI] [PMC free article] [PubMed] [Google Scholar]
- 8.Brooks PC, Stromblad S, Sanders LC, et al. Localization of matrix metalloproteinase MMP-2 to the surface of invasive cells by interaction with integrin αvβ3. Cell. 1996;85:683–693. doi: 10.1016/s0092-8674(00)81235-0. [DOI] [PubMed] [Google Scholar]
- 9.Schmieder AH, Winter PM, Caruthers SD, et al. Molecular MR imaging of melanoma angiogenesis with αvβ3-targeted paramagnetic nanoparticles. Magn Reson Med. 2005;53:621–627. doi: 10.1002/mrm.20391. [DOI] [PubMed] [Google Scholar]
- 10.Chen X, Park R, Hou Y, et al. MicroPET imaging of brain tumor angiogenesis with 18F-labeled PEGylated RGD peptide. Eur J Nucl Med Mol Imaging. 2004;31:1081–1089. doi: 10.1007/s00259-003-1452-2. [DOI] [PubMed] [Google Scholar]
- 11.Beck V, Herold H, Benge A, et al. ADAM15 decreases integrin αvβ3/vitronectin-mediated ovarian cancer cell adhesion and motility in an RGD-dependent fashion. Int J Biochem Cell Biol. 2005;37:590–603. doi: 10.1016/j.biocel.2004.08.005. [DOI] [PubMed] [Google Scholar]
- 12.Chen X, Park R, Tohme M, et al. MicroPET and autoradiographic imaging of breast cancer alpha v-integrin expression using 18F-and 64Cu-labeled RGD peptide. Bioconjug Chem. 2004;15:41–49. doi: 10.1021/bc0300403. [DOI] [PubMed] [Google Scholar]
- 13.Chen X, Liu S, Hou Y, et al. MicroPET imaging of breast cancer alphav-integrin expression with 64Cu-labeled dimeric RGD peptides. Mol Imaging Biol. 2004;6:350–359. doi: 10.1016/j.mibio.2004.06.004. [DOI] [PubMed] [Google Scholar]
- 14.Meerovitch K, Bergeron F, Leblond L, et al. A novel RGD antagonist that targets both αvβ3 and α5β1 induces apoptosis of angiogenic endothelial cells on type I collagen. Vascul Pharmacol. 2003;40:77–89. doi: 10.1016/s1537-1891(02)00339-7. [DOI] [PubMed] [Google Scholar]
- 15.Qiao RL, Yan W, Lum H, et al. Arg–Gly–Asp peptide increases endothelial hydraulic conductivity: Comparison with thrombin response. Am J Physiol. 1995;269:C110–C117. doi: 10.1152/ajpcell.1995.269.1.C110. [DOI] [PubMed] [Google Scholar]
- 16.Haubner R, Wester HJ. Radiolabeled tracers for imaging of tumor angiogenesis and evaluation of anti-angiogenic therapies. Curr Pharm Des. 2004;10:1439–1455. doi: 10.2174/1381612043384745. [DOI] [PubMed] [Google Scholar]
- 17.Leong-Poi H, Christiansen J, Klibanov AL, et al. Noninvasive assessment of angiogenesis by ultrasound and microbubbles targeted to αv-integrins. Circulation. 2003;107:455–460. doi: 10.1161/01.cir.0000044916.05919.8b. [DOI] [PubMed] [Google Scholar]
- 18.Ellegala DB, Leong-Poi H, Carpenter JE, et al. Imaging tumor angiogenesis with contrast ultrasound and microbubbles targeted to αvβ3. Circulation. 2003;108:336–341. doi: 10.1161/01.CIR.0000080326.15367.0C. [DOI] [PubMed] [Google Scholar]
- 19.Sipkins DA, Cheresh DA, Kazemi MR, et al. Detection of tumor angiogenesis in vivo by αvβ3-targeted magnetic resonance imaging. Nat Med. 1998;4:623–626. doi: 10.1038/nm0598-623. [DOI] [PubMed] [Google Scholar]
- 20.Winter PM, Morawski AM, Caruthers SD, et al. Molecular imaging of angiogenesis in early-stage atherosclerosis with αvβ3-integrin-targeted nanoparticles. Circulation. 2003;108:2270–2274. doi: 10.1161/01.CIR.0000093185.16083.95. [DOI] [PubMed] [Google Scholar]
- 21.Haubner R, Weber WA, Beer AJ, et al. Noninvasive visualization of the activated αvβ3 integrin in cancer patients by positron emission tomography and [18F]Galacto-RGD. PLoS Med. 2005;2:e70. doi: 10.1371/journal.pmed.0020070. [DOI] [PMC free article] [PubMed] [Google Scholar]
- 22.Chen X, Sievers E, Hou Y, et al. Integrin αvβ3-targeted imaging of lung cancer. Neoplasia. 2005;7:271–279. doi: 10.1593/neo.04538. [DOI] [PMC free article] [PubMed] [Google Scholar]
- 23.Chen X, Tohme M, Park R, et al. Micro-PET imaging of αvβ3-integrin expression with 18F-labeled dimeric RGD peptide. Mol Imaging. 2004;3:96–104. doi: 10.1162/15353500200404109. [DOI] [PubMed] [Google Scholar]
- 24.Chen X, Hou Y, Tohme M, et al. Pegylated Arg–Gly–Asp peptide: 64Cu labeling and PET imaging of brain tumor αvβ3-integrin expression. J Nucl Med. 2004;45:1776–1783. [PubMed] [Google Scholar]
- 25.Chen X, Park R, Shahinian AH, et al. 18F-labeled RGD peptide: Initial evaluation for imaging brain tumor angiogenesis. Nucl Med Biol. 2004;31:179–189. doi: 10.1016/j.nucmedbio.2003.10.002. [DOI] [PubMed] [Google Scholar]
- 26.Chen X, Conti PS, Moats RA. In vivo near-infrared fluorescence imaging of integrin αvβ3 in brain tumor xenografts. Cancer Res. 2004;64:8009–8014. doi: 10.1158/0008-5472.CAN-04-1956. [DOI] [PubMed] [Google Scholar]
- 27.Wang W, Ke S, Wu Q, et al. Near-infrared optical imaging of integrin αvβ3 in human tumor xenografts. Mol Imaging. 2004;3:343–351. doi: 10.1162/15353500200404148. [DOI] [PubMed] [Google Scholar]
- 28.Sunkuk K, Shi K, Houston JP, et al. Imaging dose-dependent pharmacokinetics of an RGD-fluorescent dye conjugate targeted to αvβ3 receptor expressed in Kaposi’s sarcoma. Mol Imaging. 2005;4:75–87. doi: 10.1162/15353500200505103. [DOI] [PubMed] [Google Scholar]
- 29.Achilefu S, Bloch S, Markiewicz MA, et al. Synergistic effects of light-emitting probes and peptides for targeting and monitoring integrin expression. Proc Natl Acad Sci USA. 2005;102:7976–7981. doi: 10.1073/pnas.0503500102. [DOI] [PMC free article] [PubMed] [Google Scholar]
- 30.Xiong JP, Stehle T, Diefenbach B, et al. Crystal structure of the extracellular segment of integrin αvβ3. Science. 2001;294:339–345. doi: 10.1126/science.1064535. [DOI] [PMC free article] [PubMed] [Google Scholar]
- 31.Vagner J, Handl HL, Gillies RJ, et al. Novel targeting strategy based on multimeric ligands for drug delivery and molecular imaging: Homooligomers of α-MSH. Bioorg Med Chem Lett. 2004;14:211–215. doi: 10.1016/j.bmcl.2003.09.079. [DOI] [PubMed] [Google Scholar]
- 32.Rao J, Lahiri J, Isaacs L, et al. A trivalent system from vancomycin. D-Ala–D-Ala with higher affinity than avidin–biotin. Science. 1998;280:708–711. doi: 10.1126/science.280.5364.708. [DOI] [PubMed] [Google Scholar]
- 33.Wu Y, Zhang X, Xiong Z, et al. MicroPET imaging of glioma integrin αvβ3 expression using 64Cu-labeled tetrameric RGD peptide. J Nucl Med. 2005;46:1707–1718. [PubMed] [Google Scholar]
- 34.Cheng Z, Wu Y, Xiong Z, Gambhir SS, Chen X. Near-infrared fluorescent RGD peptides for optical imaging of integrin αvβ3 expression in living mice. Bioconjug Chem. 2005;16:1433–1441. doi: 10.1021/bc0501698. [DOI] [PMC free article] [PubMed] [Google Scholar]
- 35.Chen X, Park R, Shahinian AH, Bading JR, Conti PS. Pharmacokinetics and tumor retention of 125I-labeled RGD peptide are improved by PEGylation. Nucl Med Biol. 2004;31:11–19. doi: 10.1016/j.nucmedbio.2003.07.003. [DOI] [PubMed] [Google Scholar]
- 36.Maheshwari G, Brown G, Lauffenburger DA, et al. Cell adhesion and motility depend on nanoscale RGD clustering. J Cell Sci. 2000;113:1677–1686. doi: 10.1242/jcs.113.10.1677. [DOI] [PubMed] [Google Scholar]
- 37.Reynolds JS, Troy TL, Mayer RH, et al. Imaging of spontaneous canine mammary tumors using fluorescent contrast agents. Photochem Photobiol. 1999;70:87–94. [PubMed] [Google Scholar]
- 38.Haglund MM, Berger MS, Hochman DW. Enhanced optical imaging of human gliomas and tumor margins. Neurosurgery. 1996;38:308–317. doi: 10.1097/00006123-199602000-00015. [DOI] [PubMed] [Google Scholar]
- 39.Licha K, Riefke B, Ntziachristos V, et al. Hydrophilic cyanine dyes as contrast agents for near-infrared tumor imaging: Synthesis, photophysical properties and spectroscopic in vivo characterization. Photochem Photobiol. 2000;72:392–398. doi: 10.1562/0031-8655(2000)072<0392:hcdaca>2.0.co;2. [DOI] [PubMed] [Google Scholar]
- 40.Ntziachristos V, Bremer C, Weissleder R. Fluorescence imaging with near-infrared light: New technological advances that enable in vivo molecular imaging. Eur Radiol. 2003;13:195–208. doi: 10.1007/s00330-002-1524-x. [DOI] [PubMed] [Google Scholar]
- 41.Montet X, Ntziachristos V, Grimm J, Weissleder R. Tomographic fluorescence mapping of tumor targets. Cancer Res. 2005;65:6330–6336. doi: 10.1158/0008-5472.CAN-05-0382. [DOI] [PubMed] [Google Scholar]
- 42.De Grand AM, Frangioni JV. An operational near-infrared fluorescence imaging system prototype for large animal surgery. Technol Cancer Res Treat. 2003;2:553–562. doi: 10.1177/153303460300200607. [DOI] [PubMed] [Google Scholar]